• Trade
  • Markets
  • Copy
  • Contests
  • News
  • 24/7
  • Calendar
  • Q&A
  • Chats
Trending
Screeners
SYMBOL
LAST
BID
ASK
HIGH
LOW
NET CHG.
%CHG.
SPREAD
SPX
S&P 500 Index
6886.69
6886.69
6886.69
6900.68
6824.70
+46.18
+ 0.68%
--
DJI
Dow Jones Industrial Average
48057.74
48057.74
48057.74
48197.30
47462.94
+497.46
+ 1.05%
--
IXIC
NASDAQ Composite Index
23654.15
23654.15
23654.15
23704.08
23435.17
+77.67
+ 0.33%
--
USDX
US Dollar Index
98.550
98.630
98.550
98.720
98.490
-0.040
-0.04%
--
EURUSD
Euro / US Dollar
1.17048
1.17056
1.17048
1.17070
1.16821
+0.00100
+ 0.09%
--
GBPUSD
Pound Sterling / US Dollar
1.33747
1.33757
1.33747
1.33917
1.33578
-0.00050
-0.04%
--
XAUUSD
Gold / US Dollar
4216.52
4216.95
4216.52
4247.68
4204.22
-11.70
-0.28%
--
WTI
Light Sweet Crude Oil
57.663
57.693
57.663
58.772
57.584
-1.014
-1.73%
--

Community Accounts

Signal Accounts
--
Profit Accounts
--
Loss Accounts
--
View More

Become a signal provider

Sell trading signals to earn additional income

View More

Guide to Copy Trading

Get started with ease and confidence

View More

Signal Accounts for Members

All Signal Accounts

Best Return
  • Best Return
  • Best P/L
  • Best MDD
Past 1W
  • Past 1W
  • Past 1M
  • Past 1Y

All Contests

  • All
  • Trump Updates
  • Recommend
  • Stocks
  • Cryptocurrencies
  • Central Banks
  • Featured News
Top News Only
Share

Mexico Tariff Hike To Impact $1 Billion Worth Of India Car Exports - Sources, Industry Group Letter

Share

Swiss National Bank: Baseline Scenario, Anticipates Growth In The Global Economy Will Be Moderate Over The Coming Quarters

Share

Swiss National Bank: Although US Tariffs And Trade Policy Uncertainty Weighed On The Global Economy, Economic Development In Many Countries Has Thus Far Remained More Resilient Than Had Been Assumed

Share

Swiss National Bank: Economic Outlook For Switzerland Has Improved Slightly Due To The Lower US Tariffs Andsomewhat Better Development Globally

Share

Swiss National Bank: Main Risk To The Economic Outlook For Switzerland Is The Development Of The Globaleconomy

Share

SNB Sees Q3 2028 Inflation At 0.8%

Share

Swiss National Bank: Inflationary Pressure Is Virtually Unchanged Compared To The Last Monetary Policy Assessment

Share

SNB Sees 2026 Swiss GDP At Around 1% (Previous Forecast Was For Around 1%)

Share

SNB Sees 2025 Swiss GDP At Around 1.5% (Previous Forecast Was For 1.0-1.5%)

Share

Banks' Sight Deposits Held At The SNB Will Be Remunerated At The SNB Policy Rate Up To A Certain Threshold

Share

SNB Sees 2027 Inflation At 0.6% (Previous Forecast Was For 0.7%)

Share

SNB Sees 2026 Inflation At 0.3% (Previous Forecast Was For 0.5%)

Share

SNB Sees 2025 Inflation At 0.2% (Previous Forecast Was For 0.2%)

Share

SNB: Remain Willing To Be Active In The Foreign Exchange Market As Necessary

Share

Swiss National Bank Keeps Interest Rate Unchanged At 0.00%

Share

French Otc Day-Ahead Baseload Power Price Up 9% At 82 EUR/Mwh - Lseg Data

Share

Russian Foreign Minister Lavrov: The Root Causes Of The Conflict Need To Be Resolved - NATO Membership For Ukraine Is Unacceptable For Russia

Share

Russian Foreign Minister Lavrov: There Should Be Security Guarantees For All Sides

Share

Oman Oct Conventional Bank Lending +8.57% Year-On-Year - Central Bank

Share

Russian Foreign Minister Lavrov: We Want A Package Of Documents On A Long-Term Sustainable Peace For Ukraine

TIME
ACT
FCST
PREV
U.S. EIA Weekly Gasoline Stocks Change

A:--

F: --

P: --

U.S. EIA Weekly Crude Demand Projected by Production

A:--

F: --

P: --

U.S. EIA Weekly Cushing, Oklahoma Crude Oil Stocks Change

A:--

F: --

P: --

U.S. EIA Weekly Crude Stocks Change

A:--

F: --

P: --

U.S. EIA Weekly Crude Oil Imports Changes

A:--

F: --

P: --

U.S. EIA Weekly Heating Oil Stock Changes

A:--

F: --

P: --

U.S. Refinitiv/Ipsos Primary Consumer Sentiment Index (PCSI) (Dec)

A:--

F: --

P: --

China, Mainland M1 Money Supply YoY (Nov)

--

F: --

P: --

China, Mainland M0 Money Supply YoY (Nov)

--

F: --

P: --

China, Mainland M2 Money Supply YoY (Nov)

--

F: --

P: --

Russia CPI YoY (Nov)

A:--

F: --

P: --

U.S. Federal Funds Rate Projections-Longer Run (Q4)

A:--

F: --

P: --

U.S. Federal Funds Rate Projections-1st Year (Q4)

A:--

F: --

P: --

U.S. Target Federal Funds Rate Lower Limit (Overnight Reverse Repo Rate)

A:--

F: --

P: --

U.S. Federal Funds Rate Projections-2nd Year (Q4)

A:--

F: --

P: --

U.S. Budget Balance (Nov)

A:--

F: --

P: --

U.S. Target Federal Funds Rate Upper Limit (Excess Reserves Ratio)

A:--

F: --

P: --

U.S. Interest Rate On Reserve Balances

A:--

F: --

P: --

U.S. Federal Funds Rate Projections-Current (Q4)

A:--

F: --

P: --

U.S. Federal Funds Rate Target

A:--

F: --

P: --

U.S. Federal Funds Rate Projections-3rd Year (Q4)

A:--

F: --

P: --

FOMC Statement
FOMC Press Conference
Brazil Selic Interest Rate

A:--

F: --

P: --

U.K. 3-Month RICS House Price Balance (Nov)

A:--

F: --

P: --

Australia Employment (Nov)

A:--

F: --

P: --

Australia Full-time Employment (SA) (Nov)

A:--

F: --

P: --

Australia Unemployment Rate (SA) (Nov)

A:--

F: --

P: --

Australia Labor Force Participation Rate (SA) (Nov)

A:--

F: --

P: --

Turkey Retail Sales YoY (Oct)

A:--

F: --

P: --

South Africa Mining Output YoY (Oct)

--

F: --

P: --

South Africa Gold Production YoY (Oct)

--

F: --

P: --

Italy Quarterly Unemployment Rate (SA) (Q3)

--

F: --

P: --

IEA Oil Market Report
Turkey 1-Week Repo Rate

--

F: --

P: --

South Africa Refinitiv/Ipsos Primary Consumer Sentiment Index (PCSI) (Dec)

--

F: --

P: --

Turkey Overnight Lending Rate (O/N) (Dec)

--

F: --

P: --

Turkey Late Liquidity Window Rate (LON) (Dec)

--

F: --

P: --

U.K. Refinitiv/Ipsos Primary Consumer Sentiment Index (PCSI) (Dec)

--

F: --

P: --

Brazil Retail Sales MoM (Oct)

--

F: --

P: --

U.S. Weekly Continued Jobless Claims (SA)

--

F: --

P: --

U.S. Exports (Sept)

--

F: --

P: --

U.S. Trade Balance (Sept)

--

F: --

P: --

U.S. Weekly Initial Jobless Claims (SA)

--

F: --

P: --

Canada Imports (SA) (Sept)

--

F: --

P: --

U.S. Initial Jobless Claims 4-Week Avg. (SA)

--

F: --

P: --

Canada Trade Balance (SA) (Sept)

--

F: --

P: --

Canada Exports (SA) (Sept)

--

F: --

P: --

U.S. Wholesale Sales MoM (SA) (Sept)

--

F: --

P: --

U.S. EIA Weekly Natural Gas Stocks Change

--

F: --

P: --

U.S. 30-Year Bond Auction Avg. Yield

--

F: --

P: --

Argentina CPI MoM (Nov)

--

F: --

P: --

Argentina National CPI YoY (Nov)

--

F: --

P: --

Argentina 12-Month CPI (Nov)

--

F: --

P: --

U.S. Weekly Treasuries Held by Foreign Central Banks

--

F: --

P: --

Japan Industrial Output Final MoM (Oct)

--

F: --

P: --

Japan Industrial Output Final YoY (Oct)

--

F: --

P: --

Germany HICP Final YoY (Nov)

--

F: --

P: --

Germany HICP Final MoM (Nov)

--

F: --

P: --

Germany CPI Final MoM (Nov)

--

F: --

P: --

Germany CPI Final YoY (Nov)

--

F: --

P: --

Q&A with Experts
    • All
    • Chatrooms
    • Groups
    • Friends
    Connecting
    .
    .
    .
    Type here...
    Add Symbol or Code

      No matching data

      All
      Trump Updates
      Recommend
      Stocks
      Cryptocurrencies
      Central Banks
      Featured News
      • All
      • Russia-Ukraine Conflict
      • Middle East Flashpoint
      • All
      • Russia-Ukraine Conflict
      • Middle East Flashpoint
      Search
      Products

      Charts Free Forever

      Chats Q&A with Experts
      Screeners Economic Calendar Data Tools
      Membership Features
      Data Warehouse Market Trends Institutional Data Policy Rates Macro

      Market Trends

      Market Sentiment Order Book Forex Correlations

      Top Indicators

      Charts Free Forever
      Markets

      News

      News Analysis 24/7 Columns Education
      From Institutions From Analysts
      Topics Columnists

      Latest Views

      Latest Views

      Trending Topics

      Top Columnists

      Latest Update

      Signals

      Copy Rankings Latest Signals Become a signal provider AI Rating
      Contests
      Brokers

      Overview Brokers Assessment Rankings Regulators News Claims
      Broker listing Forex Brokers Comparison Tool Live Spread Comparison Scam
      Q&A Complaint Scam Alert Videos Tips to Detect Scam
      More

      Business
      Events
      Careers About Us Advertising Help Center

      White Label

      Data API

      Web Plug-ins

      Affiliate Program

      Awards Institution Evaluation IB Seminar Salon Event Exhibition
      Vietnam Thailand Singapore Dubai
      Fans Party Investment Sharing Session
      FastBull Summit BrokersView Expo
      Recent Searches
        Top Searches
          Markets
          News
          Analysis
          User
          24/7
          Economic Calendar
          Education
          Data
          • Names
          • Latest
          • Prev

          View All

          No data

          Scan to Download

          Faster Charts, Chat Faster!

          Download App
          English
          • English
          • Español
          • العربية
          • Bahasa Indonesia
          • Bahasa Melayu
          • Tiếng Việt
          • ภาษาไทย
          • Français
          • Italiano
          • Türkçe
          • Русский язык
          • 简中
          • 繁中
          Open Account
          Search
          Products
          Charts Free Forever
          Markets
          News
          Signals

          Copy Rankings Latest Signals Become a signal provider AI Rating
          Contests
          Brokers

          Overview Brokers Assessment Rankings Regulators News Claims
          Broker listing Forex Brokers Comparison Tool Live Spread Comparison Scam
          Q&A Complaint Scam Alert Videos Tips to Detect Scam
          More

          Business
          Events
          Careers About Us Advertising Help Center

          White Label

          Data API

          Web Plug-ins

          Affiliate Program

          Awards Institution Evaluation IB Seminar Salon Event Exhibition
          Vietnam Thailand Singapore Dubai
          Fans Party Investment Sharing Session
          FastBull Summit BrokersView Expo

          U.S. Private Payrolls Increase By 4,750 On Average In 4 Weeks To November 22 - ADP

          Justin

          Economic

          Summary:

          U.S. private payrolls increased by 4,750 on average per week in the four weeks ending on November 22, according to a weekly update of the monthly ADP National Employment Report.

          U.S. private payrolls increased by 4,750 on average per week in the four weeks ending on November 22, according to a weekly update of the monthly ADP National Employment Report.

          The data comes after hiring in the American private sector notched its biggest drop in more than two and a half years in November.

          However, analysts cautioned against reading too much into the figures, arguing that the monthly estimate has recently diverged from a separate gauge of the U.S. employment market from the Labor Department's Bureau of Labor Statistics.

          The BLS is due to release its closely-monitored nonfarm payrolls report for November on December 16, after it was delayed by a record-long U.S. government shutdown. The October unemployment rate will also never be known, after having hovered around a four-year high of 4.4% in September.

          But the economy is still tipped to have shed jobs in October, as thousands of federal workers accepted buyout packages which would take them off government payrolls.

          Federal Reserve policymakers and investors alike have been forced to rely on alternative data sources because of the blackout of official data, intensifying the spotlight recently on some of these numbers.

          On Tuesday, the Fed is due to begin its latest two-day policy gathering. Markets are widely betting that the central bank, assessing a slowing labor market, resilient consumer spending and sticky inflation, will slash interest rates by 25 basis points at the end of the meeting.

          Source: Investing

          To stay updated on all economic events of today, please check out our Economic calendar
          Risk Warnings and Disclaimers
          You understand and acknowledge that there is a high degree of risk involved in trading. Following any strategies or investment methods may lead to potential losses. The content on the site is provided by our contributors and analysts for information purposes only. You are solely responsible for determining whether any trading assets, securities, strategy, or any other product is suitable for investing based on your own investment objectives and financial situation.
          Add to Favorites
          Share

          Silver (XAG) Forecast: Can Powell Extend The Silver Rally? Key Silver Outlook Explained

          Golden Gleam

          Commodity

          Technical Analysis

          Silver Firms as Traders Brace for the Fed

          Spot Silver is holding steady on Tuesday, ahead of the December 10 Fed decision, with the market essentially coiling for the next catalyst. Traders have priced in a near-certain 25-bp cut, and that expectation has kept a steady bid under precious metals. When the cost of holding non-yielding assets falls, silver tends to attract interest — and that pattern is showing up again.

          At 13:19 GMT, XAGUSD is trading $58.77, up $0.61 or +1.04%.

          ETF Inflows Keep Fueling the Upside

          One of the strongest supports for the market has been persistent ETF demand. Nearly 590 tonnes flowed into silver ETFs over the past week, while November added 15.7 million ounces — the heaviest monthly intake since July.

          That kind of buying isn't passive allocation; it's institutional money leaning into the trade. Sustained inflows across nine of the past eleven months tighten available supply and make short exposure harder to carry.

          Traders aren't chasing every uptick, but they're willing to buy weakness, and the flow backdrop explains why.

          Physical Tightness Remains a Core Theme

          Supply deficits now stretch into a fifth straight year. Exchange inventories sit at unusually low levels, and Shanghai warehouse stocks are at decade lows. China's decision to ship refined silver into London underscores how tight the physical market has become. Even if sentiment softens, the structural shortage acts like a cushion under prices and limits the depth of pullbacks.

          Dollar Softness Adds Another Tailwind

          The dollar index slipping under 100.000 recently has removed some pressure from metals, with dovish expectations for the Fed encouraging dollar sellers. It isn't the main driver this week, but it supports the broader bid for silver by making the metal more accessible to overseas buyers.

          Industrial Appetite Underwrites Medium-Term Strength

          Strong demand from solar manufacturing, electric vehicles, and broader green technologies continues to provide a sturdy foundation. Silver's dual role — investment asset and industrial input — gives traders confidence that the metal has meaningful demand behind it, even if investment flows pause.

          Short-Term Outlook: Powell Will Set the Tone

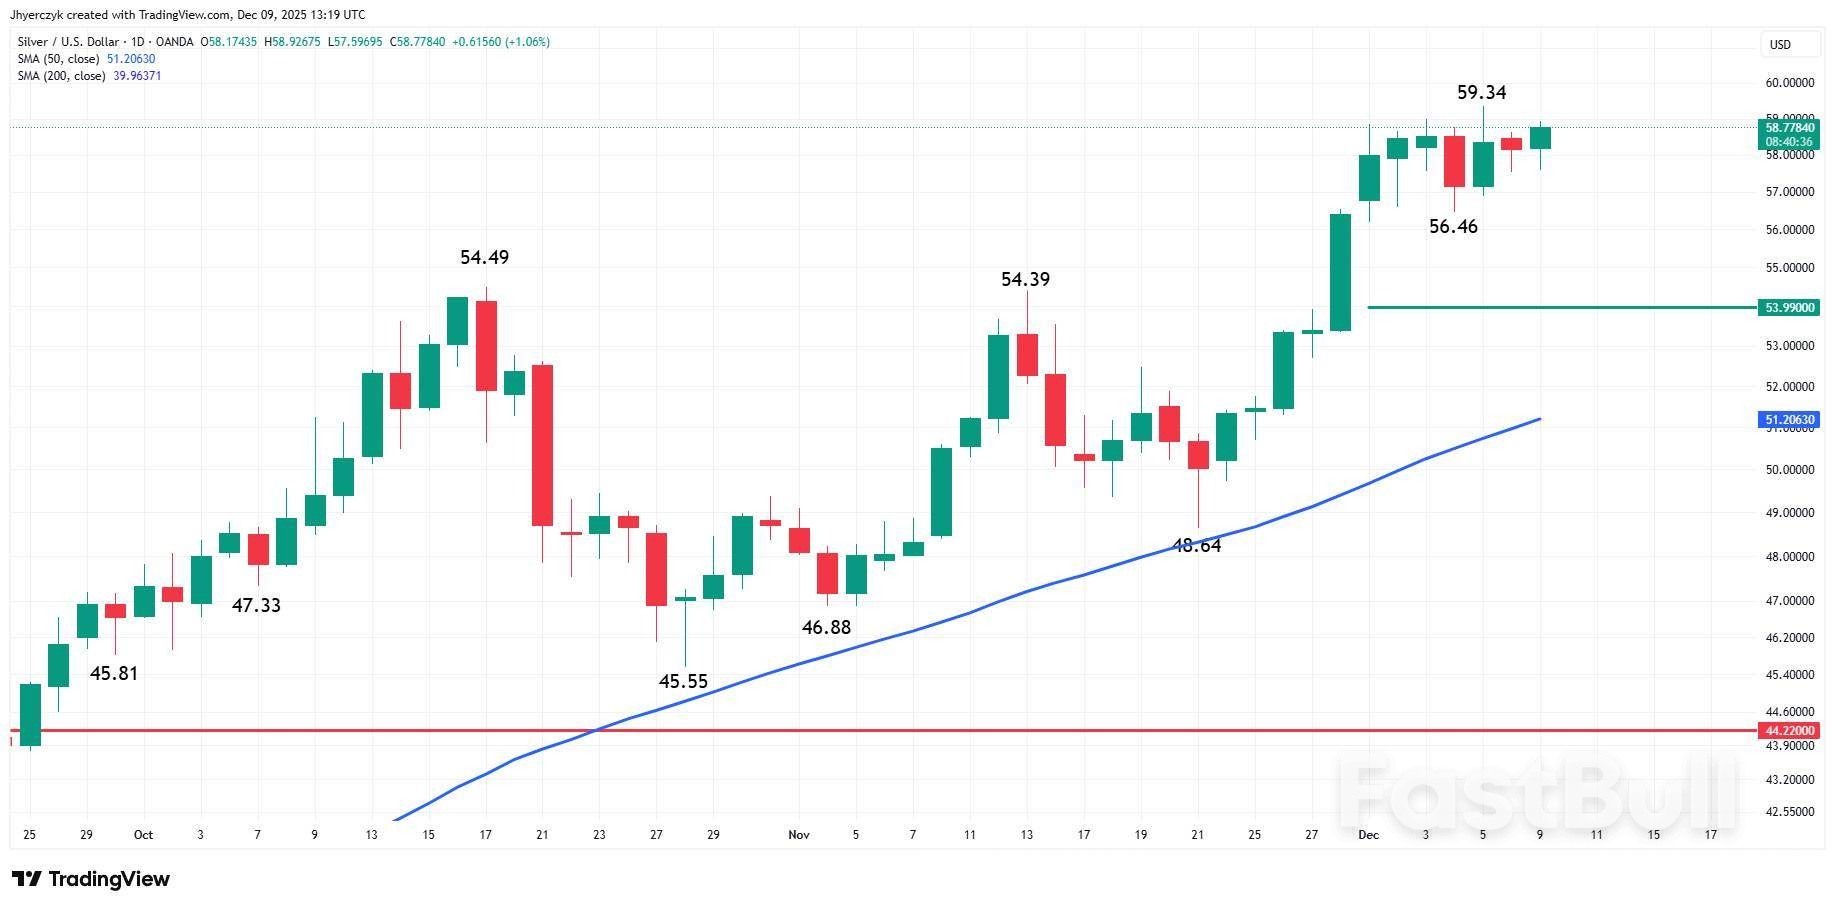
          Daily Silver (XAG/USD)

          The $56.46–$59.34 range reflects current trading behavior. The expected rate cut is largely baked in, so attention is locked on Chair Powell's guidance for 2026. A firmer stance on limiting further easing could trigger profit-taking toward support near $56.46. But a more accommodative message may encourage buyers to press through $59.34 and test the path toward $62, a level widely monitored by analysts.

          Bottom line: silver is leaning higher, but the follow-through depends on how far Powell opens — or closes — the door to additional cuts next year.

          Source: FX Empire

          Risk Warnings and Disclaimers
          You understand and acknowledge that there is a high degree of risk involved in trading. Following any strategies or investment methods may lead to potential losses. The content on the site is provided by our contributors and analysts for information purposes only. You are solely responsible for determining whether any trading assets, securities, strategy, or any other product is suitable for investing based on your own investment objectives and financial situation.
          Add to Favorites
          Share

          US stock market outlook for 2026: earnings and Fed support point higher

          Adam

          Stocks

          US stock market outlook 2026

          ​​​The case for US equities in 2026 rests on two pillars: earnings growth and a supportive Federal Reserve (Fed). Both look set to deliver, even if the path proves choppier than the straight-line gains seen in parts of 2024 and 2025.
          ​Corporate earnings have weathered the storm of higher rates and elevated costs remarkably well. Margins have held up, productivity gains are finally showing through, and revenue growth remains solid across most sectors. The pessimism that dominated much of 2022 and 2023 has proven misplaced, with companies demonstrating pricing power and operational efficiency that exceeded expectations.
          ​The AI investment boom is beginning to translate into tangible benefits. While sceptics focus on the massive capital expenditure, the productivity gains are becoming visible in corporate results. This supports both margin expansion and top-line growth, providing a foundation for continued earnings momentum through 2026.
          ​The Fed, meanwhile, has room to ease policy without reigniting inflation concerns. Disinflation is sufficiently entrenched that rate cuts can proceed at a measured pace, providing a tailwind for risk assets without requiring an economic crisis to justify them. This "goldilocks" scenario of growth with easing financial conditions is exactly what equity markets need.
          ​Valuation concerns are overblown. Yes, the market isn't cheap, but it rarely is at the start of sustained bull runs. Elevated multiples reflect strong fundamentals and improving earnings visibility, not irrational exuberance. The concentration in mega-cap tech simply reflects where the growth is, and there's no reason to expect this leadership to falter when these companies continue to deliver.
          ​Mid-term election years bring volatility, but the overall trajectory remains upward. Historical weakness in these periods tends to create buying opportunities rather than signalling sustained declines. With corporate balance sheets strong, buyback activity robust, and liquidity conditions improving, the path of least resistance is higher.
          ​Pullbacks will happen, as they always do. But the fundamental backdrop of earnings growth, Fed support and solid corporate fundamentals argues for buying dips rather than fighting the trend. The bull market has further to run.

          ​Technical analysis

          ​Dow Jones
          ​While 50,000 eluded the Dow Jones index in 2025, it staged an impressive recovery from the tariff panic of April. After dropping below the 200-day simple moving average (SMA) in March, and then falling to below 37,000, the index recovered its losses and then moved higher, and by mid-August it was at a new record high.
          ​For the moment, the progression of new highs and higher lows confirms the solid technical outlook to match the strong earnings and macroeconomic picture.
          Dow Jones candlestick chart
          US stock market outlook for 2026: earnings and Fed support point higher_1

          S&P 500

          ​It is a similar picture for this index, and the S&P 500's bigger weighting to the tech sector meant that the recovery has been even stronger. The rally since April has been remarkably quiet, with only the November pullback really threatening to disrupt the broader uptrend.
          ​S&P 500 candlestick chart
          US stock market outlook for 2026: earnings and Fed support point higher_2
          A note on volatility
          ​Apart from March-May, the year has been quite a quiet one overall. Investors and traders alike need to be prepared for the possibility that this will not be the case next year. It is now around eight months since the 20% drop in April, which means we may be closer to the next drop than to the one last April. The ‘average’ year sees at least one fall of 14% for the S&P 500, and a similar one for the Dow.
          ​The quiet period of the last eight months will not last for ever, and it is important to be aware that volatility can return at some point in the new year.

          Source:ig

          Risk Warnings and Disclaimers
          You understand and acknowledge that there is a high degree of risk involved in trading. Following any strategies or investment methods may lead to potential losses. The content on the site is provided by our contributors and analysts for information purposes only. You are solely responsible for determining whether any trading assets, securities, strategy, or any other product is suitable for investing based on your own investment objectives and financial situation.
          Add to Favorites
          Share

          US 500 Forecast: The Index Is Once Again Heading Towards A New All-time High

          Glendon

          Stocks

          Technical Analysis

          The US 500 may enter a correction, but the medium-term uptrend remains intact. The US 500 forecast for today is negative.

          US 500 forecast: key trading points

          • Recent data: the US core PCE came in at 2.8% year-on-year
          • Market impact: these figures are generally positive for the stock market

          US 500 fundamental analysis

          The published core PCE figure came in at 2.8% year-on-year, below the forecast of 2.9% and the previous reading of 2.9%. For the market, this is an important signal, as the core PCE remains the Federal Reserve's key inflation gauge. The decline shows that inflationary pressure continues to ease, reducing the need for the Fed to maintain a tight monetary stance and increasing the likelihood of a more dovish rate path in the coming months.

          For the US 500, such data is a moderately positive factor. The market reaction is likely to tilt upwards, as expectations of further easing in inflation reduce uncertainty around the Fed's decisions. However, the rise is unlikely to be sharp: the figure declined by only 0.1 percentage point, and inflation is already close to the range the Fed considers sustainable.

          US 500 technical analysis

          The US 500 index has formed a resistance level at 6,895.0 and a support level at 6,790.0. The uptrend is slowing as the index approaches a new all-time high, with a short-term correction likely. If the price fails to break below the support level, the uptrend will remain intact, with a potential upside target around 6,985.0.

          The US 500 price forecast considers the following scenarios:

          • Pessimistic US 500 forecast: a breakout below the 6,790.0 support level could send the index down to 6,710.0
          • Optimistic US 500 forecast: a breakout above the 6,895.0 resistance level could drive the index up to 6,985.0

          US 500 technical analysis for 9 December 2025

          Summary

          The core PCE price index declined to 2.8%, below the forecast and the previous reading, indicating easing inflation and reduced pressure on the Federal Reserve. The US stock market receives a moderately positive signal: bond yields may fall, and interest in risk assets may increase. For the US 500 index, this creates conditions for further growth, although the reaction may be restrained. A short-term correction within the broader uptrend also cannot be ruled out. From a technical perspective, the US 500 could rise towards 6,950.0.

          Source: RoboForex

          Risk Warnings and Disclaimers
          You understand and acknowledge that there is a high degree of risk involved in trading. Following any strategies or investment methods may lead to potential losses. The content on the site is provided by our contributors and analysts for information purposes only. You are solely responsible for determining whether any trading assets, securities, strategy, or any other product is suitable for investing based on your own investment objectives and financial situation.
          Add to Favorites
          Share

          DAX 40 market outlook 2026

          Adam

          Stocks

          Three pillars support 2026 case

          ​The 2026 performance of the German stock market, and the DAX 40 in particular, will depend on earnings resilience among Germany's global industrial champions, interest rates remaining low in the eurozone and demand for exports remaining stable despite US tariffs.
          ​These factors, alongside a possible Russia/Ukraine peace accord, are set to play a positive role, even if the path forward is likely to be more uneven than the powerful bull market seen between October 2022 and March 2025, when the DAX pushed decisively higher in what looked like a straight line.
          ​Even with the Trump-induced trade war and sharp April sell-off, the DAX 40 outperformed several major European and US peers for much of the year.
          ​Corporate earnings among Germany's largest listed firms have remained more resilient than many had expected, despite a challenging macro backdrop marked by weak domestic demand, sluggish manufacturing activity, and US tariffs.

          ​Cost discipline preserves profitability

          ​Germany's export-oriented business model has faced headwinds in recent years, yet many DAX constituents - particularly in autos, chemicals, defence, industrials and technology hardware - have managed to protect profitability.
          ​Through aggressive cost discipline, restructuring efforts, and tighter capital allocation, these companies have maintained margins.
          ​Margins have held up surprisingly well. In several sectors, earnings have grown faster than revenues, signalling that firms have been able to preserve pricing power or offset softer sales through productivity gains and operational efficiency improvements.

          ​Sideways trading reflects mixed performance

          ​Chemicals, cyclical manufacturers exposed to China – and its lacklustre growth – utilities and real estate (though not heavily represented in the DAX 40) weighed on the German stock index's performance.
          ​This and the unwinding of trades where ‘overvalued’ US AI and technology plays were sold in favour of stock purchases in Europe's largest economy – such as at the beginning of the year - explain why the DAX 40 has been trading sideways since June of 2025.
          ​At the same time the German blue chip index’s peers have been catching up - and in the case of the Nasdaq 100 – started to outperform the DAX 40 towards the latter part of 2025.
          ​DAX 40 versus global peers year-to-date performance chart
          DAX 40 market outlook 2026_1
          US tariff-induced lower demand for German goods and services as well as unfavourable currency dynamics - particularly with the euro appreciating by around 15% in the first half of the year – means that exporters with a high share of US dollar (USD)-denominated sales no longer have a natural earnings tailwind.

          ​AI adoption supports operational efficiency

          ​Meanwhile, the diffusion of AI-driven automation and digitalisation is gradually filtering into core German industries, providing incremental support.
          ​While Germany is not viewed as a pure technology powerhouse, many DAX names - from industrial automation specialists to advanced manufacturers - are beginning to realise meaningful efficiency gains. These incremental improvements support margins and help cushion the cyclical downturn that has characterised much of 2023-2024.
          ​The adoption of automation and digital technologies represents a structural shift that could provide sustained competitive advantages.

          ​ECB easing provides supportive backdrop

          ​On the policy front, the European Central Bank (ECB) might at present be reticent - but has scope - to ease further in 2026 without jeopardising its disinflation progress.
          ​Eurozone inflation, which fluctuated between 1.9% and 2.5% during 2025, hovered around its 2% central bank target rate during the second half of the year.
          ​With inflation expectations anchored and growth still subdued across the bloc, policymakers have room to continue cutting rates gradually.
          ​A gently easing policy mix provides a constructive foundation for equities - particularly for interest-rate-sensitive sectors such as real estate, financials, and domestically leveraged companies that suffered disproportionately during the tightening cycle.

          ​Valuation discount presents opportunity

          ​Concerns over valuation should not be exaggerated. The DAX 40 trades at a price to earnings ratio (P/E) of around 17, placing it well below US benchmarks such as the S&P 500 (near 25×).
          ​This gap has persisted despite improving earnings visibility, reflecting Germany's cyclical sector composition - heavy in autos, industrials and financials, sectors that traditionally trade on lower multiples - rather than structural weakness.
          ​Yet these industries continue to generate robust cash flows, relatively high dividends, and maintain solid balance sheets.
          ​The concentration of returns in autos, industrial technology, and chemicals simply reflects where Germany's durable earnings power lies.

          ​Improved conditions support higher path

          ​With fiscal uncertainty around Germany's budget largely resolved for now, and with corporate buybacks increasing in frequency among DAX constituents, liquidity conditions have improved.
          ​The path of least resistance for the DAX in 2026 thus remains higher, supported by both fundamental and technical factors.
          ​Pullbacks will, of course, occur. But the combination of steady earnings, improving policy conditions, and strong corporate fundamentals argues in favour of treating weakness as opportunity.
          ​The bull cycle that began in late 2022 still appears to have room to run despite the sideways consolidation seen since June.

          ​Volatility expected to return

          ​The unusually steady uptrend seen in the DAX 40 since its 7,545 April low will not persist indefinitely. Volatility will return at some stage in the new year.
          ​Market participants should remain prepared for sharper moves - both down and up - as the DAX 40 once more tries to breach psychological resistance levels.
          ​The 2026 journey is likely to be choppier than recent experience, requiring active management and appropriate risk controls.
          ​Nevertheless, the fundamental case for German equities remains intact supported by multiple positive factors.

          ​Technical analysis of the DAX 40

          ​The DAX 40 – up around 19% year-to-date – remains in a medium-term sideways trading range. While its November low at 22,963 underpins, the long-term uptrend is deemed to stay intact.
          ​DAX 40 weekly candlestick chart
          DAX 40 market outlook 2026_2
          A rise above the November peak at 24,569 would likely lead to record highs being made around the 25,000 mark.
          ​Further up lies the 161.8% Fibonacci extension target of the 2020-to-2021 bull market, projected higher from the October 2022 low, at 26,318. It represents another 10% advance from current levels.
          ​DAX 40 monthly candlestick chart
          DAX 40 market outlook 2026_3

          Source: ig

          Risk Warnings and Disclaimers
          You understand and acknowledge that there is a high degree of risk involved in trading. Following any strategies or investment methods may lead to potential losses. The content on the site is provided by our contributors and analysts for information purposes only. You are solely responsible for determining whether any trading assets, securities, strategy, or any other product is suitable for investing based on your own investment objectives and financial situation.
          Add to Favorites
          Share

          Euro's Hidden Strength Could Muddy The ECB's 'good Place'

          Justin

          Forex

          Economic

          Euro banknotes are seen in this illustration taken July 17, 2022. REUTERS/Dado Ruvic/Illustration

          The strength of the euro is amplifying the deflationary effect of China's export machine, which may end up being the catalyst that could jolt the European Central Bank out of its "good place" and into more interest rate cuts.

          The euro is around $1.166, having hit a four-year high of $1.1918 in September and set for a gain of nearly 13% this year, the most since 2017.

          EURO MORE EXPENSIVE THAN MEETS THE EYE

          The ECB's euro real effective exchange rate - essentially the basket of key trading partner currencies adjusted for inflation - hit a high of 98.68 in September, the most since May 2014. It was at 97.81 in November .

          The real effective euro is at its highest levels in over a decade

          The nominal rate , which is around 129.96, hit a record 130.87 in September, having risen 5.7% so far in 2025.

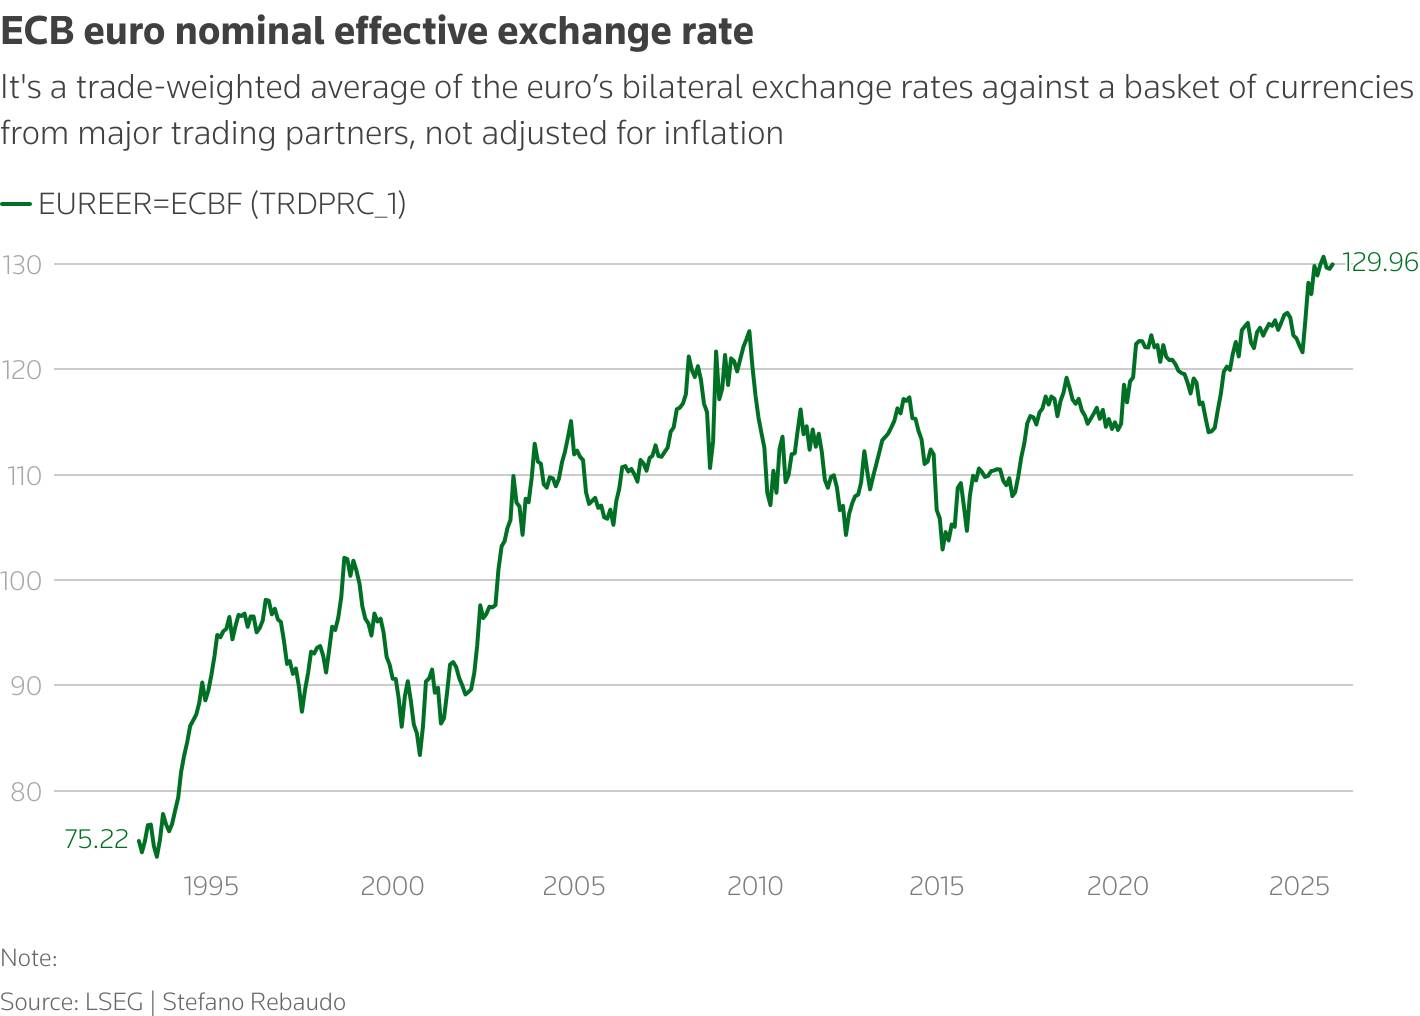
          The euro nominal effective exchange rate is close to its highest on record

          "The euro is a lot more expensive than meets the eye," said Themos Fiotakis, Barclays global head of forex strategy.

          "If you look at the euro on a trade-weighted basis, and also against some of its more direct competitors, you'll see that the euro is at historically high levels," he argued, adding that factoring in U.S. tariffs offers a euro rate closer to $1.28.

          One of the main drivers of the rise in the trade-weighted euro has been the 7% drop in the Chinese yuan in the offshore market this year .

          China is Europe's largest trading partner. The most recent data show the euro zone had a trade deficit of 33 billion euros with China in September, compared with a 22.2-billion euro surplus with the United States, the region's second-largest partner.

          ONE OR TWO RATE CUTS STILL POSSIBLE

          Goldman Sachs recently delivered its biggest upgrade to China's growth outlook in a decade, saying Beijing's push to flood markets with cheap goods could stoke deflation, particularly in Europe.

          Chinese exporters will be looking to expand their footprint in markets other than the United States and, given the country's grip on supply of critical rare earth materials, there may be little room for trade barriers.

          ECB Vice President Luis de Guindos said in July the central bank can ignore an appreciation of the euro up to $1.20, but it would get "much more complicated" above that level.

          "We're seeing only limited pass-through from the exchange rate so far, as margins are still being rebuilt—and that process may not be complete yet," said Simon Wells, chief European economist at HSBC.

          "If the trade-weighted euro were to appreciate sharply from here, say by around 5%, that could well trigger further policy easing," he added, noting that in this case there would likely be more than one cut.

          ECB official Martin Kocher said in September the exchange rate wasn't a risk, but further euro appreciation could "become problematic" for exporters, while Martins Kazaks recently said the exchange rate and Chinese trade flows were key risks to the central bank's policy outlook.

          "What I'm telling clients is that our base case remains that rates will be unchanged, but the likelihood that the ECB will cut one or two more times between now and the summer of next year is still pretty high," said Carsten Brzeski, global head of macro research and chief euro zone economist at ING.

          "The China story could be the tipping factor to push the ECB into rate cuts."

          BETS ON ECB RATES SENSITIVE TO TRADE TENSIONS

          Markets show traders expect the ECB to be firmly on hold until at least March 2027. But tariffs and fears of a global trade war have seen that pricing come back from a low in April of 1.55%, when Trump slapped tariffs on all major trading partners.

          The 5-year Euro Short-Term Rate (ESTR) index swap is a derivative contract where one party pays a fixed rate and receives the floating ESTR over five years and it's seen as a market gauge of the medium-term monetary policy outlook

          Strategists say the outlook for the euro will remain dominated by the difference between euro zone and U.S. interest rates. The Federal Reserve is widely expected to deliver a series of cuts next year that could weigh on the dollar and, in turn, boost the euro.

          "Lower rates and a weaker dollar go hand in hand," said Andreas Koenig, head of global currency management at Amundi Asset Management, arguing that Trump will influence the Fed toward more easing ahead of mid-term elections.

          "I think that the first sequence is a lower dollar, then an accelerating (U.S.) economy."

          Source: Reuters

          To stay updated on all economic events of today, please check out our Economic calendar
          Risk Warnings and Disclaimers
          You understand and acknowledge that there is a high degree of risk involved in trading. Following any strategies or investment methods may lead to potential losses. The content on the site is provided by our contributors and analysts for information purposes only. You are solely responsible for determining whether any trading assets, securities, strategy, or any other product is suitable for investing based on your own investment objectives and financial situation.
          Add to Favorites
          Share

          US money market funds see large inflows ahead of Fed decision

          Adam

          Economic

          U.S. investors poured large sums into money market funds while pulling back ​from riskier equity funds in the week ‌to December 3, taking a cautious stance ahead of the Federal ‌Reserve's policy decision on Wednesday.
          They accumulated approximately $104.75 billion worth of U.S. money market funds, registering their largest weekly net purchase since November 5, LSEG Lipper data ⁠showed.
          Despite expectations of ‌a rate cut, investors remained wary, with stretched valuations in mega-cap technology stocks reinforcing ‍the shift toward safer assets.
          They ditched U.S. equity funds amounting to a net $3.52 billion, in a second successive week ​of net selling.
          Mid-cap funds witnessed a seventh straight ‌weekly net outflow, valued at $494.92 million. Small- and large-cap funds also experienced net disposals of $1.18 billion and $476 million, respectively.
          Sectoral equity funds, however, stayed popular for a second week as these funds drew approximately $510 million ⁠worth of net inflows.
          Industrials, and ​gold and precious metals equity ​funds saw inflows of $510 million and $293 million, respectively.
          U.S. bond funds, meanwhile, attracted just $314 million, ‍the smallest amount ⁠for a week since October 1.
          Short-to-intermediate investment-grade funds and municipal debt funds secured inflows of $1.45 ⁠billion and $737 million, respectively, while short-to-intermediate government and treasury funds ‌had a weekly outflow of $1.58 billion.

          Source: Reuters

          To stay updated on all economic events of today, please check out our Economic calendar
          Risk Warnings and Disclaimers
          You understand and acknowledge that there is a high degree of risk involved in trading. Following any strategies or investment methods may lead to potential losses. The content on the site is provided by our contributors and analysts for information purposes only. You are solely responsible for determining whether any trading assets, securities, strategy, or any other product is suitable for investing based on your own investment objectives and financial situation.
          Add to Favorites
          Share
          FastBull
          Copyright © 2025 FastBull Ltd

          728 RM B 7/F GEE LOK IND BLDG NO 34 HUNG TO RD KWUN TONG KLN HONG KONG

          TelegramInstagramTwitterfacebooklinkedin
          App Store Google Play Google Play
          Products
          Charts

          Chats

          Q&A with Experts
          Screeners
          Economic Calendar
          Data
          Tools
          Membership
          Features
          Function
          Markets
          Copy Trading
          Latest Signals
          Contests
          News
          Analysis
          24/7
          Columns
          Education
          Company
          Careers
          About Us
          Contact Us
          Advertising
          Help Center
          Feedback
          User Agreement
          Privacy Policy
          Business

          White Label

          Data API

          Web Plug-ins

          Poster Maker

          Affiliate Program

          Risk Disclosure

          The risk of loss in trading financial instruments such as stocks, FX, commodities, futures, bonds, ETFs and crypto can be substantial. You may sustain a total loss of the funds that you deposit with your broker. Therefore, you should carefully consider whether such trading is suitable for you in light of your circumstances and financial resources.

          No decision to invest should be made without thoroughly conducting due diligence by yourself or consulting with your financial advisors. Our web content might not suit you since we don't know your financial conditions and investment needs. Our financial information might have latency or contain inaccuracy, so you should be fully responsible for any of your trading and investment decisions. The company will not be responsible for your capital loss.

          Without getting permission from the website, you are not allowed to copy the website's graphics, texts, or trademarks. Intellectual property rights in the content or data incorporated into this website belong to its providers and exchange merchants.

          Not Logged In

          Log in to access more features

          FastBull Membership

          Not yet

          Purchase

          Become a signal provider
          Help Center
          Customer Service
          Dark Mode
          Price Up/Down Colors

          Log In

          Sign Up

          Position
          Layout
          Fullscreen
          Default to Chart
          The chart page opens by default when you visit fastbull.com