• Trade
  • Markets
  • Copy
  • Contests
  • News
  • 24/7
  • Calendar
  • Q&A
  • Chats
Trending
Screeners
SYMBOL
LAST
BID
ASK
HIGH
LOW
NET CHG.
%CHG.
SPREAD
SPX
S&P 500 Index
6827.42
6827.42
6827.42
6899.86
6801.80
-73.58
-1.07%
--
DJI
Dow Jones Industrial Average
48458.04
48458.04
48458.04
48886.86
48334.10
-245.98
-0.51%
--
IXIC
NASDAQ Composite Index
23195.16
23195.16
23195.16
23554.89
23094.51
-398.69
-1.69%
--
USDX
US Dollar Index
97.950
98.030
97.950
98.500
97.950
-0.370
-0.38%
--
EURUSD
Euro / US Dollar
1.17394
1.17409
1.17394
1.17496
1.17192
+0.00011
+ 0.01%
--
GBPUSD
Pound Sterling / US Dollar
1.33707
1.33732
1.33707
1.33997
1.33419
-0.00148
-0.11%
--
XAUUSD
Gold / US Dollar
4299.39
4299.39
4299.39
4353.41
4257.10
+20.10
+ 0.47%
--
WTI
Light Sweet Crude Oil
57.233
57.485
57.233
58.011
56.969
-0.408
-0.71%
--

Community Accounts

Signal Accounts
--
Profit Accounts
--
Loss Accounts
--
View More

Become a signal provider

Sell trading signals to earn additional income

View More

Guide to Copy Trading

Get started with ease and confidence

View More

Signal Accounts for Members

All Signal Accounts

Best Return
  • Best Return
  • Best P/L
  • Best MDD
Past 1W
  • Past 1W
  • Past 1M
  • Past 1Y

All Contests

  • All
  • Trump Updates
  • Recommend
  • Stocks
  • Cryptocurrencies
  • Central Banks
  • Featured News
Top News Only
Share

Pentagon Says Two USA Army Soldiers And One Civilian USA Interpreter Were Killed, And Three Were Wounded In Syria

Share

Israel Says It Kills Senior Hamas Commander Raed Saed In Gaza

Share

Ukraine's Navy Says Russian Drone Attack Hit Civilian Turkish Vessel Carrying Sunflower Oil To Egypt On Saturday

Share

Israeli Military Says It Put Planned Strike On South Lebanon Site On Hold After Lebanese Army Requested Access

Share

Norwegian Nobel Committee: Calls On The Belarusian Authorities To Release All Political Prisoners

Share

Norwegian Nobel Committee: His Freedom Is A Deeply Welcome And Long-Awaited Moment

Share

Ukraine Says It Received 114 Prisoners From Belarus

Share

USA Embassy In Lithuania: Maria Kalesnikava Is Not Going To Vilnius

Share

USA Embassy In Lithuania: Other Prisoners Are Being Sent From Belarus To Ukraine

Share

Ukraine President Zelenskiy: Five Ukrainians Released By Belarus In US-Brokered Deal

Share

USA Vilnius Embassy: USA Stands Ready For "Additional Engagement With Belarus That Advances USA Interests"

Share

USA Vilnius Embassy: Belarus, USA, Other Citizens Among The Prisoners Released Into Lithuania

Share

USA Vilnius Embassy: USA Will Continue Diplomatic Efforts To Free The Remaining Political Prisoners In Belarus

Share

USA Vilnius Embassy: Belarus Releases 123 Prisoners Following Meeting Of President Trump's Envoy Coale And Belarus President Lukashenko

Share

USA Vilnius Embassy: Masatoshi Nakanishi, Aliaksandr Syrytsa Are Among The Prisoners Released By Belarus

Share

USA Vilnius Embassy: Maria Kalesnikava And Viktor Babaryka Are Among The Prisoners Released By Belarus

Share

USA Vilnius Embassy: Nobel Peace Prize Laureate Ales Bialiatski Is Among The Prisoners Released By Belarus

Share

Belarusian Presidential Administration Telegram Channel: Lukashenko Has Pardoned 123 Prisoners As Part Of Deal With US

Share

Two Local Syrian Officials: Joint US-Syrian Military Patrol In Central Syria Came Under Fire From Unknown Assailants

Share

Israeli Military Says It Targeted 'Key Hamas Terrorist' In Gaza City

TIME
ACT
FCST
PREV
U.K. Trade Balance Non-EU (SA) (Oct)

A:--

F: --

P: --

U.K. Trade Balance (Oct)

A:--

F: --

P: --

U.K. Services Index MoM

A:--

F: --

P: --

U.K. Construction Output MoM (SA) (Oct)

A:--

F: --

P: --

U.K. Industrial Output YoY (Oct)

A:--

F: --

P: --

U.K. Trade Balance (SA) (Oct)

A:--

F: --

P: --

U.K. Trade Balance EU (SA) (Oct)

A:--

F: --

P: --

U.K. Manufacturing Output YoY (Oct)

A:--

F: --

P: --

U.K. GDP MoM (Oct)

A:--

F: --

P: --

U.K. GDP YoY (SA) (Oct)

A:--

F: --

P: --

U.K. Industrial Output MoM (Oct)

A:--

F: --

P: --

U.K. Construction Output YoY (Oct)

A:--

F: --

P: --

France HICP Final MoM (Nov)

A:--

F: --

P: --

China, Mainland Outstanding Loans Growth YoY (Nov)

A:--

F: --

P: --

China, Mainland M2 Money Supply YoY (Nov)

A:--

F: --

P: --

China, Mainland M0 Money Supply YoY (Nov)

A:--

F: --

P: --

China, Mainland M1 Money Supply YoY (Nov)

A:--

F: --

P: --

India CPI YoY (Nov)

A:--

F: --

P: --

India Deposit Gowth YoY

A:--

F: --

P: --

Brazil Services Growth YoY (Oct)

A:--

F: --

P: --

Mexico Industrial Output YoY (Oct)

A:--

F: --

P: --

Russia Trade Balance (Oct)

A:--

F: --

P: --

Philadelphia Fed President Henry Paulson delivers a speech
Canada Building Permits MoM (SA) (Oct)

A:--

F: --

P: --

Canada Wholesale Sales YoY (Oct)

A:--

F: --

P: --

Canada Wholesale Inventory MoM (Oct)

A:--

F: --

P: --

Canada Wholesale Inventory YoY (Oct)

A:--

F: --

P: --

Canada Wholesale Sales MoM (SA) (Oct)

A:--

F: --

P: --

Germany Current Account (Not SA) (Oct)

A:--

F: --

P: --

U.S. Weekly Total Rig Count

A:--

F: --

P: --

U.S. Weekly Total Oil Rig Count

A:--

F: --

P: --

Japan Tankan Large Non-Manufacturing Diffusion Index (Q4)

--

F: --

P: --

Japan Tankan Small Manufacturing Outlook Index (Q4)

--

F: --

P: --

Japan Tankan Large Non-Manufacturing Outlook Index (Q4)

--

F: --

P: --

Japan Tankan Large Manufacturing Outlook Index (Q4)

--

F: --

P: --

Japan Tankan Small Manufacturing Diffusion Index (Q4)

--

F: --

P: --

Japan Tankan Large Manufacturing Diffusion Index (Q4)

--

F: --

P: --

Japan Tankan Large-Enterprise Capital Expenditure YoY (Q4)

--

F: --

P: --

U.K. Rightmove House Price Index YoY (Dec)

--

F: --

P: --

China, Mainland Industrial Output YoY (YTD) (Nov)

--

F: --

P: --

China, Mainland Urban Area Unemployment Rate (Nov)

--

F: --

P: --

Saudi Arabia CPI YoY (Nov)

--

F: --

P: --

Euro Zone Industrial Output YoY (Oct)

--

F: --

P: --

Euro Zone Industrial Output MoM (Oct)

--

F: --

P: --

Canada Existing Home Sales MoM (Nov)

--

F: --

P: --

Euro Zone Total Reserve Assets (Nov)

--

F: --

P: --

U.K. Inflation Rate Expectations

--

F: --

P: --

Canada National Economic Confidence Index

--

F: --

P: --

Canada New Housing Starts (Nov)

--

F: --

P: --

U.S. NY Fed Manufacturing Employment Index (Dec)

--

F: --

P: --

U.S. NY Fed Manufacturing Index (Dec)

--

F: --

P: --

Canada Core CPI YoY (Nov)

--

F: --

P: --

Canada Manufacturing Unfilled Orders MoM (Oct)

--

F: --

P: --

Canada Manufacturing New Orders MoM (Oct)

--

F: --

P: --

Canada Core CPI MoM (Nov)

--

F: --

P: --

Canada Manufacturing Inventory MoM (Oct)

--

F: --

P: --

Canada CPI YoY (Nov)

--

F: --

P: --

Canada CPI MoM (Nov)

--

F: --

P: --

Canada CPI YoY (SA) (Nov)

--

F: --

P: --

Canada Core CPI MoM (SA) (Nov)

--

F: --

P: --

Q&A with Experts
    • All
    • Chatrooms
    • Groups
    • Friends
    Connecting
    .
    .
    .
    Type here...
    Add Symbol or Code

      No matching data

      All
      Trump Updates
      Recommend
      Stocks
      Cryptocurrencies
      Central Banks
      Featured News
      • All
      • Russia-Ukraine Conflict
      • Middle East Flashpoint
      • All
      • Russia-Ukraine Conflict
      • Middle East Flashpoint
      Search
      Products

      Charts Free Forever

      Chats Q&A with Experts
      Screeners Economic Calendar Data Tools
      Membership Features
      Data Warehouse Market Trends Institutional Data Policy Rates Macro

      Market Trends

      Market Sentiment Order Book Forex Correlations

      Top Indicators

      Charts Free Forever
      Markets

      News

      News Analysis 24/7 Columns Education
      From Institutions From Analysts
      Topics Columnists

      Latest Views

      Latest Views

      Trending Topics

      Top Columnists

      Latest Update

      Signals

      Copy Rankings Latest Signals Become a signal provider AI Rating
      Contests
      Brokers

      Overview Brokers Assessment Rankings Regulators News Claims
      Broker listing Forex Brokers Comparison Tool Live Spread Comparison Scam
      Q&A Complaint Scam Alert Videos Tips to Detect Scam
      More

      Business
      Events
      Careers About Us Advertising Help Center

      White Label

      Data API

      Web Plug-ins

      Affiliate Program

      Awards Institution Evaluation IB Seminar Salon Event Exhibition
      Vietnam Thailand Singapore Dubai
      Fans Party Investment Sharing Session
      FastBull Summit BrokersView Expo
      Recent Searches
        Top Searches
          Markets
          News
          Analysis
          User
          24/7
          Economic Calendar
          Education
          Data
          • Names
          • Latest
          • Prev

          View All

          No data

          Scan to Download

          Faster Charts, Chat Faster!

          Download App
          English
          • English
          • Español
          • العربية
          • Bahasa Indonesia
          • Bahasa Melayu
          • Tiếng Việt
          • ภาษาไทย
          • Français
          • Italiano
          • Türkçe
          • Русский язык
          • 简中
          • 繁中
          Open Account
          Search
          Products
          Charts Free Forever
          Markets
          News
          Signals

          Copy Rankings Latest Signals Become a signal provider AI Rating
          Contests
          Brokers

          Overview Brokers Assessment Rankings Regulators News Claims
          Broker listing Forex Brokers Comparison Tool Live Spread Comparison Scam
          Q&A Complaint Scam Alert Videos Tips to Detect Scam
          More

          Business
          Events
          Careers About Us Advertising Help Center

          White Label

          Data API

          Web Plug-ins

          Affiliate Program

          Awards Institution Evaluation IB Seminar Salon Event Exhibition
          Vietnam Thailand Singapore Dubai
          Fans Party Investment Sharing Session
          FastBull Summit BrokersView Expo

          U.S. Dollar Retreats At The Start Of The Week: Analysis For EUR/USD, GBP/USD, USD/CAD, USD/JPY

          Adam

          Forex

          Summary:

          The U.S. Dollar Index fell after weak Dallas Fed data, boosting EUR/USD and GBP/USD. USD/CAD stayed range-bound, while USD/JPY dropped as Treasury yields declined, signaling potential further weakness ahead.

          U.S. Dollar Index Declines As Dallas Fed Manufacturing Index Misses Estimates

          U.S. Dollar Retreats At The Start Of The Week: Analysis For EUR/USD, GBP/USD, USD/CAD, USD/JPY_1DXY 280425 4h Chart

          U.S. Dollar Index pulls back as traders react to Dallas Fed Manufacturing Index report. The report showed that Dallas Fed Manufacturing Index decreased from -16.3 in March to -35.8 in April, compared to analyst forecast of -15.
          The nearest support level for U.S. Dollar Index is located in the 98.80 – 99.00 range. A move below the 98.80 level will push U.S. Dollar Index towards the next support at 97.50 – 97.70.

          EUR/USD Attempts To Settle Above 1.1400

          U.S. Dollar Retreats At The Start Of The Week: Analysis For EUR/USD, GBP/USD, USD/CAD, USD/JPY_2EUR/USD 280425 4h Chart

          EUR/USD gains ground as traders bet that U.S. – China trade war will put material pressure on the American currency.
          In case EUR/USD settles above the 1.1400 level, it will head towards the nearest resistance, which is located in the 1.1450 – 1.1470 range.

          GBP/USD Tests Resistance At 1.3400 – 1.3420

          U.S. Dollar Retreats At The Start Of The Week: Analysis For EUR/USD, GBP/USD, USD/CAD, USD/JPY_3GBP/USD 280425 4h Chart

          GBP/USD tests resistance at 1.3400 – 1.3420 as traders focus on general weakness of the American currency.
          If GBP/USD manages to settle above the 1.3420 level, it will move towards the next resistance at 1.3485 – 1.3500.

          USD/CAD Stays Range-Bound

          U.S. Dollar Retreats At The Start Of The Week: Analysis For EUR/USD, GBP/USD, USD/CAD, USD/JPY_4USD/CAD 280425 4h Chart

          USD/CAD is mostly flat despite the pullback in the oil markets. Other commodity-related currencies are moving higher in today’s trading session.
          If USD/CAD settles above the 1.3900 level, it will get to the test of the resistance at 1.3930 – 1.3950. A move above 1.3950 will push USD/CAD towards the resistance at 1.4030 – 1.4050.

          USD/JPY Pulls Back As Treasury Yields Fall

          U.S. Dollar Retreats At The Start Of The Week: Analysis For EUR/USD, GBP/USD, USD/CAD, USD/JPY_5USD/JPY 280425 4h Chart

          USD/JPY pulls back as traders focus on falling Treasury yields. The yield of 2-year Treasuries pulled back towards 3.70%, while the yield of 10-year Treasuries settled near the 4.24% level.
          In case USD/JPY settles below 142.50, it will get to the test of the nearest support at 141.50 – 142.00. RSI is in the moderate territory, and there is plenty of room to gain additional downside momentum in the near term.

          Source: fxempire

          Risk Warnings and Disclaimers
          You understand and acknowledge that there is a high degree of risk involved in trading. Following any strategies or investment methods may lead to potential losses. The content on the site is provided by our contributors and analysts for information purposes only. You are solely responsible for determining whether any trading assets, securities, strategy, or any other product is suitable for investing based on your own investment objectives and financial situation.
          Add to Favorites
          Share

          Polymarket Bets On Mark Carney Win As Canadians Head To The Polls

          Catherine Richards

          Cryptocurrency

          Political

          Crypto users betting on the outcome of the snap election to determine the next Prime Minister of Canada appear to be favoring a Liberal Party victory as residents head to cast their votes.
          As of April 28, cryptocurrency betting platform Polymarket gave current Canadian Prime Minister and Liberal Party candidate Mark Carney a 79% chance of defeating Conservative Party candidate Pierre Poilievre in the race for the country's next PM. Data from the platform showed users had poured more than $75 million into bets surrounding the race, predicting a Poilievre or Carney victory.

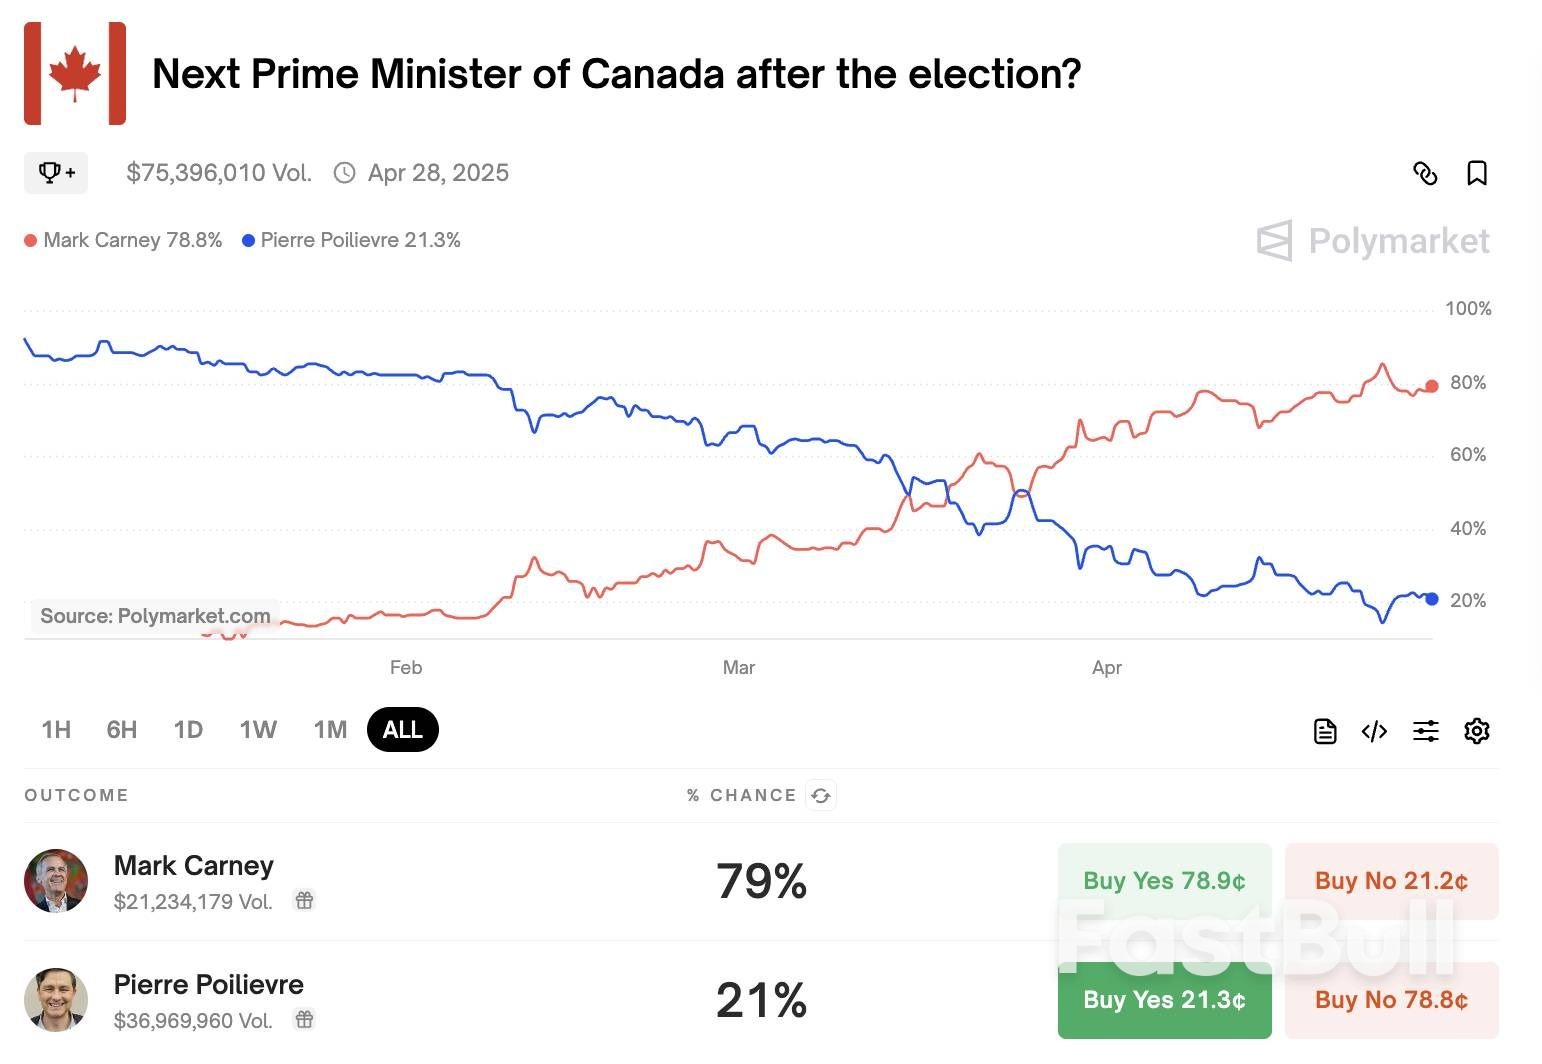
          Polymarket chances favor the Liberal Party's Mark Carney over the Conservative Party's Pierre Poilievre to be the next Canadian Prime Minister.

          The odds suggested by the platform, as well as those from many polls, show a nearly complete reversal of fortunes between the two candidates after former Prime Minister Justin Trudeau resigned in January. Trudeau and, by association, many in the Liberal Party, faced criticism over the handling of Canada's housing crisis and questions about how he would face US President Donald Trump's then-proposed tariffs.
          Following Trudeau's resignation, Trump stepped up rhetoric disparaging Canada, repeatedly referring to the country as the US's “51st state” and Trudeau as its “governor.” The US President also imposed a 25% tariff on goods imported from Canada in March. The policies seem to have led to increasing anti-Trump sentiment in Canada, with many residents booing the US national anthem at hockey games and making comparisons between the president and Poilievre.

          Source: CryptoSlate

          Risk Warnings and Disclaimers
          You understand and acknowledge that there is a high degree of risk involved in trading. Following any strategies or investment methods may lead to potential losses. The content on the site is provided by our contributors and analysts for information purposes only. You are solely responsible for determining whether any trading assets, securities, strategy, or any other product is suitable for investing based on your own investment objectives and financial situation.
          Add to Favorites
          Share

          Oil News: Crude Futures Slip as Traders Weigh Global Economic Signals, OPEC Outlook

          Adam

          Commodity

          Futures Slip as Traders Eye Global Economic Signals

          Oil News: Crude Futures Slip as Traders Weigh Global Economic Signals, OPEC Outlook_1Daily Light Crude Oil Futures

          Light crude oil futures are trading slightly lower Monday, holding just below a critical pivot level at $63.06. Price action suggests a downside bias is forming, with the next potential support target at $59.67 if selling pressure intensifies. Resistance stands near last week’s high of $64.87, followed by the 50-day moving average at $66.05. The technical setup points to cautious sentiment, with the market at risk of deeper retracements if external pressures persist.

          Economic Uncertainty and OPEC+ Supply Concerns Weigh on Oil

          Oil markets today are grappling with broad macro uncertainty. Conflicting signals on U.S.-China trade negotiations continue to cloud the outlook for global growth and fuel demand. Analysts highlight the trade war’s dominant role over nuclear talks with Iran or internal OPEC+ tensions. Investors remain sensitive to headlines, with any sign of thawing trade relations seen as a potential catalyst for buying interest. Meanwhile, expectations that OPEC+ could accelerate production hikes at its upcoming May 5 meeting are adding to supply-side pressure.

          China’s Crude Imports Surge, But Demand Questions Remain

          Fresh data shows China’s crude surplus rose sharply in March, reaching 1.74 million barrels per day—the highest in nearly three years. This came despite a 0.4% year-over-year increase in refinery processing rates, supported by record domestic production. Imports surged 5% year-over-year, led by Iranian and Russian barrels, as Chinese refiners stocked up ahead of anticipated U.S. sanctions. However, questions remain whether this March strength reflects sustainable demand growth or temporary stockpiling against falling global prices.

          Political Risk Grows With Iranian Tensions

          Adding to the market’s geopolitical risks, a deadly explosion at Iran’s Bandar Abbas port over the weekend further stoked uncertainty. While nuclear talks between Iran and the U.S. continue, Iranian officials expressed doubt over reaching a resolution. Any escalation in Middle East tensions could quickly ripple through oil markets, particularly if supply chains are disrupted.

          Market Forecast

          Given technical weakness under key moving averages, ongoing trade war tensions, and signs of elevated Chinese stockpiling rather than organic demand growth, the short-term outlook for oil remains bearish. Traders should monitor developments around U.S.-China talks, OPEC+ decisions, and Middle East stability for potential catalysts.

          Source: fxempire

          Risk Warnings and Disclaimers
          You understand and acknowledge that there is a high degree of risk involved in trading. Following any strategies or investment methods may lead to potential losses. The content on the site is provided by our contributors and analysts for information purposes only. You are solely responsible for determining whether any trading assets, securities, strategy, or any other product is suitable for investing based on your own investment objectives and financial situation.
          Add to Favorites
          Share

          Emerging-Market Stocks Extend Rally As Tariff Sentiment Improves

          Devin

          Economic

          A gauge that tracks emerging stocks gained 0.55% and is trading near the highest level since the day after President Donald Trump presented his reciprocal tariffs. The MSCI Index leaped 3.4% last week.

          The upward movement “seems to be driven by some optimism regarding a potential de-escalation of Trump’s tariffs,” said Gordian Kemen, head of emerging markets sovereign strategy at Standard Chartered.

          Monday’s gains also put the EM stocks index above its 200-day moving average. If the gauge ends April with an advance, that would mark a gain in each of the first four months of a year — a feat last achieved in 2019. Earnings estimates for the gauge have risen 0.8% this month, the most since August.

          For Michael Brown, a senior research strategist at Pepperstone Group Ltd, the recent EM rally has been largely driven by the broad “sell America” trade amid policy uncertainty from Trump. Those countries that reach trade deals with the US — which result in a permanent lowering of tariffs — are likely to outperform peers.

          Meanwhile, in the foreign exchange market, currencies are trading mixed, with the MSCI currency index up just 0.1%. The South African rand and Argentina’s peso led the gains in the emerging basket, while the Chilean peso lagged its peers.

          Earlier, assets in Colombia dropped after the International Monetary Fund paused access to an $8.1 billion flexible credit line. The country’s peso plunged as much as 0.8% while its dollar bonds fell across the curve, with notes maturing in 2035 down 1 cent to about 100 cents on the dollar

          Trade Watch

          Hopes have grown that the worst of the US tariff threat may be passing after Treasury Secretary Scott Bessent said last week that the US and South Korea could reach an “agreement of understanding” on trade as soon as this week. Bessent said Sunday that negotiations with some trading partners “are moving along very well, especially with the Asian countries.”

          Traders this week will also be watching for key US data including growth and a gauge of inflation to assess if Trump’s trade war has begun to affect the economy. Meanwhile, Chinese officials Monday reiterated a pledge to aid growth ahead of the release of factory activity data later this week.

          Source: Yahoo Finance

          To stay updated on all economic events of today, please check out our Economic calendar
          Risk Warnings and Disclaimers
          You understand and acknowledge that there is a high degree of risk involved in trading. Following any strategies or investment methods may lead to potential losses. The content on the site is provided by our contributors and analysts for information purposes only. You are solely responsible for determining whether any trading assets, securities, strategy, or any other product is suitable for investing based on your own investment objectives and financial situation.
          Add to Favorites
          Share

          Record $3.2 billion inflows into Bitcoin funds signal new safe-haven status

          Adam

          Cryptocurrency

          Crypto-related investment products recorded $3.4 billion in inflows last week, marking the most significant weekly inflow since mid-December 2024 and the third-highest on record, according to CoinShares‘ latest report.
          James Butterfill, Head of Research at CoinShares, linked the surge to growing concerns about the weakening US dollar and fears over tariff-related impacts on corporate earnings.
          He noted that this inflow shows investors increasingly turn to digital assets as safe-haven options amid global economic uncertainty.

          US Bitcoin products pull over $3 billion in inflow

          According to CoinShares, Bitcoin investment products accounted for nearly 94% of last week’s total inflows.
          This is evidenced by the fact that US-based spot Bitcoin exchange-traded fund (ETF) products registered their strongest week since Donald Trump returned to the White House in January.
          Collectively, Bitcoin ETFs attracted over $3 billion in inflows, with BlackRock’s IBIT leading the way by securing more than half of the new funds.
          Record $3.2 billion inflows into Bitcoin funds signal new safe-haven status_1

          Crypto Investment Products Flows

          Meanwhile, the wave of new investments pushed the total assets under management for Bitcoin-relayed products to $132 billion, a milestone not seen since February 2025.
          Market analysts suggest that the inflow reflects Bitcoin’s growing independence from traditional risk assets like US equities, and gold has strengthened its appeal as a safe-haven asset.
          Reflecting this momentum, Bitcoin’s price surged by over 8% last week to reach $94,682 at press time, according to data from CryptoSlate.

          Ethereum reverses negative trend

          Ethereum also reversed its recent trend of outflows, attracting $183 million in new investments. This marks the end of an eight-week streak of negative sentiment that significantly impacted the second-largest crypto asset by market cap.
          Despite this new capital inflow, Ethereum’s price remains below the critical $2,000 threshold. ETH is trading at around $1,806 as of press time, up 10% over the past week.
          Record $3.2 billion inflows into Bitcoin funds signal new safe-haven status_2

          Crypto Investment Flows

          Other altcoins recorded smaller yet notable inflows. XRP and Sui saw $31.6 million and $20.7 million in new investments, respectively.
          However, not all assets benefited from the positive market momentum. Solana was the only major altcoin to experience an outflow, losing $5.7 million in investments during the period.
          Nonetheless, the broader inflow trend reflects strengthening investor confidence in digital assets, even as traditional markets face uncertainty.

          Source: cryptoslate

          Risk Warnings and Disclaimers
          You understand and acknowledge that there is a high degree of risk involved in trading. Following any strategies or investment methods may lead to potential losses. The content on the site is provided by our contributors and analysts for information purposes only. You are solely responsible for determining whether any trading assets, securities, strategy, or any other product is suitable for investing based on your own investment objectives and financial situation.
          Add to Favorites
          Share

          Crypto Predictions Heat Up: BTC, Fartcoin, And PEPE On The Rise

          Fiona Harper

          Cryptocurrency

          Economic

          As of the time this article was prepared, Bitcoin's value had declined to $94,200, initiating a selling wave with the opening of the U.S. market. For Bitcoin to continue its upward trend, it must maintain a support level around $93,200. What are the latest predictions from crypto experts? What can enthusiasts expect?

          Bitcoin (BTC) Insights

          Sherpa noted in today's assessment that Bitcoin is preparing for a new attempt at $109,800. Following a prolonged accumulation phase, BTC experienced a bullish breakout but has not yet returned to the anticipated peak region. After testing its all-time high, analysts expect a local peak and a setback to $100,000, anticipating that this will pave the way for even higher peaks.
          However, as May approaches, the traditional “sell in May and go away” mentality could dominate the market. This suggests that buyers may become less enthusiastic, leading to lackluster movements due to weakened trading volumes.
          Should there be an exception, the expectations for continued interest rate cuts by the Fed in June could inject vigor into the crypto market.
          TraderSZ recently shared a graph suggesting that by the end of the year, BTC prices should peak around $144,221 according to technical indicators.

          Fartcoin and PEPE Predictions

          Altcoin investors are still facing challenges. The inability of Bitcoin to surpass the pivotal six-figure zone above $94,000 remains discouraging. While recent tariff-related statements have softened, tangible agreements are necessary, and conflicting reports about discussions with China need to cease.
          The Treasury Secretary stated that we would see the first trade agreement by next week. If this occurs, the anticipated support for cryptocurrencies could materialize. Analyst Sherpa, known for his insights on altcoins, shared a graph for his favored altcoin, Fartcoin, noting potential fluctuations.
          “It wouldn't be surprising to see some pullback here, but remember that the warming weather will lead prices up. There are three scenarios, all largely depending on BTC. I believe this is simply ongoing.”
          In the analysis of PEPE Coin, the expert indicates that the long period of BTC suppressing altcoins is nearing its end, signaling that the time has come for a shift.

          Source: CryptoSlate

          To stay updated on all economic events of today, please check out our Economic calendar
          Risk Warnings and Disclaimers
          You understand and acknowledge that there is a high degree of risk involved in trading. Following any strategies or investment methods may lead to potential losses. The content on the site is provided by our contributors and analysts for information purposes only. You are solely responsible for determining whether any trading assets, securities, strategy, or any other product is suitable for investing based on your own investment objectives and financial situation.
          Add to Favorites
          Share

          Dow Jones Rises As Nvidia Slides On New China AI Chip; Tesla Extends Rally

          Adam

          Economic

          The Dow Jones Industrial Average and other major stock indexes traded mixed Monday, as Wall Street was in danger of snapping a four-day winning streak. In stocks, Tesla (TSLA) looked to continue its rally, while Nvidia (NVDA) fell sharply on reports of a new artificial intelligence chip out of China.
          After the opening bell, the Dow Jones Industrial Average rose 0.5%. The S&P 500 moved up 0.3%, as the tech-heavy Nasdaq composite gained 0.2% in morning trading.
          The 10-year Treasury yield ticked higher to 4.29% early Monday. Meanwhile, oil prices dropped, as West Texas Intermediate futures traded near $62.90 per barrel.
          Among exchange traded funds, the Invesco QQQ Trust (QQQ) inched up, while the SPDR S&P 500 ETF (SPY) moved up 0.3% after the open.
          Tesla stock climbed another 2.4% in early action Monday, on pace extend last week's sharp gains. Shares bullishly climbed above their 50-day moving average line Friday, and are now within striking distance of their 200-day line, the next resistance level to watch. The Elon-Musk led-company remains nearly 42% off its record high of 488.54, reached on Dec. 18.
          Nvidia stock declined 1.6% in morning action Monday after the Wall Street Journal reported that China's Huawei is developing a new AI chip that could replace some of Nvidia's high-end semiconductors. Shares of the AI giant rallied sharply for a fourth-straight session Friday, headed toward their 50-day line, an important area to watch.

          Stock Market Today: GDP, Inflation, Payroll Reports Loom

          On the economic front this week are the releases of GDP and inflation reports from the U.S. Commerce Department, along with monthly payrolls data from the Labor Department.
          Forecasts say first-quarter GDP, out Wednesday, will show growth slowing to a 0.9% annualized rate from 2.4% in the fourth quarter, according to FactSet. The personal income and outlays report will include the core Personal Consumption Expenditures price index, the Fed's primary inflation measure. Economists expect a 0.1% rise, lowering the 12-month inflation rate to 2.6%.
          In stocks, Domino's Pizza (DPZ) declined 0.8% Monday after the pizza joint reported earnings early. Shares remain near a 500.55 buy point.
          First-quarter earnings season heats up this week, with results from Apple (AAPL), Amazon.com (AMZN), Exxon Mobil (XOM), Chevron (CVX), Caterpillar (CAT), Pfizer (PFE) and Eli Lilly (LLY).

          Dow Jones Extends Rally

          On Friday, blue chips on the Dow Jones Industrial Average climbed less than 0.1%, or 20 points. The S&P 500 rose 0.7%, while the Nasdaq composite advanced 1.3%.
          Due to current market volatility, now is an important time to read IBD's The Big Picture column for how to handle the current market and to track the updated exposure level.
          Among the best companies to watch in the current stock market are CrowdStrike (CRWD), MercadoLibre (MELI), Penumbra (PEN), Spotify (SPOT) and TJX (TJX).
          Along with Apple and Nvidia, Dow Jones components making notable moves this week were Amazon.com, Microsoft (MSFT) and McDonald's (MCD).
          Check out IBD MarketSurge's "Breaking Out Today" list for top growth stocks that are moving above correct buy points. Investor also can find potential breakouts on the "Near Pivot" list. To find additional stock ideas, check IBD Stock Lists like IBD 50, Big Cap 20 and Stocks Near A Buy Zone.

          Dow Jones Stocks: McDonald's Nears Buy Point

          Shares of Dow Jones component McDonald's edged higher Monday after briefly rallying above an early entry at 319.72 Friday. The stock is forming a flat base with a 326.32 buy point, according to MarketSurge chart analysis.
          Outside the Dow, cybersecurity leader and new IBD Leaderboard stock CrowdStrike is adding to breakout gains past a 400.02 buy point in a cup with handle, according to IBD MarketSurge chart analysis. Shares lost 0.2% Monday morning.
          E-commerce giant MercadoLibre is just above a 2,202 buy point in a double bottom, according to IBD MarketSurge. MercadoLibre stock dropped 0.3% Monday.
          Penumbra also broke out last week, topping a 288.57 double-bottom entry. Its relative strength line is at new highs, triggering the blue dot on the IBD MarketSurge chart. That's a bullish indicator of market leadership. Shares inched up 0.1% early Monday.
          Music streaming leader Spotify has topped a double-bottom's 621.20 buy point. Spotify stock was down 1.9% Monday.
          Finally, Guidewire is rapidly nearing a 201 buy point in a double bottom, finishing Friday just below the buy trigger. Guidewire stock moved up 1.2% in early morning trades.

          Dow Jones Leaders: Amazon, Apple, Microsoft

          Magnificent Seven stocks are rebounding from lows as Wall Street reacts to the fallout of President Donald Trump's tariffs. One of them, Dow Jones component Amazon, fell 0.2% early Monday, still leaving the stock squarely below its 200-day line.
          IPhone maker Apple moved down a fraction Monday morning. Shares closed Friday at their highest level since early April.
          Finally, software giant Microsoft dropped 0.8% Monday. Shares are above their 50-day line for the first time since late January.

          Source : investors

          To stay updated on all economic events of today, please check out our Economic calendar
          Risk Warnings and Disclaimers
          You understand and acknowledge that there is a high degree of risk involved in trading. Following any strategies or investment methods may lead to potential losses. The content on the site is provided by our contributors and analysts for information purposes only. You are solely responsible for determining whether any trading assets, securities, strategy, or any other product is suitable for investing based on your own investment objectives and financial situation.
          Add to Favorites
          Share
          FastBull
          Copyright © 2025 FastBull Ltd

          728 RM B 7/F GEE LOK IND BLDG NO 34 HUNG TO RD KWUN TONG KLN HONG KONG

          TelegramInstagramTwitterfacebooklinkedin
          App Store Google Play Google Play
          Products
          Charts

          Chats

          Q&A with Experts
          Screeners
          Economic Calendar
          Data
          Tools
          Membership
          Features
          Function
          Markets
          Copy Trading
          Latest Signals
          Contests
          News
          Analysis
          24/7
          Columns
          Education
          Company
          Careers
          About Us
          Contact Us
          Advertising
          Help Center
          Feedback
          User Agreement
          Privacy Policy
          Business

          White Label

          Data API

          Web Plug-ins

          Poster Maker

          Affiliate Program

          Risk Disclosure

          The risk of loss in trading financial instruments such as stocks, FX, commodities, futures, bonds, ETFs and crypto can be substantial. You may sustain a total loss of the funds that you deposit with your broker. Therefore, you should carefully consider whether such trading is suitable for you in light of your circumstances and financial resources.

          No decision to invest should be made without thoroughly conducting due diligence by yourself or consulting with your financial advisors. Our web content might not suit you since we don't know your financial conditions and investment needs. Our financial information might have latency or contain inaccuracy, so you should be fully responsible for any of your trading and investment decisions. The company will not be responsible for your capital loss.

          Without getting permission from the website, you are not allowed to copy the website's graphics, texts, or trademarks. Intellectual property rights in the content or data incorporated into this website belong to its providers and exchange merchants.

          Not Logged In

          Log in to access more features

          FastBull Membership

          Not yet

          Purchase

          Become a signal provider
          Help Center
          Customer Service
          Dark Mode
          Price Up/Down Colors

          Log In

          Sign Up

          Position
          Layout
          Fullscreen
          Default to Chart
          The chart page opens by default when you visit fastbull.com