• Trade
  • Markets
  • Copy
  • Contests
  • News
  • 24/7
  • Calendar
  • Q&A
  • Chats
Trending
Screeners
SYMBOL
LAST
BID
ASK
HIGH
LOW
NET CHG.
%CHG.
SPREAD
SPX
S&P 500 Index
6870.39
6870.39
6870.39
6895.79
6858.28
+13.27
+ 0.19%
--
DJI
Dow Jones Industrial Average
47954.98
47954.98
47954.98
48133.54
47871.51
+104.05
+ 0.22%
--
IXIC
NASDAQ Composite Index
23578.12
23578.12
23578.12
23680.03
23506.00
+72.99
+ 0.31%
--
USDX
US Dollar Index
98.830
98.910
98.830
98.960
98.810
-0.120
-0.12%
--
EURUSD
Euro / US Dollar
1.16543
1.16550
1.16543
1.16553
1.16341
+0.00117
+ 0.10%
--
GBPUSD
Pound Sterling / US Dollar
1.33398
1.33405
1.33398
1.33420
1.33151
+0.00086
+ 0.06%
--
XAUUSD
Gold / US Dollar
4208.48
4208.93
4208.48
4213.06
4190.61
+10.57
+ 0.25%
--
WTI
Light Sweet Crude Oil
59.867
59.904
59.867
60.063
59.752
+0.058
+ 0.10%
--

Community Accounts

Signal Accounts
--
Profit Accounts
--
Loss Accounts
--
View More

Become a signal provider

Sell trading signals to earn additional income

View More

Guide to Copy Trading

Get started with ease and confidence

View More

Signal Accounts for Members

All Signal Accounts

Best Return
  • Best Return
  • Best P/L
  • Best MDD
Past 1W
  • Past 1W
  • Past 1M
  • Past 1Y

All Contests

  • All
  • Trump Updates
  • Recommend
  • Stocks
  • Cryptocurrencies
  • Central Banks
  • Featured News
Top News Only
Share

Governor: Russian Drone Strike On Ukraine's Sumy Injures At Least Seven

Share

Inida's Nifty Psu Bank Index Down 1.3%

Share

India Markets Regulator Official: Have Created A Platform For Real Time Monitoring Of Algo Returns

Share

Cambodia Provincial Official: 3 Cambodian Civilians Seriously Injured In Thai-Cambodia Fighting

Share

Russia's Air Defences Destroy 67 Ukrainian Drones Overnight, RIA Agency Reports

Share

India's Nifty 50 Index Down 0.37%

Share

Hsi Down 287 Pts, Hsti Down 13 Pts, Pop Mart Down Over 8%, Ping An Hit New Highs

Share

China's November Coal Imports Down 20% Year-On-Year

Share

At Least One Thai Soldier Killed And 7 Wounded - Thai Army Spokesman

Share

India's Nifty Bank Futures Up 0.73% In Pre-Open Trade

Share

Cambodia Has Expanded Clashes To Several New Locations - Thai Army Spokesman

Share

Cambodian Military Has Increased Deployment Of Troops And Weapons - Thai Army Spokesman

Share

India's Nifty 50 Futures Up 0.53% In Pre-Open Trade

Share

India's Nifty 50 Index Down 0.1% In Pre-Open Trade

Share

Indian Rupee Opens Down 0.1% At 90.0625 Per USA Dollar, Versus 89.98 Previous Close

Share

China November Copper Imports At 427000 Tonnes

Share

China November Coal Imports At 44.05 Million Tonnes

Share

China November Iron Ore Imports At 110.54 Million Tonnes, Down 0.7 % From October

Share

China November Meat Imports At 393000 Tonnes

Share

China Imported 8.11 Million Tonnes Of Soy In November

TIME
ACT
FCST
PREV
U.S. Personal Income MoM (Sept)

A:--

F: --

P: --

U.S. PCE Price Index YoY (SA) (Sept)

A:--

F: --

P: --

U.S. PCE Price Index MoM (Sept)

A:--

F: --

P: --

U.S. Personal Outlays MoM (SA) (Sept)

A:--

F: --

P: --

U.S. Core PCE Price Index MoM (Sept)

A:--

F: --

P: --

U.S. Core PCE Price Index YoY (Sept)

A:--

F: --

P: --

U.S. UMich 5-Year-Ahead Inflation Expectations Prelim YoY (Dec)

A:--

F: --

P: --

U.S. Real Personal Consumption Expenditures MoM (Sept)

A:--

F: --

P: --

U.S. UMich Current Economic Conditions Index Prelim (Dec)

A:--

F: --

P: --

U.S. UMich Consumer Sentiment Index Prelim (Dec)

A:--

F: --

P: --

U.S. UMich 1-Year-Ahead Inflation Expectations Prelim (Dec)

A:--

F: --

P: --

U.S. UMich Consumer Expectations Index Prelim (Dec)

A:--

F: --

P: --

U.S. Weekly Total Rig Count

A:--

F: --

P: --

U.S. Weekly Total Oil Rig Count

A:--

F: --

P: --

U.S. Unit Labor Cost Prelim (SA) (Q3)

--

F: --

P: --

U.S. Consumer Credit (SA) (Oct)

A:--

F: --

P: --

China, Mainland Foreign Exchange Reserves (Nov)

A:--

F: --

P: --

Japan Wages MoM (Oct)

A:--

F: --

P: --

Japan Trade Balance (Oct)

A:--

F: --

P: --

Japan Nominal GDP Revised QoQ (Q3)

A:--

F: --

P: --

Japan Trade Balance (Customs Data) (SA) (Oct)

A:--

F: --

P: --

Japan GDP Annualized QoQ Revised (Q3)

A:--

F: --

P: --
China, Mainland Exports YoY (CNH) (Nov)

A:--

F: --

P: --

China, Mainland Imports YoY (CNH) (Nov)

A:--

F: --

P: --

China, Mainland Exports (Nov)

A:--

F: --

P: --

China, Mainland Imports (CNH) (Nov)

A:--

F: --

P: --

China, Mainland Trade Balance (CNH) (Nov)

A:--

F: --

P: --

China, Mainland Imports YoY (USD) (Nov)

A:--

F: --

P: --

China, Mainland Exports YoY (USD) (Nov)

A:--

F: --

P: --

China, Mainland Trade Balance (USD) (Nov)

A:--

F: --

P: --

Germany Industrial Output MoM (SA) (Oct)

--

F: --

P: --

Euro Zone Sentix Investor Confidence Index (Dec)

--

F: --

P: --

Canada Leading Index MoM (Nov)

--

F: --

P: --

Canada National Economic Confidence Index

--

F: --

P: --

U.S. Dallas Fed PCE Price Index YoY (Sept)

--

F: --

P: --

China, Mainland Trade Balance (USD) (Nov)

--

F: --

P: --

U.S. 3-Year Note Auction Yield

--

F: --

P: --

U.K. BRC Overall Retail Sales YoY (Nov)

--

F: --

P: --

U.K. BRC Like-For-Like Retail Sales YoY (Nov)

--

F: --

P: --

Australia Overnight (Borrowing) Key Rate

--

F: --

P: --

RBA Rate Statement
RBA Press Conference
Germany Exports MoM (SA) (Oct)

--

F: --

P: --

U.S. NFIB Small Business Optimism Index (SA) (Nov)

--

F: --

P: --

Mexico Core CPI YoY (Nov)

--

F: --

P: --

Mexico 12-Month Inflation (CPI) (Nov)

--

F: --

P: --

Mexico PPI YoY (Nov)

--

F: --

P: --

Mexico CPI YoY (Nov)

--

F: --

P: --

U.S. Weekly Redbook Index YoY

--

F: --

P: --

U.S. JOLTS Job Openings (SA) (Oct)

--

F: --

P: --

China, Mainland M2 Money Supply YoY (Nov)

--

F: --

P: --

China, Mainland M0 Money Supply YoY (Nov)

--

F: --

P: --

China, Mainland M1 Money Supply YoY (Nov)

--

F: --

P: --

U.S. EIA Short-Term Crude Production Forecast For The Next Year (Dec)

--

F: --

P: --

U.S. EIA Short-Term Crude Production Forecast For The Year (Dec)

--

F: --

P: --

U.S. EIA Natural Gas Production Forecast For The Next Year (Dec)

--

F: --

P: --

EIA Monthly Short-Term Energy Outlook
U.S. 10-Year Note Auction Avg. Yield

--

F: --

P: --

U.S. API Weekly Cushing Crude Oil Stocks

--

F: --

P: --

U.S. API Weekly Crude Oil Stocks

--

F: --

P: --

Q&A with Experts
    • All
    • Chatrooms
    • Groups
    • Friends
    Connecting
    .
    .
    .
    Type here...
    Add Symbol or Code

      No matching data

      All
      Trump Updates
      Recommend
      Stocks
      Cryptocurrencies
      Central Banks
      Featured News
      • All
      • Russia-Ukraine Conflict
      • Middle East Flashpoint
      • All
      • Russia-Ukraine Conflict
      • Middle East Flashpoint
      Search
      Products

      Charts Free Forever

      Chats Q&A with Experts
      Screeners Economic Calendar Data Tools
      Membership Features
      Data Warehouse Market Trends Institutional Data Policy Rates Macro

      Market Trends

      Market Sentiment Order Book Forex Correlations

      Top Indicators

      Charts Free Forever
      Markets

      News

      News Analysis 24/7 Columns Education
      From Institutions From Analysts
      Topics Columnists

      Latest Views

      Latest Views

      Trending Topics

      Top Columnists

      Latest Update

      Signals

      Copy Rankings Latest Signals Become a signal provider AI Rating
      Contests
      Brokers

      Overview Brokers Assessment Rankings Regulators News Claims
      Broker listing Forex Brokers Comparison Tool Live Spread Comparison Scam
      Q&A Complaint Scam Alert Videos Tips to Detect Scam
      More

      Business
      Events
      Careers About Us Advertising Help Center

      White Label

      Data API

      Web Plug-ins

      Affiliate Program

      Awards Institution Evaluation IB Seminar Salon Event Exhibition
      Vietnam Thailand Singapore Dubai
      Fans Party Investment Sharing Session
      FastBull Summit BrokersView Expo
      Recent Searches
        Top Searches
          Markets
          News
          Analysis
          User
          24/7
          Economic Calendar
          Education
          Data
          • Names
          • Latest
          • Prev

          View All

          No data

          Scan to Download

          Faster Charts, Chat Faster!

          Download App
          English
          • English
          • Español
          • العربية
          • Bahasa Indonesia
          • Bahasa Melayu
          • Tiếng Việt
          • ภาษาไทย
          • Français
          • Italiano
          • Türkçe
          • Русский язык
          • 简中
          • 繁中
          Open Account
          Search
          Products
          Charts Free Forever
          Markets
          News
          Signals

          Copy Rankings Latest Signals Become a signal provider AI Rating
          Contests
          Brokers

          Overview Brokers Assessment Rankings Regulators News Claims
          Broker listing Forex Brokers Comparison Tool Live Spread Comparison Scam
          Q&A Complaint Scam Alert Videos Tips to Detect Scam
          More

          Business
          Events
          Careers About Us Advertising Help Center

          White Label

          Data API

          Web Plug-ins

          Affiliate Program

          Awards Institution Evaluation IB Seminar Salon Event Exhibition
          Vietnam Thailand Singapore Dubai
          Fans Party Investment Sharing Session
          FastBull Summit BrokersView Expo

          UMich Sentiment Surges Higher In Early June, But 'Tariff Derangement Sydrome' Remains

          Damon

          Economic

          Summary:

          Democrats expect prices to rise over 10% in the next year.

          Just days after CPI disappointed the the Trump Tariff infation fear-mongers once again and a month since the UMich survey found that "Women, Democrats, & Low-Income Americans Are Out Of Their TDS-Addled Minds", and one week after Goldman finally called out the idiocy of the UMich survey, slamming its "partisanship" and the "sample design break starting from June 2024"...

          UMich Sentiment Surges Higher In Early June, But 'Tariff Derangement Sydrome' Remains_1

          not to mention that it has been chronically wrong, warning that "Michigan inflation expectations have already risen even more than in 2022 and this time long-term expectations have risen sharply too, all before tariffs have even meaningfully boosted consumer prices" while "technicalities have exaggerated the increase in the Michigan [inflation] survey, as other survey measures and market-implied inflation compensation have not risen much at horizons beyond the next year", moments ago the preliminary UMich survey for the month of June saw sharp revisions to the prelim prints, to wit:

          • The headline Sentiment print jumped dramatically from its lowest since May 1980 - to 60.5, well above the median estimate of 53.6

          • The Current Conditions print also surged from 58.9 to 63.7, well above expectations.

          • The Expectations print spiked to 58.4 from 47.9 and above the median estimate of 49.7

          UMich Sentiment Surges Higher In Early June, But 'Tariff Derangement Sydrome' Remains_2

          Source: Bloomberg

          These trends were unanimous across the distributions of age, income, wealth, political party, and geographic region. Moreover, all five index components rose, with a particularly steep increase for short and long-run expected business conditions, consistent with a perceived easing of pressures from tariffs. Consumers appear to have settled somewhat from the shock of the extremely high tariffs announced in April and the policy volatility seen in the weeks that followed.

          Inflation Expectations finally gave way to reality with 1Y expectations falling from 6.6% to 5.1%...

          UMich Sentiment Surges Higher In Early June, But 'Tariff Derangement Sydrome' Remains_3

          Source: Bloomberg

          However, 'Tariff Derangement Syndrome', as Treasury Secretary Scott Bessent called it, was very evident as Democrats' inflation expectations surged even higher to a ridiculous 10.1% over the next year!

          UMich Sentiment Surges Higher In Early June, But 'Tariff Derangement Sydrome' Remains_4

          Source: Bloomberg

          The longer-term inflation expectation also fell overall but both Independents and Democrats

          UMich Sentiment Surges Higher In Early June, But 'Tariff Derangement Sydrome' Remains_5

          Source: Bloomberg

          One more for fun - comparing Democrats view of the inflationary outlook to the 'hard' inflationary data...

          UMich Sentiment Surges Higher In Early June, But 'Tariff Derangement Sydrome' Remains_6

          Source: Bloomberg

          The percentage of UMich respondents making unsolicited negative comments about news they've heard on government economic policy remains just shy of record highs...

          UMich Sentiment Surges Higher In Early June, But 'Tariff Derangement Sydrome' Remains_7

          Source: Bloomberg

          But, as we tweeted, this farcical data makes no sense...

          We look forward to UMich explaining that... did they change the weighting of Democrats' TDS-addled views? (and not tell anyone?)

          Source: Zero Hedge

          To stay updated on all economic events of today, please check out our Economic calendar
          Risk Warnings and Disclaimers
          You understand and acknowledge that there is a high degree of risk involved in trading. Following any strategies or investment methods may lead to potential losses. The content on the site is provided by our contributors and analysts for information purposes only. You are solely responsible for determining whether any trading assets, securities, strategy, or any other product is suitable for investing based on your own investment objectives and financial situation.
          Add to Favorites
          Share

          Oil News: Crisis Trading Playbook Activated After Biggest Oil Shock Since 2020

          Adam

          Commodity

          Your Crisis Trading Playbook – Profits From Chaos

          Six hours into the biggest oil shock since 2020, clear winners and losers emerge. Smart money rotates aggressively while retail traders chase yesterday’s moves. Here’s your actionable guide to trading history’s next energy crisis.

          Energy Equities Beat Futures – Why Leverage Without Contango Wins

          Forget fighting futures roll costs in super-backwardation. Integrated oil majors offer cleaner exposure with massive operating leverage. Every $10 oil increase adds $15-20 billion to ExxonMobil’s annual cash flow. Chevron prints money above $80 Brent.
          The equity options market remains relatively calm versus futures volatility. XOM January $120 calls cost half the implied volatility of equivalent crude calls. That’s free leverage to triple-digit oil without theta decay eating returns.
          Avoid pure upstream plays paradoxically. Shale producers hedge 60-80% of production at lower prices. Their gains cap out while integrated majors with downstream assets capture full margin expansion. ConocoPhillips beats Pioneer Natural Resources in this environment.
          European oils trade at deeper discounts despite identical commodity exposure. Shell and BP offer 20% currency-adjusted discounts to American peers. TotalEnergies’ diverse gas portfolio provides additional upside. The arbitrage closes violently in sustained rallies.

          Shipping and Storage – The Overlooked Profit Centers

          Tanker equities exploded 15% today but remain cheap versus spot rate reality. Frontline trades at 0.7x NAV despite VLCC rates printing $100,000 daily. Management will declare special dividends if rates hold above $50,000 for a quarter.
          Product tankers outperform crude carriers in Middle East conflicts. Scorpio Tankers and Torm benefit from gasoline/diesel shipment disruption. These smaller vessels command proportionally higher war premiums. Operating leverage exceeds VLCCs at current rate levels.
          Storage plays activate above $85 oil. Vopak and Kinder Morgan own strategic terminals near refineries. Contango might seem impossible now, but supply releases create temporary gluts rewarding storage capacity. These defensive positions hedge against mean reversion.
          FLEX LNG captures forgotten LNG disruption. Qatar exports 20% of global LNG through Hormuz. Any interference spikes European gas prices given Russian supply loss. LNG shipping rates could triple overnight in worst-case scenarios.

          The Contrarian Shorts – Betting Against Extended Disruption

          Airlines entering death spirals above $100 oil. United Airlines burns $50 million extra monthly per $10 oil increase. Low-cost carriers like Spirit lack pricing power to pass through costs. Chapter 11 looms for weakest players at sustained triple-digit crude.
          Chemicals face margin apocalypse. LyondellBasell uses oil-based feedstocks while competitors use cheaper natural gas. Every $10 oil increase costs $500 million annually. The stock ignores this reality, creating asymmetric short opportunities.
          Emerging market currencies collapse as oil import bills explode. Turkish lira and Indian rupee face 20% devaluation risks at $120 oil. Short these currencies against USD provides macro hedge against equity longs.
          Tesla paradoxically suffers initially. EV demand requires functioning economies. Recession from oil shock delays purchases despite improved relative economics. The stock’s beta to broad markets overwhelms fundamental benefits. Wait for capitulation before buying.

          Risk Management in Violent Markets – Survival Before Profits

          Position sizing matters more than direction. This environment produces 10% daily moves. Size for total portfolio impact, not individual trade metrics. Risk 0.5% per idea versus normal 2% allocations.
          Use options spreads over outright positions. Bull call spreads capture upside while defining risk absolutely. Selling further strikes finances premium in volatile markets. Iron condors profit from eventual stabilization.
          Trail stops aggressively on winners. The Israeli attack news saw algorithms gun stops before reversing higher. Use mental stops or alerts rather than visible orders. Market makers hunt obvious levels in thin conditions.
          Most importantly – plan your exit before entering. Whether Iran retaliates determines everything. Define scenarios triggering position reduction. This crisis rewards disciplined process over conviction.
          Markets gave you a gift today – clear inefficiencies from forced repositioning. But gifts turn to traps without proper risk management. Trade the opportunity while respecting the unprecedented nature of current events.

          Source: fxempire

          Risk Warnings and Disclaimers
          You understand and acknowledge that there is a high degree of risk involved in trading. Following any strategies or investment methods may lead to potential losses. The content on the site is provided by our contributors and analysts for information purposes only. You are solely responsible for determining whether any trading assets, securities, strategy, or any other product is suitable for investing based on your own investment objectives and financial situation.
          Add to Favorites
          Share

          Fed to Keep Rates Steady As Tariffs, Possible Oil Shock Counter Inflation Data

          Michelle

          Economic

          Forex

          The Federal Reserve is widely expected to hold interest rates steady next week, with investors focused on new central bank projections that will show how much weight policymakers are putting on recent soft data and how much risk they attach to unresolved trade and budget issues and an intensifying conflict in the Middle East.

          Recent inflation data had eased concern that the tariffs imposed by President Donald Trump would translate quickly into higher prices, while the latest monthly employment report showed slowing job growth - a combination that, all things equal, would put the Fed closer to resuming its rate cuts.

          Trump has demanded the U.S. central bank lower its benchmark overnight interest rate immediately by a full percentage point, a dramatic step that would amount to an all-in bet by the Fed that inflation will fall to its 2% target and stay there regardless of what the administration does and even with dramatically looser financial conditions.

          The risks of that approach were highlighted overnight when an Israeli attack on Iran sent spot oil prices up nearly 9%, potentially upending a four-month run of falling energy prices that have helped keep overall inflation more moderate than expected. Iran is a major oil producer, and a broader conflict in the region could disrupt both production and shipping.

          Though the price of oil figures less prominently in U.S. inflation than it did during the oil shocks of the 1970s, big swings in commodity prices or developing geopolitical risks can make Fed officials more cautious in their decisions - as Russia's invasion of Ukraine did in early 2022 when it prompted the U.S. central bank to start a cycle of interest rate hikes with a quarter-percentage-point increase, smaller than many officials had favored before the war began.

          Line chart of Fed uncertainty survey.

          Trump's push to rewrite the rules of global trade also remains a work in progress, with potentially inflationary results. Since the Fed's last policy meeting in May, the administration delayed until next month a threatened round of global tariffs that central bank officials worry could lead to both higher prices and slower growth if implemented; trade tensions between the U.S. and China have eased but not been resolved; and the terms of a massive budget and tax bill under consideration in Congress are far from settled.

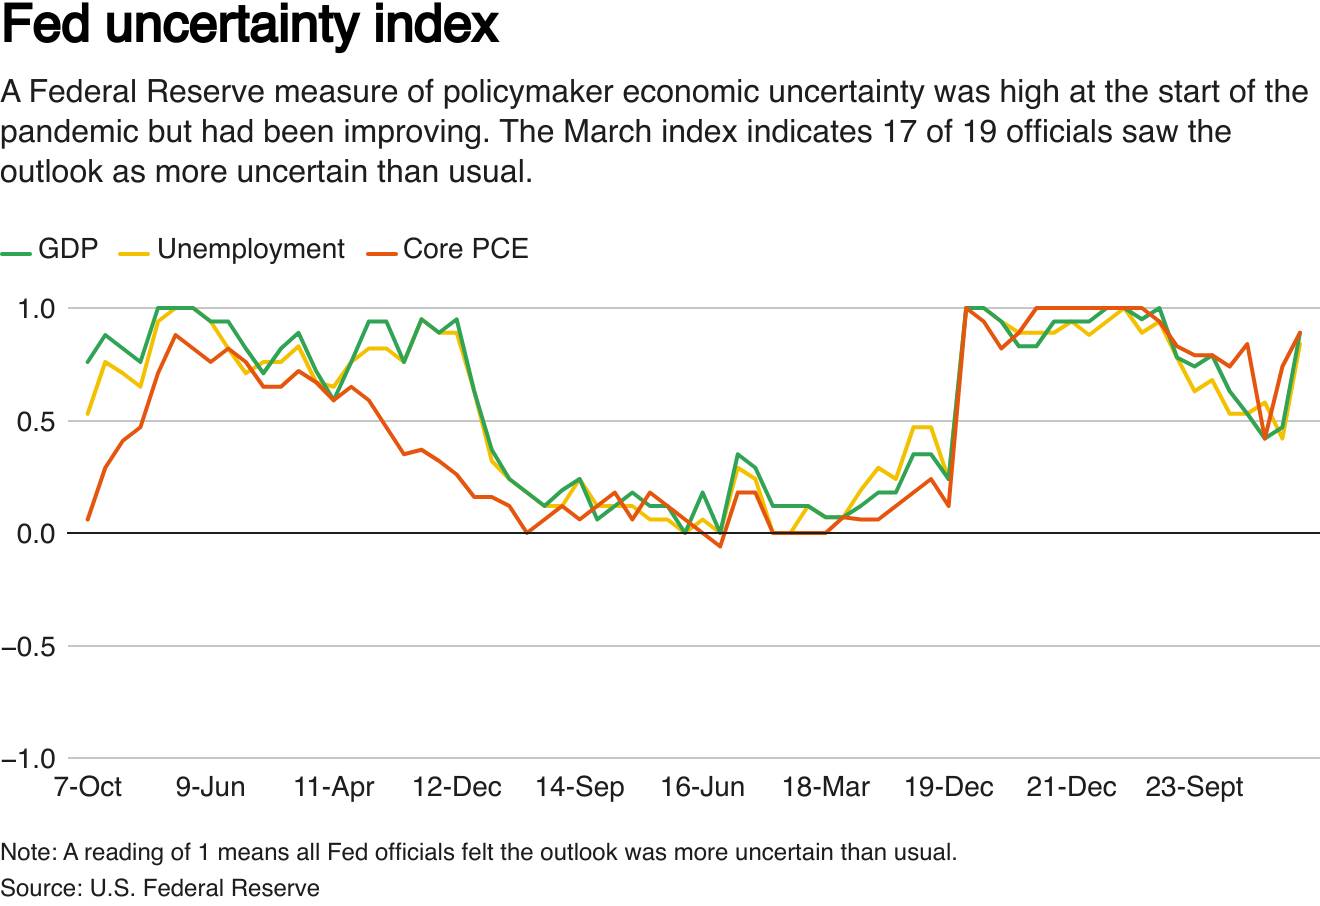
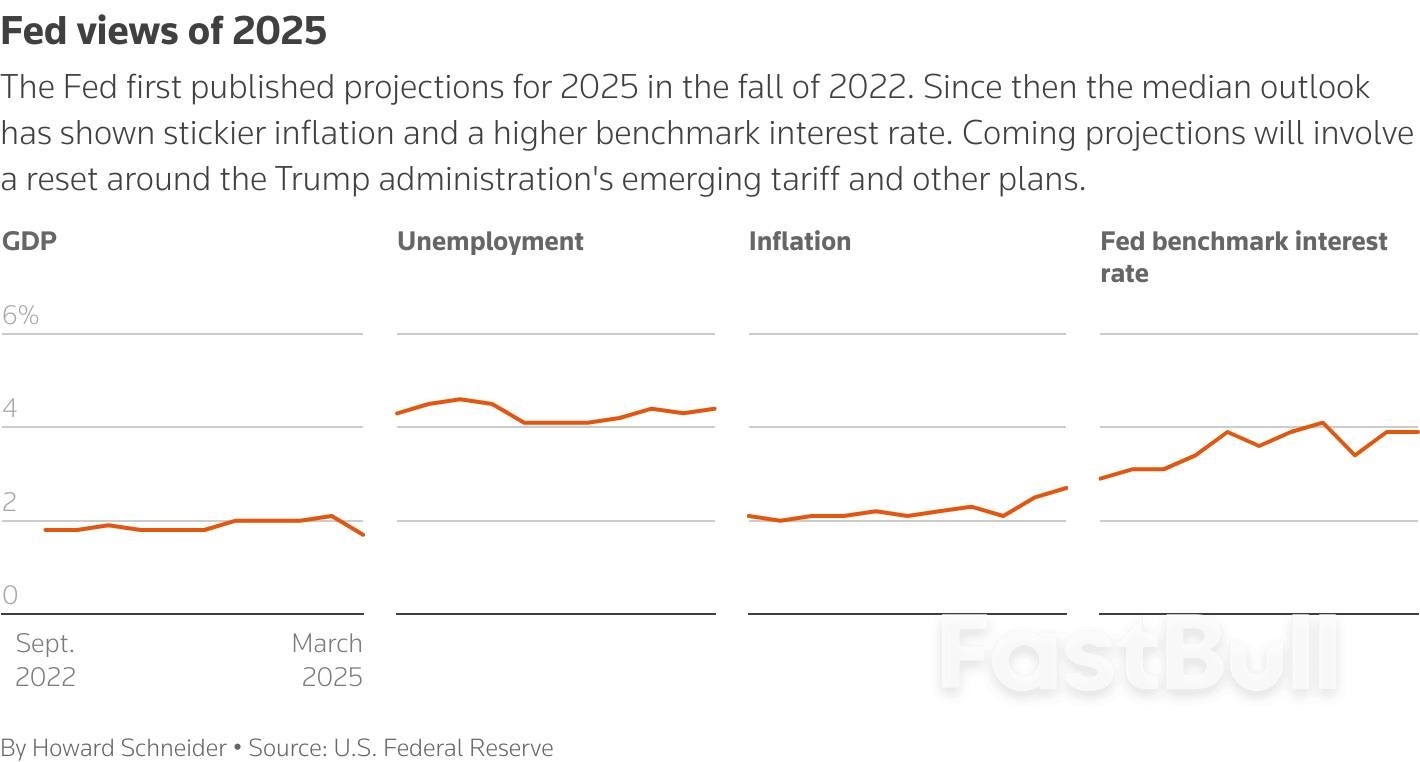
          When Fed officials issued their last set of quarterly projections in March, anticipating two quarter-percentage-point rate cuts this year, Fed Chair Jerome Powell noted the role that inertia can play in moments when the outlook is so unclear that "you just say 'maybe I'll stay where I am,'" a sentiment that may last as long as the tariff debate remains unresolved.

          "Recent Fed commentary has reinforced a wait-and-see approach, with officials signaling little urgency to adjust policy amid increased uncertainty around the economic outlook," Gregory Daco, chief economist at EY-Parthenon, wrote in the run-up to the Fed's June 17-18 meeting. Daco said he anticipates the median rate projection among the Fed's 19 policymakers to still show two rate cuts in 2025, with an overall tone of "cautious patience" and "little in the way of forward guidance" given the uncertainty weighing on households and businesses.

          Line charts showing Fed economic projections for 2025.

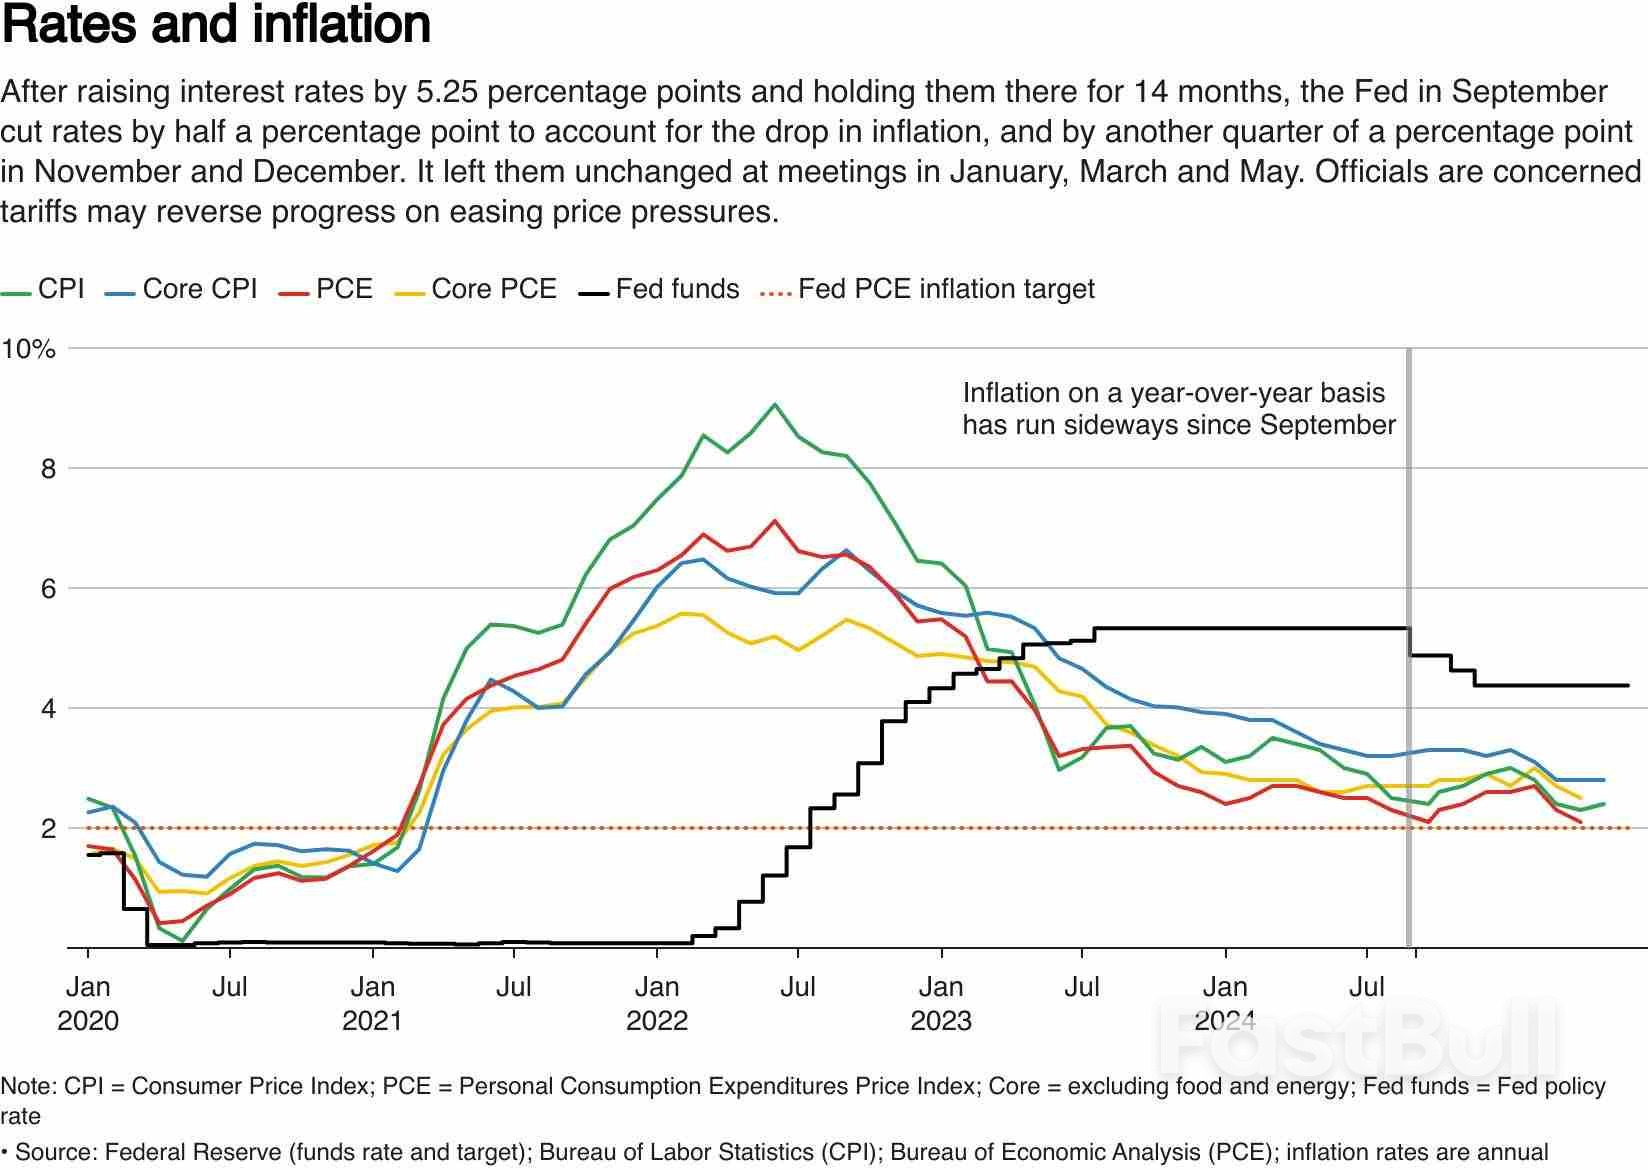
          That view aligns roughly with what investors in contracts tied to the Fed's policy rate currently expect, though pricing shifted towards a possible third rate cut this week after data showed consumer and producer prices both increased less than expected in May. While year-over-year inflation measured by the Fed's preferred Personal Consumption Expenditures Price Index is around half a percentage point above the central bank's target, recent data show it running close to 2% for the past three months once the more volatile food and energy components are excluded.

          The unemployment rate, meanwhile, has remained at 4.2% for the past three months.

          'BECOMING INCREASINGLY CLEAR'

          The Fed's policy rate was set in the current 4.25%-4.50% range in December when the U.S. central bank cut it by a quarter of a percentage point in what officials at the time expected would be a steady series of reductions in borrowing costs spurred by slowing inflation. The trade policy Trump pursued after he returned to office on January 20, however, raised the risk of higher inflation and slower growth, an outcome that would put the Fed in the uncomfortable position of having to choose whether to focus on keeping inflation at its 2% target or supporting the economy and sustaining low unemployment.

          Line graph showing various measures of inflation and the Federal Reserve's policy rate of interest.

          The risk of that worst-of-both-worlds outcome has eased since the early spring, when Trump's "Liberation Day" slate of global tariffs caused a market backlash and led to widespread forecasts of a U.S. recession before the president backed down.

          In its most recent analysis, Goldman Sachs analysts lowered the odds of a recession to around 30% and said they now see a bit less inflation and slightly higher growth this year.

          Yet that analysis did not prompt a shift in the investment bank's Fed rate outlook, which currently expects higher inflation numbers over the summer to sideline the central bank until December.

          The Fed itself may see its median rate projection fall to a single quarter-percentage-point cut this year if only due to the passage of time, noted Tim Duy, chief U.S. economist at SGH Macro Advisors.

          With three fewer months in the year to make changes in policy and so many major issues outstanding, "if the Fed retained two cuts ... it would have more confidence in those two cuts than in March," Duy wrote. "But ... participants have less confidence in rate cuts since 'Liberation Day,' and that should be reflected" in the new projections.

          It would only take two officials to change their outlooks for the Fed's projected rate reductions to shift more toward next year.

          There's another scenario, one in which the weak pass-through from tariffs to inflation is due to weakening demand as consumers pay more for imported goods by cutting back on services, a dynamic that may already be developing.

          The retail sales report for May, which is due to be released next week ahead of the Fed meeting, may provide insight into that issue. But Citi economists say they think weakening demand will keep inflation down, lead to rising unemployment, and prompt the central bank to cut rates faster than expected, beginning in September and continuing at each meeting from there into 2026.

          "Tariffs may eventually boost some goods prices, but the broad-based slowing in core services inflation will make this a one-time price increase," the Citi analysts wrote. "Markets have yet to internalize that softer demand will lead to cooler inflation but also to rising unemployment ... The path to Fed rate cuts is becoming increasingly clear."

          Source: Reuters

          To stay updated on all economic events of today, please check out our Economic calendar
          Risk Warnings and Disclaimers
          You understand and acknowledge that there is a high degree of risk involved in trading. Following any strategies or investment methods may lead to potential losses. The content on the site is provided by our contributors and analysts for information purposes only. You are solely responsible for determining whether any trading assets, securities, strategy, or any other product is suitable for investing based on your own investment objectives and financial situation.
          Add to Favorites
          Share

          3 Income Stocks Delivering Yields up to 13% Without Complex Strategies

          Adam

          Economic

          Stocks

          Let’s invest like private equity pros without needing seven figures. Yes, that’s right—PE-style starting for as little as $8.
          Plus, it yields up to nearly 13%.
          No special access or options trades needed. Just a few clicks through our brokerage accounts buying regular ol’ tickers.
          The sneaky dividend-dishing subjects? Meet business development companies (BDCs), publicly traded firms that lend to small businesses.
          BDCs were invented by Congress years ago to create a new type of lender for small businesses. They were also given the same mandate as real estate investment trusts (REITs): Return at least 90% of taxable income back to shareholders in the form of dividends.
          And man, do they pay or what?
          Let’s dive into three compelling BDCs that not only dish out big dividends but also trade for less than the sum of their parts.
          BlackRock TCP Capital Corp
          Dividend Yield: 12.9%
          BlackRock TCP Capital Corp. (TCPC) (NASDAQ:TCPC) is a middle-market lender that favors middle-market companies with enterprise values of between $100 million and $1.5 billion. It has a fairly diverse portfolio of 146 companies across several “less-cyclical” industries.
          3 Income Stocks Delivering Yields up to 13% Without Complex Strategies_1
          TCPC’s investment mix is heaviest in first-lien debt, at 83% of the portfolio; second-lien debt is another 7%, and 10% of its deals (at fair value) are in equity. The vast majority of its debt (94%) is floating-rate in nature, which is typical for many BDCs.
          That has its upsides and downsides. In a normal rising-rate environment (think 2015-19, not 2022-23), rising rates are generally good for BDCs that work heavily with floating-rate debt. The potential for declining rates (or actually declining rates)? Not so good.
          Also, as one might have guessed, TCPC has a connection to BlackRock (NYSE:BLK)—specifically, it’s externally managed by an indirect, wholly owned subsidiary of BlackRock (BLK). This connection allows it to access BlackRock’s many resources, which in theory should make it a particularly competitive BDC.
          3 Income Stocks Delivering Yields up to 13% Without Complex Strategies_2
          I warned in November 2024 that BlackRock TCPC keeping its base dividend flat for a fifth consecutive quarter raised “a little concern that TCPC’s dividend might be plateauing.” Three months later, the BDC pulled the rug out from under its investors with a drastic dividend cut. That’s despite a practice of pairing its base dividend with special dividends as profits allow.
          BlackRock TCPC’s declines have opened up a generous 13% discount to NAV. And even with the reduced 25-cent-per-share base dividend (and an already announced 4-cent special dividend for Q1), the stock still yields a sky-high 13%.
          But TCPC hasn’t exactly fixed what got it here. The dividend is more affordable, and the company’s adviser is waiving a third of its fee through Q3. But it’s still thick in non-accruals (loans that are delinquent for a prolonged period, usually 90 days), which even after improving this past quarter sit at an elevated 12.6% and 4.4% of the portfolio at cost and at fair value, respectively.
          Crescent Capital BDC
          Dividend Yield: 11.5%
          Crescent Capital BDC (CCAP) (NASDAQ:CCAP) is another BDC that’s paired with (and enjoys the resources of) a larger investment company. Crescent Capital BDC is tied to global credit investment firm Crescent Capital Group, which itself specializes in below-investment-grade credit strategies.
          CCAP currently invests in 191 portfolio companies, with a penchant for private middle market companies. It’s predominantly U.S.-focused, though it does have 9% portfolio exposure to Europe and a thin 2% exposure to Australian companies. It’s similar to TCPC in that it primarily deals in first-lien debt (91%), and the vast majority (97%) is floating-rate in nature.
          3 Income Stocks Delivering Yields up to 13% Without Complex Strategies_3
          The last time I looked at CCAP, I mentioned that it has quite the oddball dividend history:
          In March 2023, the company closed on its acquisition of First Eagle Alternative Capital (FCRD) at a hefty 66% premium … Admittedly, the deal forced CCAP to halt a run of 5-cent special dividends. Fortunately, not only have specials come back—they’ve gotten bigger. And perhaps even more telling—the company raised its regular dividend, albeit by a penny per share, for the first time in years. (It’s an odd special, too. Crescent Capital announces its special dividends after the fact; for instance, in August, it declared a Q3 base dividend of 42 cents per share, but also a 9-cent-per-share supplemental for the second quarter.)
          I’m afraid the dividend picture hasn’t become any less complicated since then.
          Crescent Capital has kept up with its 42-cent-per-share base dividend. But the action in its special dividends has changed. The variable supplemental dividends, which had been around for six quarters, disappeared at the start of this year. At the same time, CCAP announced 5-cent specials for the first, second, and third quarters—but they’re related to undistributed taxable income.
          So while it looks like CCAP’s variable supplemental has just gotten a little smaller, in reality, it’s not paying any supplementals (or, at least, it hasn’t for the past two quarters).
          3 Income Stocks Delivering Yields up to 13% Without Complex Strategies_4
          There’s a Lot Going on Here
          Those supplementals might not return for some time, either. Wall Street is increasingly worried about rate compression among BDCs, for one. CCAP itself, meanwhile, is running into increasing credit issues, a spate of new non-accruals, and the winding-down of the Logan joint venture, which was providing CCAP with some cash flows.
          At least investors are being realistic about Crescent Capital’s dimming prospects of late, driving shares down to a wild 23% discount to NAV. This normally defensively positioned BDC hardly looks like the pinnacle of health right now, but a discount that deep (plus an 11% yield on the base dividend alone) could attract some bargain hunters.
          PennantPark Floating Rate Capital (NYSE:PFLT)
          Dividend Yield: 11.8%
          I’ll start with PennantPark Floating Rate Capital (PFLT), which targets midsized companies that are “profitable, growing and cash-flowing,” with a specific focus on firms that generate $10 million to $50 million in annual earnings before interest, taxes, depreciation and amortization (EBITDA).
          Currently, PFLT’s portfolio is 190 companies wide, and those 190 companies are supported by roughly 110 private equity sponsors. And while some BDCs are happy to invest in a wide variety of companies, “value-added” BDCs that lend expertise tend to be more selective. In this case, PennantPark Floating Rate’s interests lie in five primary categories: health care, software and technology, consumer, business services and government services.
          Most important, however, is what gives PennantPark Floating Rate Capital its name. While BDCs often deal with floating-rate first-lien debt, PFLT takes it to the max: About 90% of the portfolio is first-lien debt, virtually all of which is floating-rate in nature. (The remaining 10% is split 80/20 between equity co-investments and joint venture equity.)
          As I mentioned before, the Fed’s flattening and eventual reduction in interest rates took a toll on many BDCs.
          But PennantPark Floating Rate Felt It More Than Most
          3 Income Stocks Delivering Yields up to 13% Without Complex Strategies_5
          PFLT is, in fact, pretty open about what shrinking rates mean for its bottom line:
          3 Income Stocks Delivering Yields up to 13% Without Complex Strategies_6
          PFLT trades at a 6% discount to NAV; that’s nice, but it almost feels like an optimistic valuation given the uncertainty facing the rate environment and PennantPark right now.
          On the upside, PFLT is actually a monthly dividend payer, and a generous one, too, at nearly 12%.
          On the downside, coverage of that dividend is getting awfully tight. In fiscal 2024 (its year ends in September), PFLT paid $1.23 per share on net interest income of $1.27 per share (a 97% NII payout ratio), generated from profits of $1.18 per share. It’s expected to earn $1.21 per share and $1.18 per share over the next two years, and we can reasonably expect NII to be proportional.
          That’s OK (not great) if all goes well, but a lot hinges on what the Federal Reserve does next—an open question.

          Source: investing

          To stay updated on all economic events of today, please check out our Economic calendar
          Risk Warnings and Disclaimers
          You understand and acknowledge that there is a high degree of risk involved in trading. Following any strategies or investment methods may lead to potential losses. The content on the site is provided by our contributors and analysts for information purposes only. You are solely responsible for determining whether any trading assets, securities, strategy, or any other product is suitable for investing based on your own investment objectives and financial situation.
          Add to Favorites
          Share

          Nasdaq 100 and S&P500: Oil News Lifts Energy, Defense Shares, Drags Down Travel and Tech Stocks

          Adam

          Stocks

          Oil and Defense Stocks Surge in Pre-Market as Israel Strikes Iran

          Nasdaq 100 and S&P500: Oil News Lifts Energy, Defense Shares, Drags Down Travel and Tech Stocks_1Daily E-mini S&P 500 Index

          Energy and defense shares surged in pre-market trading Friday following a wave of Israeli airstrikes on Iran, sparking fears of wider conflict in the Persian Gulf and driving crude prices sharply higher. The attack, confirmed to have occurred without U.S. support, injected fresh geopolitical risk into global markets, pushing traders toward safe havens and away from travel and consumer stocks.
          Futures tied to the Dow Jones Industrial Average fell over 460 points. S&P 500 and Nasdaq 100 futures dropped 0.9% and 1.1%, respectively. Brent crude jumped 7.7% to $74.65, and WTI spiked 8% to $73.52. Gold rose more than 1%, and the U.S. dollar advanced on haven demand.

          How Are Oil Stocks Reacting Before the Bell?

          Nasdaq 100 and S&P500: Oil News Lifts Energy, Defense Shares, Drags Down Travel and Tech Stocks_2Daily Chevron Corp.

          Energy stocks were among the top early movers. Chevron rose nearly 3%, ConocoPhillips advanced over 4%, and EOG Resources gained more than 3%. The spike in crude comes as traders weigh the risk of supply disruptions in the Gulf. OPEC+’s recent production boost may soften the blow, but risk premiums have returned to the oil market, boosting interest in upstream producers.

          Which Defense Stocks Are Leading the Pre-Market Gains?

          Nasdaq 100 and S&P500: Oil News Lifts Energy, Defense Shares, Drags Down Travel and Tech Stocks_3Daily Northrop Grumman Corp.

          Defense names climbed on expectations of heightened military activity and increased global defense spending. Northrop Grumman and RTX rallied more than 4% each, Lockheed Martin added 3.5%, and L3Harris Technologies rose 2.2%. The strike marks the most significant Israeli military action against Iran in decades, increasing the likelihood of prolonged regional instability.

          Why Are Travel Stocks Sliding?

          Nasdaq 100 and S&P500: Oil News Lifts Energy, Defense Shares, Drags Down Travel and Tech Stocks_4Daily United Airlines Holdings Inc

          Travel and leisure stocks were broadly lower. United Airlines dropped more than 5%, while Delta, American, and Southwest Airlines lost between 2% and 4%. Cruise operators like Carnival and Royal Caribbean fell over 3%, and hotel groups including Hilton and Marriott slipped more than 2%. Concerns center on higher fuel costs and potential disruptions to international travel should tensions escalate further.

          What Are Traders Watching Heading Into the Open?

          The pre-market futures trade suggests a sharp risk-off tone at the open. Traders are focused on potential Iranian retaliation and further price movement in crude. Energy and defense sectors could continue leading if volatility persists.
          This morning’s preliminary University of Michigan consumer sentiment data will also be closely watched to assess how consumers are responding to inflation and geopolitical headlines.

          Source: fxempire

          Risk Warnings and Disclaimers
          You understand and acknowledge that there is a high degree of risk involved in trading. Following any strategies or investment methods may lead to potential losses. The content on the site is provided by our contributors and analysts for information purposes only. You are solely responsible for determining whether any trading assets, securities, strategy, or any other product is suitable for investing based on your own investment objectives and financial situation.
          Add to Favorites
          Share

          Goldman Sachs Revises Oil Outlook Amid Middle East Tensions

          Glendon

          Commodity

          Goldman Sachs has updated its oil price forecast to include a higher geopolitical risk premium following Israel’s attack on Iran, while maintaining its view that Middle East oil supply will not face disruptions.

          The U.S. bank continues to project Brent crude prices will drop to $59 per barrel and West Texas Intermediate (WTI) to $55 per barrel in the fourth quarter of 2024. Looking further ahead, Goldman Sachs forecasts Brent at $56 per barrel and WTI at $52 per barrel in 2026.

          Goldman Sachs analysts noted that "the potential of further escalation in the Middle East implies that the short-term risks to our price forecast are now skewed to the upside on net."

          The bank’s forecast is based on expectations of robust supply growth outside of U.S. shale production. While acknowledging increased short-term upside risks due to Middle East tensions, Goldman Sachs still sees medium-term downside risks stemming from potential OPEC+ supply increases and ongoing uncertainty in global trade conditions.

          Source: Investing

          Risk Warnings and Disclaimers
          You understand and acknowledge that there is a high degree of risk involved in trading. Following any strategies or investment methods may lead to potential losses. The content on the site is provided by our contributors and analysts for information purposes only. You are solely responsible for determining whether any trading assets, securities, strategy, or any other product is suitable for investing based on your own investment objectives and financial situation.
          Add to Favorites
          Share

          Tussle For A Gold Mine May Shake Western Investors

          Jason

          Economic

          Commodity

          A court in Bamako is due to decide if Mali’s military government can take over operations at Barrick’s Loulo-Gounkoto complex. The hearing is set for Monday after being postponed five times — likely a reflection of the sensitivities of the case and its wider implications.

          While the junta running the West African nation has aggressively renegotiated revenue-sharing terms with all major mines, it’s only the Canadian company that’s on the verge of losing control of its asset — at least temporarily.

          The government escalated its standoff with Barrick last month, asking a judge to appoint an interim administrator to manage the site that produced 723,000 ounces of gold in 2024. It wants to restart operations at the mine that were suspended in January following the Malian authorities’ move to block bullion exports.

          A key question is whether the government wants to seize Loulo-Gounkoto or is trying to force Barrick into a settlement.

          For its part, the Toronto-based firm — which has initiated international arbitration proceedings against Mali — says it’s already agreed several accords, only for the government to backtrack.

          The high-stakes brinkmanship over such a significant asset is being monitored closely in neighboring nations, where rulers are devising plans to generate better returns from their minerals.

          Burkina Faso (also run by the military) has nationalized some smaller mines and junta-led Guinea has revoked a slew of permits. Ivory Coast is revising legislation governing the sector, while Senegal is reviewing oil and gas contracts.

          Meanwhile, the mine that last year was the No. 2 contributor in Barrick’s portfolio — spanning from Nevada to Papua New Guinea — is stranded at a time of record gold prices.

          Its travails may be a warning to Western firms mulling investment in the coup-prone region.

          Key stories and opinion:Barrick Says Mali’s Bid to Take Over Gold Mine Lacks Legal Basis Guinea Takes Endeavour Gold Permits in Latest Round of Removals Barrick CEO Vows to Defend Rights as Mali Junta Seeks More Money Mali Junta Leader Gets Backing to Serve as President Until 2030What’s Driving the Coups Across Sub-Saharan Africa?: QuickTake

          China plans to remove tariffs on imports from almost all African countries to further cement close relations with the continent as it deals with the fallout of US President Donald Trump’s trade wars. The 53 African nations that have diplomatic ties with China — Eswatini has allied with Taiwan — will be accorded “zero-tariff treatment for 100% tariff lines,” according to a letter issued to foreign ministers. South Africa sees scope to ease its dispute with Washington over agricultural trade tariffs and regulations.

          The International Monetary Fund is seeking more clarity on a $7 billion fiscal hole discovered under Senegal’s previous administration before it can discuss a fresh program with the new government. The Washington-based lender is awaiting a final audit outcome following an earlier review that found former President Macky Sall’s administration misreported debt and budget-deficit data. Separately, the IMF wants to see the ZiG “fully becoming a national currency” as it weighs whether to place Zimbabwe on a staff-monitored program.

          East African finance chiefs increased planned spending to a record to sustain economic growth and mitigate the effects of geopolitical risks and cuts in foreign aid. Kenya, Rwanda, Tanzania and Uganda plan to boost expenditure by a combined $5.5 billion in the 12 months through June 2026 compared with the year before, despite rising debt payments and limited room to lift taxes. Kenyan police used teargas to disperse protesters in the capital, Nairobi, ahead of Treasury Secretary John Mbadi’s speech. Also, columnist Justice Malala looks at how democracy is dimming in the region.

          A World Bank-linked climate fund has backed South African plans to cut its reliance on coal, unlocking up to $2.6 billion in financing and giving its energy transition an unexpected boost. The decision rescues support that looked to be in peril after the government asked in September to alter an agreement originally endorsed in 2022, and after the US halted other projects. Meanwhile, diplomats in Washington working to repair frayed relations with Trump are confronting an additional headache: South Africa’s embassy was inundated by storm water and raw sewage, leaving it partially inoperable.

          In one of Mali’s oldest towns, poverty and climate change are eroding the resolve of residents to safeguard a slice of the planet’s architectural heritage. Djenné’s iconic mud buildings were designated a World Heritage Site in 1988, meaning they can’t be destroyed or modified. But in recent years, extreme rains have made the buildings harder to maintain, while political turmoil and safety fears have diminished the town’s appeal to tourists. Some local people say the UNESCO designation is a burden they’re struggling to bear.

          African students are increasingly applying to MBA programs in the US. But the Trump administration’s anti-international-student stance could soon put a stop to this. In 2019, African students averaged just 4% of total international applications to two-year MBA programs in America and by last year the share ballooned to 27%. Nearly a quarter of programs report that the largest source of foreign applicants came from either Nigeria or Ghana.

          Source: Bloomberg Europe

          To stay updated on all economic events of today, please check out our Economic calendar
          Risk Warnings and Disclaimers
          You understand and acknowledge that there is a high degree of risk involved in trading. Following any strategies or investment methods may lead to potential losses. The content on the site is provided by our contributors and analysts for information purposes only. You are solely responsible for determining whether any trading assets, securities, strategy, or any other product is suitable for investing based on your own investment objectives and financial situation.
          Add to Favorites
          Share
          FastBull
          Copyright © 2025 FastBull Ltd

          728 RM B 7/F GEE LOK IND BLDG NO 34 HUNG TO RD KWUN TONG KLN HONG KONG

          TelegramInstagramTwitterfacebooklinkedin
          App Store Google Play Google Play
          Products
          Charts

          Chats

          Q&A with Experts
          Screeners
          Economic Calendar
          Data
          Tools
          Membership
          Features
          Function
          Markets
          Copy Trading
          Latest Signals
          Contests
          News
          Analysis
          24/7
          Columns
          Education
          Company
          Careers
          About Us
          Contact Us
          Advertising
          Help Center
          Feedback
          User Agreement
          Privacy Policy
          Business

          White Label

          Data API

          Web Plug-ins

          Poster Maker

          Affiliate Program

          Risk Disclosure

          The risk of loss in trading financial instruments such as stocks, FX, commodities, futures, bonds, ETFs and crypto can be substantial. You may sustain a total loss of the funds that you deposit with your broker. Therefore, you should carefully consider whether such trading is suitable for you in light of your circumstances and financial resources.

          No decision to invest should be made without thoroughly conducting due diligence by yourself or consulting with your financial advisors. Our web content might not suit you since we don't know your financial conditions and investment needs. Our financial information might have latency or contain inaccuracy, so you should be fully responsible for any of your trading and investment decisions. The company will not be responsible for your capital loss.

          Without getting permission from the website, you are not allowed to copy the website's graphics, texts, or trademarks. Intellectual property rights in the content or data incorporated into this website belong to its providers and exchange merchants.

          Not Logged In

          Log in to access more features

          FastBull Membership

          Not yet

          Purchase

          Become a signal provider
          Help Center
          Customer Service
          Dark Mode
          Price Up/Down Colors

          Log In

          Sign Up

          Position
          Layout
          Fullscreen
          Default to Chart
          The chart page opens by default when you visit fastbull.com