• Trade
  • Markets
  • Copy
  • Contests
  • News
  • 24/7
  • Calendar
  • Q&A
  • Chats
Trending
Screeners
SYMBOL
LAST
BID
ASK
HIGH
LOW
NET CHG.
%CHG.
SPREAD
SPX
S&P 500 Index
6857.13
6857.13
6857.13
6865.94
6827.13
+7.41
+ 0.11%
--
DJI
Dow Jones Industrial Average
47850.93
47850.93
47850.93
48049.72
47692.96
-31.96
-0.07%
--
IXIC
NASDAQ Composite Index
23505.13
23505.13
23505.13
23528.53
23372.33
+51.04
+ 0.22%
--
USDX
US Dollar Index
98.750
98.830
98.750
98.980
98.750
-0.230
-0.23%
--
EURUSD
Euro / US Dollar
1.16688
1.16696
1.16688
1.16692
1.16408
+0.00243
+ 0.21%
--
GBPUSD
Pound Sterling / US Dollar
1.33598
1.33606
1.33598
1.33601
1.33165
+0.00327
+ 0.25%
--
XAUUSD
Gold / US Dollar
4227.46
4227.80
4227.46
4230.62
4194.54
+20.29
+ 0.48%
--
WTI
Light Sweet Crude Oil
59.400
59.437
59.400
59.469
59.187
+0.017
+ 0.03%
--

Community Accounts

Signal Accounts
--
Profit Accounts
--
Loss Accounts
--
View More

Become a signal provider

Sell trading signals to earn additional income

View More

Guide to Copy Trading

Get started with ease and confidence

View More

Signal Accounts for Members

All Signal Accounts

Best Return
  • Best Return
  • Best P/L
  • Best MDD
Past 1W
  • Past 1W
  • Past 1M
  • Past 1Y

All Contests

  • All
  • Trump Updates
  • Recommend
  • Stocks
  • Cryptocurrencies
  • Central Banks
  • Featured News
Top News Only
Share

Equinor: Preliminary Estimates Indicate Reservoirs May Contain Between 5 -18 Million Standard Cubic Meters Of Recoverable Oil Equivalents

Share

Japan Chief Cabinet Secretary Kihara: Government To Take Appropriate Steps On Excessive And Disorderly Moves In Foreign Exchange Market, If Necessary

Share

[Report: Amazon Pays €180 Million To Italy To End Tax And Labor Investigations] Amazon Has Paid A Settlement And Dismantled Its Monitoring System For Delivery Drivers In Italy, Ending An Investigation Into Alleged Tax Fraud And Illegal Labor Practices. In July 2024, The Group's Logistics Services Division Was Accused Of Circumventing Labor And Tax Laws By Relying On Cooperatives Or Limited Liability Companies To Supply Workers, Evading VAT, And Reducing Social Security Payments. Sources Say The Group Has Now Paid Approximately €180 Million To Italian Tax Authorities As Part Of A €1 Billion Settlement Involving 33 Companies

Share

Airbus - Booked 797 Gross Aircraft Orders In January-November

Share

[Market Update] Spot Gold Broke Through $4,230 Per Ounce, Up 0.51% On The Day

Share

Reserve Bank Of India Chief Malhotra: There Will Be Ample Liquidity As Long As We Are In An Easing Cycle

Share

Reserve Bank Of India Chief Malhotra: Quantum Of System Liquidity Will Be Managed To Ensure Monetary Transmission Is Happening

Share

China's Foreign Ministry: World Bank, IMF, WTO Top Officials To Join

Share

China's Foreign Ministry: China To Hold 1+1 Dialogue With International Economic Orgs On Dec 9

Share

Reserve Bank Of India Chief Malhotra: 5% Of Inr Depreciation Leads To 35 Bps Of Inflation

Share

Eurostoxx 50 Futures Up 0.14%, DAX Futures Up 0.12%, CAC 40 Futures Up 0.26%, FTSE Futures Up 0.03%

Share

Getlink - Over 1 Million Trucks Crossed Channel Since January 2025

Share

Malaysia International Reserves At $124.1 Billion On November 28 Versus$124.1 Billion On November 14 - Central Bank

Share

Reserve Bank Of India Chief Malhotra: Conscious Effort On Diversifying Gold Reserves

Share

Russian President Putin Thanks Indian Prime Minister Modi For Attention To Ukraine Peace Efforts

Share

Russian President Putin: India-Russia Relations Should Grow And Touch New Heights

Share

Russian President Putin: India Is Not Neutral, India Is On The Side Of Peace

Share

Russian President Putin: We Support Every Effort Towards Peace

Share

Russian President Putin: The World Should Return To Peace

Share

India Prime Minister Modi: We Should All Pursue Peace Together

TIME
ACT
FCST
PREV
Euro Zone IHS Markit Construction PMI (Nov)

A:--

F: --

P: --

Italy IHS Markit Construction PMI (Nov)

A:--

F: --

P: --

U.K. Markit/CIPS Construction PMI (Nov)

A:--

F: --

P: --

France 10-Year OAT Auction Avg. Yield

A:--

F: --

P: --

Euro Zone Retail Sales MoM (Oct)

A:--

F: --

P: --

Euro Zone Retail Sales YoY (Oct)

A:--

F: --

P: --

Brazil GDP YoY (Q3)

A:--

F: --

P: --

U.S. Challenger Job Cuts (Nov)

A:--

F: --

P: --

U.S. Challenger Job Cuts MoM (Nov)

A:--

F: --

P: --

U.S. Challenger Job Cuts YoY (Nov)

A:--

F: --

P: --

U.S. Initial Jobless Claims 4-Week Avg. (SA)

A:--

F: --

P: --

U.S. Weekly Initial Jobless Claims (SA)

A:--

F: --

P: --

U.S. Weekly Continued Jobless Claims (SA)

A:--

F: --

P: --

Canada Ivey PMI (SA) (Nov)

A:--

F: --

P: --

Canada Ivey PMI (Not SA) (Nov)

A:--

F: --

P: --

U.S. Non-Defense Capital Durable Goods Orders Revised MoM (Excl. Aircraft) (SA) (Sept)

A:--

F: --

P: --
U.S. Factory Orders MoM (Excl. Transport) (Sept)

A:--

F: --

P: --

U.S. Factory Orders MoM (Sept)

A:--

F: --

P: --

U.S. Factory Orders MoM (Excl. Defense) (Sept)

A:--

F: --

P: --

U.S. EIA Weekly Natural Gas Stocks Change

A:--

F: --

P: --

Saudi Arabia Crude Oil Production

A:--

F: --

P: --

U.S. Weekly Treasuries Held by Foreign Central Banks

A:--

F: --

P: --

Japan Foreign Exchange Reserves (Nov)

A:--

F: --

P: --

India Repo Rate

A:--

F: --

P: --

India Benchmark Interest Rate

A:--

F: --

P: --

India Reverse Repo Rate

A:--

F: --

P: --

India Cash Reserve Ratio

A:--

F: --

P: --

Japan Leading Indicators Prelim (Oct)

A:--

F: --

P: --

U.K. Halifax House Price Index YoY (SA) (Nov)

A:--

F: --

P: --

U.K. Halifax House Price Index MoM (SA) (Nov)

A:--

F: --

P: --

France Current Account (Not SA) (Oct)

--

F: --

P: --

France Trade Balance (SA) (Oct)

--

F: --

P: --

France Industrial Output MoM (SA) (Oct)

--

F: --

P: --

Italy Retail Sales MoM (SA) (Oct)

--

F: --

P: --

Euro Zone Employment YoY (SA) (Q3)

--

F: --

P: --

Euro Zone GDP Final YoY (Q3)

--

F: --

P: --

Euro Zone GDP Final QoQ (Q3)

--

F: --

P: --

Euro Zone Employment Final QoQ (SA) (Q3)

--

F: --

P: --

Euro Zone Employment Final (SA) (Q3)

--

F: --

P: --
Brazil PPI MoM (Oct)

--

F: --

P: --

Mexico Consumer Confidence Index (Nov)

--

F: --

P: --

Canada Unemployment Rate (SA) (Nov)

--

F: --

P: --

Canada Labor Force Participation Rate (SA) (Nov)

--

F: --

P: --

Canada Employment (SA) (Nov)

--

F: --

P: --

Canada Part-Time Employment (SA) (Nov)

--

F: --

P: --

Canada Full-time Employment (SA) (Nov)

--

F: --

P: --

U.S. Personal Income MoM (Sept)

--

F: --

P: --

U.S. Dallas Fed PCE Price Index YoY (Sept)

--

F: --

P: --

U.S. PCE Price Index YoY (SA) (Sept)

--

F: --

P: --

U.S. PCE Price Index MoM (Sept)

--

F: --

P: --

U.S. Personal Outlays MoM (SA) (Sept)

--

F: --

P: --

U.S. Core PCE Price Index MoM (Sept)

--

F: --

P: --

U.S. UMich 5-Year-Ahead Inflation Expectations Prelim YoY (Dec)

--

F: --

P: --

U.S. Core PCE Price Index YoY (Sept)

--

F: --

P: --

U.S. Real Personal Consumption Expenditures MoM (Sept)

--

F: --

P: --

U.S. 5-10 Year-Ahead Inflation Expectations (Dec)

--

F: --

P: --

U.S. UMich Current Economic Conditions Index Prelim (Dec)

--

F: --

P: --

U.S. UMich Consumer Sentiment Index Prelim (Dec)

--

F: --

P: --

U.S. UMich 1-Year-Ahead Inflation Expectations Prelim (Dec)

--

F: --

P: --

U.S. UMich Consumer Expectations Index Prelim (Dec)

--

F: --

P: --

Q&A with Experts
    • All
    • Chatrooms
    • Groups
    • Friends
    Connecting
    .
    .
    .
    Type here...
    Add Symbol or Code

      No matching data

      All
      Trump Updates
      Recommend
      Stocks
      Cryptocurrencies
      Central Banks
      Featured News
      • All
      • Russia-Ukraine Conflict
      • Middle East Flashpoint
      • All
      • Russia-Ukraine Conflict
      • Middle East Flashpoint
      Search
      Products

      Charts Free Forever

      Chats Q&A with Experts
      Screeners Economic Calendar Data Tools
      Membership Features
      Data Warehouse Market Trends Institutional Data Policy Rates Macro

      Market Trends

      Market Sentiment Order Book Forex Correlations

      Top Indicators

      Charts Free Forever
      Markets

      News

      News Analysis 24/7 Columns Education
      From Institutions From Analysts
      Topics Columnists

      Latest Views

      Latest Views

      Trending Topics

      Top Columnists

      Latest Update

      Signals

      Copy Rankings Latest Signals Become a signal provider AI Rating
      Contests
      Brokers

      Overview Brokers Assessment Rankings Regulators News Claims
      Broker listing Forex Brokers Comparison Tool Live Spread Comparison Scam
      Q&A Complaint Scam Alert Videos Tips to Detect Scam
      More

      Business
      Events
      Careers About Us Advertising Help Center

      White Label

      Data API

      Web Plug-ins

      Affiliate Program

      Awards Institution Evaluation IB Seminar Salon Event Exhibition
      Vietnam Thailand Singapore Dubai
      Fans Party Investment Sharing Session
      FastBull Summit BrokersView Expo
      Recent Searches
        Top Searches
          Markets
          News
          Analysis
          User
          24/7
          Economic Calendar
          Education
          Data
          • Names
          • Latest
          • Prev

          View All

          No data

          Scan to Download

          Faster Charts, Chat Faster!

          Download App
          English
          • English
          • Español
          • العربية
          • Bahasa Indonesia
          • Bahasa Melayu
          • Tiếng Việt
          • ภาษาไทย
          • Français
          • Italiano
          • Türkçe
          • Русский язык
          • 简中
          • 繁中
          Open Account
          Search
          Products
          Charts Free Forever
          Markets
          News
          Signals

          Copy Rankings Latest Signals Become a signal provider AI Rating
          Contests
          Brokers

          Overview Brokers Assessment Rankings Regulators News Claims
          Broker listing Forex Brokers Comparison Tool Live Spread Comparison Scam
          Q&A Complaint Scam Alert Videos Tips to Detect Scam
          More

          Business
          Events
          Careers About Us Advertising Help Center

          White Label

          Data API

          Web Plug-ins

          Affiliate Program

          Awards Institution Evaluation IB Seminar Salon Event Exhibition
          Vietnam Thailand Singapore Dubai
          Fans Party Investment Sharing Session
          FastBull Summit BrokersView Expo

          The Market Holds Its Breath: One Report Can Change The Fate Of USDJPY

          Winkelmann

          Forex

          Technical Analysis

          Summary:

          Positive US fundamental data may trigger a rally in USDJPY towards 157.50. 

          Positive US fundamental data may trigger a rally in USDJPY towards 157.50.

          USDJPY forecast: key trading points

          · Japan's services PMI in Japan: previously at 53.1, currently at 53.2
          · US services PMI: previously at 54.8, currently at 55.0
          · ADP US nonfarm employment change: previously at 42 thousand, currently at 7 thousand
          · USDJPY forecast for 3 December 2025: 154.85 and 157.50

          Fundamental analysis

          The forecast for 3 December 2025 considers that the USDJPY pair continues its correction, trading near 155.80.

          Japan's services PMI covers multiple industries, including transport and communications, financial intermediation, business and household services, information technologies, hospitality, and food services.

          The USDJPY forecast for today appears moderately optimistic for the Japanese yen, with the PMI up to 53.2 from 53.1 previously. At the moment, the PMI is above the 50.0 threshold, which may add support to the yen.

          The US services PMI is also expected to rise to 55.0 from the previous 54.8. In this case, the increase in momentum may be slightly stronger, but it is still only a forecast. The actual figure may differ significantly, adding either support or pressure to the USD.

          According to the forecast for 3 December 2025, ADP nonfarm employment change in the US may fall to 7 thousand, but this is only a projection. Last month, the number of employed grew more strongly than expected. The USDJPY forecast for today takes into account that a stronger-than-expected reading could support the US dollar and push the USDJPY rate higher towards 157.50.

          USDJPY technical analysis

          On the H4 chart, the USDJPY pair has formed an Engulfing reversal pattern near the upper Bollinger Band and is currently trading around 155.80. At this stage, it may continue an upward wave following the pattern's signal, with a potential upside target at 157.50.

          At the same time, the USDJPY forecast also considers an alternative scenario, where the price corrects towards 154.85 before rising.

          Summary

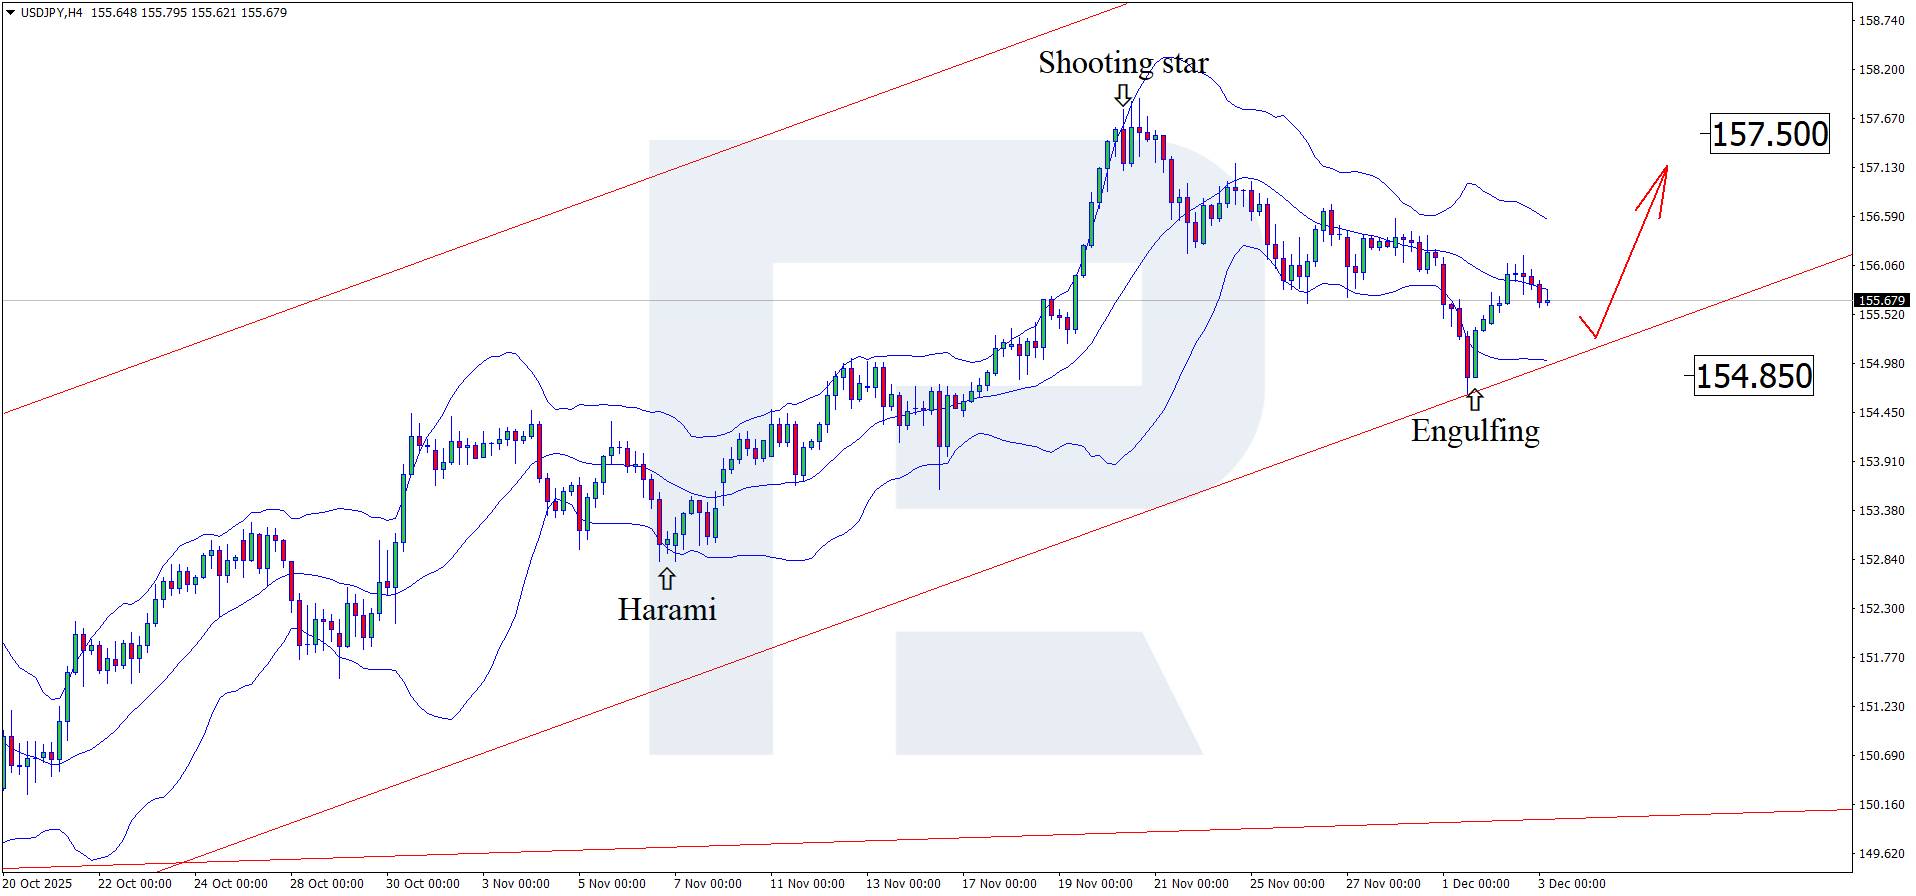
          Stronger US economic indicators may support the USD. The USDJPY technical analysis suggests a rise towards 157.50 after a correction.

          EURUSD 2026-2027 forecast: key market trends and future predictions

          This article provides the EURUSD forecast for 2026 and 2027 and highlights the main factors determining the direction of the pair's movements. We will apply technical analysis, take into account the opinions of leading experts, large banks, and financial institutions, and study AI-based forecasts. This comprehensive insight into EURUSD predictions should help investors and traders make informed decisions.

          Source: RoboForex

          Risk Warnings and Disclaimers
          You understand and acknowledge that there is a high degree of risk involved in trading. Following any strategies or investment methods may lead to potential losses. The content on the site is provided by our contributors and analysts for information purposes only. You are solely responsible for determining whether any trading assets, securities, strategy, or any other product is suitable for investing based on your own investment objectives and financial situation.
          Add to Favorites
          Share

          France’s Services Sector Returns To Growth In November, PMI Shows

          Glendon

          Forex

          Economic

          France's dominant services sector expanded slightly more than first estimated in November, hitting a 15-month high as new business gained momentum in the euro zone's second-biggest economy, a survey showed on Wednesday.

          The HCOB France final purchasing managers index (PMI) for the services sector, compiled by S&P Global, stood at 51.4 - up from 48.0 in October - marking the first time the figure has topped the 50 threshold separating growth from contraction since August 2024.

          November's flash services PMI was at 50.8.

          The composite PMI, which includes both manufacturing and services, also entered positive territory, climbing to 50.4 in November from 47.7 in October and versus a flash estimate of 49.9.

          However, manufacturing output continued to decline, widening the gap between the two sectors.

          "Finally, some positive news. For the first time in over a year, output in France's private sector has increased. However, manufacturing remains a drag on overall performance, posting its steepest fall in nine months," said Jonas Feldhusen, junior economist at Hamburg Commercial Bank.

          While the services sector's rebound is encouraging, Feldhusen cautioned that it remains to be seen whether this is the start of a sustained recovery or a temporary uptick.

          Business expectations improved but remained cautious, with firms hopeful for a more stable policy environment to boost household consumption and business investment.

          And, despite this positive development, the survey highlighted ongoing challenges.

          Employment in the services sector fell slightly, reversing a robust hiring trend from the previous three months. Competitive pressures also limited companies' ability to raise prices, with output prices remaining largely unchanged despite rising input costs.

          Source: Investing

          To stay updated on all economic events of today, please check out our Economic calendar
          Risk Warnings and Disclaimers
          You understand and acknowledge that there is a high degree of risk involved in trading. Following any strategies or investment methods may lead to potential losses. The content on the site is provided by our contributors and analysts for information purposes only. You are solely responsible for determining whether any trading assets, securities, strategy, or any other product is suitable for investing based on your own investment objectives and financial situation.
          Add to Favorites
          Share

          French Business Activity Rises For First Time In Over A Year

          Daniel Carter

          Economic

          S&P Global's Composite Purchasing Managers' Index rose to 50.4 in November from 47.7 the previous month -- surpassing the 50 mark separating expansion from contraction for the first time since Paris hosted the Olympics in the summer of 2024. A preliminary reading had put that gauge at 49.9.
          "The improvement in services is encouraging, yet it remains to be seen whether this is just a one-off uptick or the start of a sustained recovery," Jonas Feldhusen, an economist at Hamburg Commercial Bank, said in a statement. "However, manufacturing remains a drag on overall performance, posting its steepest fall in nine months and widening the gap between the two sectors."
          France's economy is showing signs of weathering a political storm that's brought repeated government collapse over the last year and doubts about how any administration can rein in a runaway budget deficit.
          Despite the private sector's struggles, gross domestic product rose 0.5% in the third quarter, beating economist expectations and coming in more than double the pace notched by the 20-nation euro area. Trade and investment were key drivers, despite signs of rising uncertainty among businesses leaders.
          "Our economy is resisting rather well, or at least better than we might have feared," Bank of France Governor Francois Villeroy de Galhau said last week.
          Still, the central bank estimates political volatility is costing the country 0.2 percentage point of growth. Consumer spending rose only slightly in the third quarter after a contraction in the previous period, while surveys show households' inclination to save is at record highs.
          PMIs are closely watched by markets as they arrive early in the month and are good at revealing trends and turning points in an economy. A measure of breadth of changes in output rather than depth, business surveys can sometimes be difficult to map directly to quarterly GDP.

          Source: Bloomberg Europe

          To stay updated on all economic events of today, please check out our Economic calendar
          Risk Warnings and Disclaimers
          You understand and acknowledge that there is a high degree of risk involved in trading. Following any strategies or investment methods may lead to potential losses. The content on the site is provided by our contributors and analysts for information purposes only. You are solely responsible for determining whether any trading assets, securities, strategy, or any other product is suitable for investing based on your own investment objectives and financial situation.
          Add to Favorites
          Share

          China Resumes Iranian Oil Purchases as Teapots Tap New Import Quotas

          Gerik

          Economic

          Commodity

          Quota Allocation Revives Iranian Oil Flow

          Independent oil refiners in China commonly referred to as “teapots” have accelerated their intake of Iranian crude in early December following a fresh round of import quotas issued by Beijing. The refiners, concentrated in Shandong province, began tapping into crude stocks stored in bonded tanks and aboard anchored ships, much of which was purchased in advance of the quota expansion.
          These refiners operate under a strict quota regime that limits how much oil they can import. Having exhausted previous allocations earlier in the fourth quarter, many teapots had temporarily curtailed purchases, particularly of sanctioned crudes from Iran and Russia. The new quota release, reportedly ranging between seven to eight million tons for about 20 refiners, has revitalized activity at key ports such as Rizhao.

          Discounted Iranian Crude Gains Traction

          Iranian oil is regaining traction due to its steep price discounts. Cargoes of Iran Light crude were reportedly offered at $8–$9 per barrel below ICE Brent benchmarks this week a sharp drop from the $4 discounts seen in August. This aggressive pricing reflects both a need for Tehran to maintain market share under sanctions and reduced competition from Russian barrels as Western restrictions tighten.
          The wide discount is a direct causal factor enabling China’s teapots to buy Iranian oil despite weak processing margins. These refiners have limited access to more expensive global supply, and with domestic demand remaining soft, only deeply discounted imports offer viable economic returns.

          Storage Overflow at Sea Raises Global Risk Signals

          Recent data from Kpler reveals that Iranian crude held in floating storage surged past 54 million barrels the highest since mid-2023. Much of this oil awaits Chinese buyers, with China now acting as Iran’s primary outlet amid restricted global access.
          Two supertankers that had been idling off China including the Panama-flagged Ill Gap carrying around 2 million barrels discharged at separate Chinese ports this week, illustrating how quotas directly affect the release of offshore inventories.
          Vortexa analyst Emma Li noted that demand from teapots may still remain subdued through year-end, constrained by weak refining margins. This mismatch means that while import quotas now exist, much of the sanctioned oil may continue accumulating at sea unless downstream economics improve.

          Structural Policy Gaps Create Volatility

          China’s approach to managing import quotas reflects a structural vulnerability in its energy procurement system. Although refiners now receive full-year quotas upfront to improve planning, stricter tax regimes on alternate feedstocks like fuel oil caused many to burn through allocations early in the year. Consequently, refiners entered Q4 with limited capacity to import, creating periodic bottlenecks and disrupting market flows.
          This inconsistency between quota timing and market dynamics creates irregular surges in oil procurement a boom-bust pattern that influences global oil prices and tanker availability. While the newly issued quotas relieve short-term pressure, the underlying volatility in China’s quota management remains a source of market friction.

          Geopolitical Implications and Strategic Outlook

          China’s growing reliance on discounted Iranian crude sanctioned and avoided by most Western buyers underscores its willingness to sidestep geopolitical pressures to secure cost-effective energy. As new U.S. sanctions target Russian oil majors, Iranian barrels become more attractive to China’s private refiners, further deepening Beijing’s energy ties with geopolitically isolated suppliers.
          This strategy enhances China’s energy security but risks reputational exposure and entanglement in sanction regimes, especially if future restrictions widen to include intermediaries or shipping partners.
          In the longer term, China’s appetite for Iranian oil, facilitated by quota flexibility and opportunistic pricing, is likely to remain robust especially as global energy markets face tighter supplies and elevated prices.
          The recent surge in Iranian crude deliveries to China illustrates how supply chain bottlenecks, quota policy, and geopolitical opportunism intersect in global energy markets. By taking advantage of quota adjustments and favorable pricing, Chinese teapots are reshaping sanctioned oil flows sustaining Tehran’s export revenues and reinforcing Beijing’s influence in the shadow energy economy. As the year closes, the interaction between regulatory control, market fundamentals, and foreign policy will continue to define the trajectory of China’s oil strategy.

          Source: Reuters

          To stay updated on all economic events of today, please check out our Economic calendar
          Risk Warnings and Disclaimers
          You understand and acknowledge that there is a high degree of risk involved in trading. Following any strategies or investment methods may lead to potential losses. The content on the site is provided by our contributors and analysts for information purposes only. You are solely responsible for determining whether any trading assets, securities, strategy, or any other product is suitable for investing based on your own investment objectives and financial situation.
          Add to Favorites
          Share

          China Resumes Iranian Oil Purchases as Teapots Tap New Import Quotas

          Gerik

          Economic

          Quota Allocation Revives Iranian Oil Flow

          Independent oil refiners in China commonly referred to as “teapots” have accelerated their intake of Iranian crude in early December following a fresh round of import quotas issued by Beijing. The refiners, concentrated in Shandong province, began tapping into crude stocks stored in bonded tanks and aboard anchored ships, much of which was purchased in advance of the quota expansion.
          These refiners operate under a strict quota regime that limits how much oil they can import. Having exhausted previous allocations earlier in the fourth quarter, many teapots had temporarily curtailed purchases, particularly of sanctioned crudes from Iran and Russia. The new quota release, reportedly ranging between seven to eight million tons for about 20 refiners, has revitalized activity at key ports such as Rizhao.

          Discounted Iranian Crude Gains Traction

          Iranian oil is regaining traction due to its steep price discounts. Cargoes of Iran Light crude were reportedly offered at $8–$9 per barrel below ICE Brent benchmarks this week a sharp drop from the $4 discounts seen in August. This aggressive pricing reflects both a need for Tehran to maintain market share under sanctions and reduced competition from Russian barrels as Western restrictions tighten.
          The wide discount is a direct causal factor enabling China’s teapots to buy Iranian oil despite weak processing margins. These refiners have limited access to more expensive global supply, and with domestic demand remaining soft, only deeply discounted imports offer viable economic returns.

          Storage Overflow at Sea Raises Global Risk Signals

          Recent data from Kpler reveals that Iranian crude held in floating storage surged past 54 million barrels the highest since mid-2023. Much of this oil awaits Chinese buyers, with China now acting as Iran’s primary outlet amid restricted global access.
          Two supertankers that had been idling off China including the Panama-flagged Ill Gap carrying around 2 million barrels discharged at separate Chinese ports this week, illustrating how quotas directly affect the release of offshore inventories.
          Vortexa analyst Emma Li noted that demand from teapots may still remain subdued through year-end, constrained by weak refining margins. This mismatch means that while import quotas now exist, much of the sanctioned oil may continue accumulating at sea unless downstream economics improve.

          Structural Policy Gaps Create Volatility

          China’s approach to managing import quotas reflects a structural vulnerability in its energy procurement system. Although refiners now receive full-year quotas upfront to improve planning, stricter tax regimes on alternate feedstocks like fuel oil caused many to burn through allocations early in the year. Consequently, refiners entered Q4 with limited capacity to import, creating periodic bottlenecks and disrupting market flows.
          This inconsistency between quota timing and market dynamics creates irregular surges in oil procurement a boom-bust pattern that influences global oil prices and tanker availability. While the newly issued quotas relieve short-term pressure, the underlying volatility in China’s quota management remains a source of market friction.

          Geopolitical Implications and Strategic Outlook

          China’s growing reliance on discounted Iranian crude sanctioned and avoided by most Western buyers underscores its willingness to sidestep geopolitical pressures to secure cost-effective energy. As new U.S. sanctions target Russian oil majors, Iranian barrels become more attractive to China’s private refiners, further deepening Beijing’s energy ties with geopolitically isolated suppliers.
          This strategy enhances China’s energy security but risks reputational exposure and entanglement in sanction regimes, especially if future restrictions widen to include intermediaries or shipping partners.
          In the longer term, China’s appetite for Iranian oil, facilitated by quota flexibility and opportunistic pricing, is likely to remain robust especially as global energy markets face tighter supplies and elevated prices.
          The recent surge in Iranian crude deliveries to China illustrates how supply chain bottlenecks, quota policy, and geopolitical opportunism intersect in global energy markets. By taking advantage of quota adjustments and favorable pricing, Chinese teapots are reshaping sanctioned oil flows sustaining Tehran’s export revenues and reinforcing Beijing’s influence in the shadow energy economy. As the year closes, the interaction between regulatory control, market fundamentals, and foreign policy will continue to define the trajectory of China’s oil strategy.

          Source: Reuters

          To stay updated on all economic events of today, please check out our Economic calendar
          Risk Warnings and Disclaimers
          You understand and acknowledge that there is a high degree of risk involved in trading. Following any strategies or investment methods may lead to potential losses. The content on the site is provided by our contributors and analysts for information purposes only. You are solely responsible for determining whether any trading assets, securities, strategy, or any other product is suitable for investing based on your own investment objectives and financial situation.
          Add to Favorites
          Share

          The Next Fed Chair Becoming Ever More Certain

          Samantha Luan

          Forex

          Political

          Economic

          Markets

          The Japanese-inspired core bond selloff eased yesterday. An unconvincing attempt to eke out a few more bps during European dealings was more or less killed off in the US session. Net daily changes for US Treasury yields eventually varied between -2.1 bps to +0.9 bps in technical trading. The German curve shifted similarly by shedding 1.4 bps at the front.

          Even UK yields swapped earlier gains for minor declines across the curve. We wouldn't call it a day on the underlying forces though. Japanese yields this morning are again headed north with new highs for the (ultra) long maturities including the 30-year ahead of a closely watched auction tomorrow. News in any case was scarce yesterday and that seemed to suffice for riskier assets to recover some ground.

          European and US equities inched 0.3-0.6% higher and crypto markets rebounded in a daily perspective after the violent selloff in recent weeks. The likes of Bitcoin extend gains to almost 94k, the strongest level since mid-November. The meeting between US envoy Witkoff and Russian president Putin and his entourage was called constructive by the Kremlin but no compromise was reached yet.

          Sticking to event risks, French politics reared its head again with local newspaper Le Figaro reporting that Horizons won't back premier Lecornu's social security budget bill in the upcoming vote December 9. Being part of the coalition government, Horizons' lack of support is a reminder of how fragile and perhaps deceiving the current French calm is. OATs underperformed compared to European peers.

          The euro ignores the matter for now. After an uninspiring session yesterday, EUR/USD is gently trending north this morning towards first resistance around 1.165-1.167 (short term highs). The trade-weighted dollar index depreciates back to the 99 area. The economic agenda has things in store that could spice up the session today. ECB president Lagarde appears before parliament. The ADP job report and services ISM are to further shape Fed expectations for December.

          A rate cut is priced for 95% now. At this stage it would take blow-out numbers to flip the balance again by December 10. The next Fed chair meanwhile is becoming ever more certain. Hassett emerges as the frontrunner and favours a growth-supporting policy – perhaps the most compared to the other contestants. President Trump will officially announce Powell's successor early 2026.

          Barring renewed risk aversion for whatever reason (France, public finances, equity valuation … ) we'd expect the dollar to remain on the backfoot. Were EUR/USD to take out the recent highs, the 1.1728 October top – 1.1747 61.2% recovery on the Sep-Nov decline emerges as the next reference. EUR/GBP's three-day win streak ran into resistance around 0.88. We hold our negative bias for sterling though and assume EUR/GBP's fundamental level to be 0.90+.

          News & Views

          Australian GDP growth slowed from an upwardly revised 0.7% Q/Q in in Q2 to 0.4% in Q3 (vs +0.7% consensus), the average quarterly growth pace since the end of the COVID-19 pandemic. Annual growth ticked up from 2% to 2.1%. Details showed final consumption rising by 0.6% Q/Q with both household (+0.5%) and government (+0.8%) spending contributing to growth. The household saving ratio rose from 6% in Q2 to 6.4% in Q3 with gross disposable income (+1.7%) rising faster than nominal household spending (+1.4%).

          Total gross fixed capital formation rose a strong 3% Q/Q mainly due to a rebound in public investments (+3% Q/Q after -3.5% Q/Q in Q2). Net trade detracted 0.1 ppt from GDP growth, with imports up 1.5%, and exports up 1%. Today's numbers strengthen market belief that the next move by the Reserve Bank of Australia will a rate hike next year. AUD/USD builds on its recent comeback, eyeing first resistance around 0.66. The Aussie yield curve bear flattens this morning with yields rising by 5.8 bps (2-yr) to 3.2 bps (30-yr).

          The EU agreed to gradually prohibit Russian LNG gas import by the end of 2026, one year faster than originally planned. Russia is still the second-largest LNG-provider (15% of total) to Europe after the US. The deadline now matches with the ban of seaborne deliveries which is already part of EU sanctions against Russia.

          The EU's RePowerEU plan also targets halting to pipeline gas imports under long-term deals by the end of Q3 2027. The commission also plans to put forward a legislative proposal on phasing out Russian oil imports no later than the end of 2027.

          Source: KBC Bank

          To stay updated on all economic events of today, please check out our Economic calendar
          Risk Warnings and Disclaimers
          You understand and acknowledge that there is a high degree of risk involved in trading. Following any strategies or investment methods may lead to potential losses. The content on the site is provided by our contributors and analysts for information purposes only. You are solely responsible for determining whether any trading assets, securities, strategy, or any other product is suitable for investing based on your own investment objectives and financial situation.
          Add to Favorites
          Share

          Putin’s India Visit Highlights Energy, Defense Deals Amid Global Tensions and U.S. Tariff Pressures

          Gerik

          Economic

          Summit of Strategic Realignment in a Multipolar World

          President Vladimir Putin’s upcoming summit with Prime Minister Narendra Modi marks a pivotal moment for India-Russia ties. As the Ukraine war drags on, New Delhi is once again tasked with navigating a delicate diplomatic tightrope maintaining its historically strong relationship with Moscow while under growing pressure from Washington to distance itself from the Kremlin.
          Putin's visit, scheduled for early December, follows a series of high-level exchanges between the two nations and comes amid intensified global scrutiny of India's ongoing oil imports from Russia, which Washington argues are helping finance the war. India, however, continues to defend its position by citing energy security for its 1.4 billion citizens.

          Energy Cooperation Remains the Strategic Centerpiece

          Russia has emerged as one of India's largest oil suppliers in the post-Ukraine war period, as Moscow offers steep discounts to maintain export revenues. Despite U.S. sanctions and tariff hikes including President Donald Trump’s imposition of a 50% tariff on Indian goods India has sustained its oil imports, emphasizing that it avoids sanctioned Russian entities like Rosneft and Lukoil.
          Energy will feature prominently in the summit, especially in areas such as nuclear collaboration. India’s Kudankulam Nuclear Power Plant, built with Russian assistance, remains the core of bilateral energy cooperation. The two sides are also expected to discuss localization of nuclear equipment manufacturing and expansion into third-country projects.
          India is further exploring long-term fertilizer supply deals and mechanisms for trade settlement that bypass Western-dominated financial channels. Moscow’s role in helping secure India’s energy independence remains a cornerstone of bilateral engagement, and both sides are determined to expand this axis despite external pressures.

          Defense Ties Stay Strong Despite Delays and Diversification

          Defense remains a pillar of the India-Russia strategic partnership. India has received three of five S-400 air defense systems under a $5.4 billion deal signed in 2018 and is now pushing for timely delivery of the remaining two squadrons. Talks may also explore acquiring additional S-400 units or a next-generation variant.
          Discussions are also expected to address upgrades to India's Su-30MKI fighter fleet and other Russian-origin platforms. Although India has diversified its military procurement in recent years, Russia remains its largest defense supplier. Moscow is eager to promote its Su-57 stealth fighter, but New Delhi continues to explore competitive alternatives.
          While no major defense contracts are expected during this visit, both sides are seeking to maintain momentum in joint exercises, logistics cooperation, and technological transfer agreements all areas that could help insulate defense ties from external geopolitical turbulence.

          Trade and Migration in Focus for Economic Expansion

          Beyond defense and energy, the summit aims to rejuvenate broader economic cooperation. Indian officials are preparing agreements on trade facilitation, healthcare, maritime logistics, and media exchange. India wants to increase exports of pharmaceuticals, textiles, and agricultural goods to Russia, and is pressing Moscow to ease non-tariff barriers.
          Another emerging area is labor mobility. Discussions are underway to formalize regulated migration of Indian skilled workers to Russia, a move that would address labor shortages in Russia and generate remittances for India.
          A comprehensive trade settlement framework possibly leveraging local currencies or alternative payment systems may also be on the agenda, as both nations seek to reduce dependency on the U.S. dollar amidst tightening financial sanctions.

          Behind-the-Scenes Diplomacy on Ukraine and Global Optics

          While India has avoided taking an overt mediating role in the Ukraine conflict, Modi may use the summit to quietly urge Putin toward accommodating Ukrainian and European concerns. With Trump’s revised peace plan being circulated and geopolitical alliances shifting, India is under pressure to clarify its stance.
          Yet Modi’s approach remains cautious and pragmatic. Experts suggest that New Delhi’s “strategic hedging” enables it to pursue national interests without overtly alienating any major power. Behind-the-scenes diplomacy is likely, but India is unlikely to publicly adopt a mediator role that could compromise its carefully balanced positioning.

          A Test of Strategic Autonomy

          Putin’s visit to India is more than a bilateral engagement; it is a stress test for India’s foreign policy doctrine of strategic autonomy. Amid escalating U.S.-Russia tensions, expanding sanctions, and a volatile energy landscape, New Delhi must assert its sovereignty in shaping partnerships based on national interest, not external coercion.
          If successful, the summit will reaffirm India’s role as a pivotal balancing power in the evolving multipolar order one that can engage Washington, Moscow, and Beijing on its own terms while advancing its domestic priorities across defense, energy, and trade.

          Source: Bloomberg

          To stay updated on all economic events of today, please check out our Economic calendar
          Risk Warnings and Disclaimers
          You understand and acknowledge that there is a high degree of risk involved in trading. Following any strategies or investment methods may lead to potential losses. The content on the site is provided by our contributors and analysts for information purposes only. You are solely responsible for determining whether any trading assets, securities, strategy, or any other product is suitable for investing based on your own investment objectives and financial situation.
          Add to Favorites
          Share
          FastBull
          Copyright © 2025 FastBull Ltd

          728 RM B 7/F GEE LOK IND BLDG NO 34 HUNG TO RD KWUN TONG KLN HONG KONG

          TelegramInstagramTwitterfacebooklinkedin
          App Store Google Play Google Play
          Products
          Charts

          Chats

          Q&A with Experts
          Screeners
          Economic Calendar
          Data
          Tools
          Membership
          Features
          Function
          Markets
          Copy Trading
          Latest Signals
          Contests
          News
          Analysis
          24/7
          Columns
          Education
          Company
          Careers
          About Us
          Contact Us
          Advertising
          Help Center
          Feedback
          User Agreement
          Privacy Policy
          Business

          White Label

          Data API

          Web Plug-ins

          Poster Maker

          Affiliate Program

          Risk Disclosure

          The risk of loss in trading financial instruments such as stocks, FX, commodities, futures, bonds, ETFs and crypto can be substantial. You may sustain a total loss of the funds that you deposit with your broker. Therefore, you should carefully consider whether such trading is suitable for you in light of your circumstances and financial resources.

          No decision to invest should be made without thoroughly conducting due diligence by yourself or consulting with your financial advisors. Our web content might not suit you since we don't know your financial conditions and investment needs. Our financial information might have latency or contain inaccuracy, so you should be fully responsible for any of your trading and investment decisions. The company will not be responsible for your capital loss.

          Without getting permission from the website, you are not allowed to copy the website's graphics, texts, or trademarks. Intellectual property rights in the content or data incorporated into this website belong to its providers and exchange merchants.

          Not Logged In

          Log in to access more features

          FastBull Membership

          Not yet

          Purchase

          Become a signal provider
          Help Center
          Customer Service
          Dark Mode
          Price Up/Down Colors

          Log In

          Sign Up

          Position
          Layout
          Fullscreen
          Default to Chart
          The chart page opens by default when you visit fastbull.com