


Markets
News
Analysis
User
24/7
Economic Calendar
Education
Data
- Names
- Latest
- Prev


The U.S. Bureau of Labor Statistics reported a 0.3% rise in the Producer Price Index for September 2025, with impacts seen across various economic sectors.
The U.S. Bureau of Labor Statistics reported a 0.3% rise in the Producer Price Index for September 2025, with impacts seen across various economic sectors.
With the Federal Reserve's upcoming meeting, these inflation figures could influence monetary policy decisions amidst ongoing economic discussions.
The September PPI increase aligns with economic forecasts, reflecting ongoing pressure from rising energy and food costs. This data plays a crucial role in shaping the Fed's assessment of inflation trends. Despite the rise, core PPI—excluding food and energy—showed a tamer increase of 2.9% year-on-year, marking a period of moderation. This could influence the Fed's balance between preventing inflation and fostering growth.
Market reactions were limited, with the S&P 500 trading flat pre-market. No significant movements were observed in cryptocurrency markets, with Bitcoin and Ethereum remaining stable. Federal Reserve officials have not commented yet, and their upcoming December meeting is poised to consider this data alongside the forthcoming PCE index for potential policy adjustments.
The Producer Price Index for final demand increased 0.3 percent in September, seasonally adjusted. Over the past 12 months, the index rose 2.7 percent.
Did you know? In 2022, similar PPI increases led to a 75-basis-point rate hike, causing Bitcoin to drop by ~20% in the following week.
Currently, Bitcoin (BTC) is priced at $87,590.66, with a market capitalization of formatNumber(1747735553640, 2). Its dominance is 57.90%, and the trading volume has decreased by 12.42% over 24 hours. BTC's 30-day price has declined by 23.66%, while its circulating supply stands at 19,953,446, as reported by CoinMarketCap.
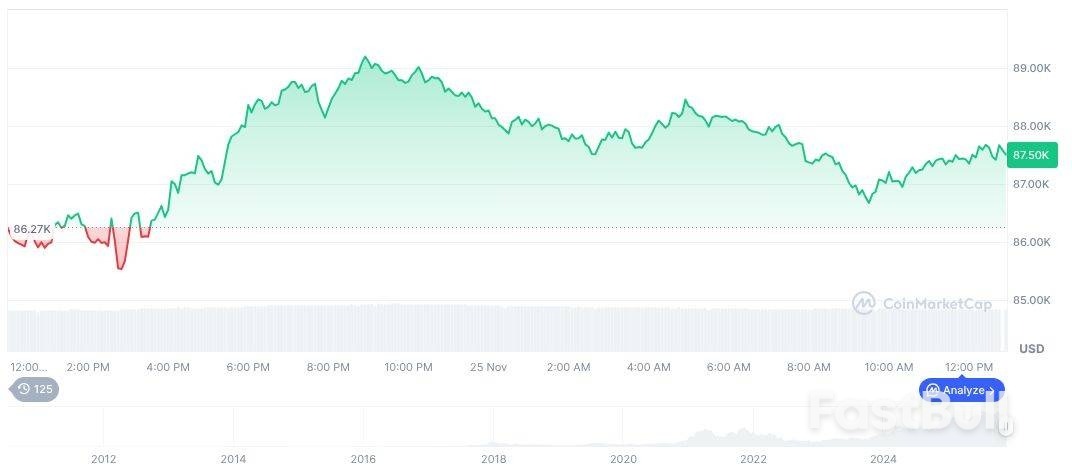 Bitcoin(BTC), daily chart, screenshot on CoinMarketCap at 00:52 UTC on November 26, 2025. Source: CoinMarketCap
The Coincu research team highlights that past inflation data often foreshadow Fed interest adjustments. While crypto markets remain steady, significant PPI changes can still trigger volatility if followed by unexpected Fed action. The sector continues to watch closely for future regulatory outcomes.
728 RM B 7/F GEE LOK IND BLDG NO 34 HUNG TO RD KWUN TONG KLN HONG KONG


The risk of loss in trading financial instruments such as stocks, FX, commodities, futures, bonds, ETFs and crypto can be substantial. You may sustain a total loss of the funds that you deposit with your broker. Therefore, you should carefully consider whether such trading is suitable for you in light of your circumstances and financial resources.
No decision to invest should be made without thoroughly conducting due diligence by yourself or consulting with your financial advisors. Our web content might not suit you since we don't know your financial conditions and investment needs. Our financial information might have latency or contain inaccuracy, so you should be fully responsible for any of your trading and investment decisions. The company will not be responsible for your capital loss.
Without getting permission from the website, you are not allowed to copy the website's graphics, texts, or trademarks. Intellectual property rights in the content or data incorporated into this website belong to its providers and exchange merchants.
Not Logged In
Log in to access more features

FastBull Membership
Not yet
Purchase


Log In
Sign Up


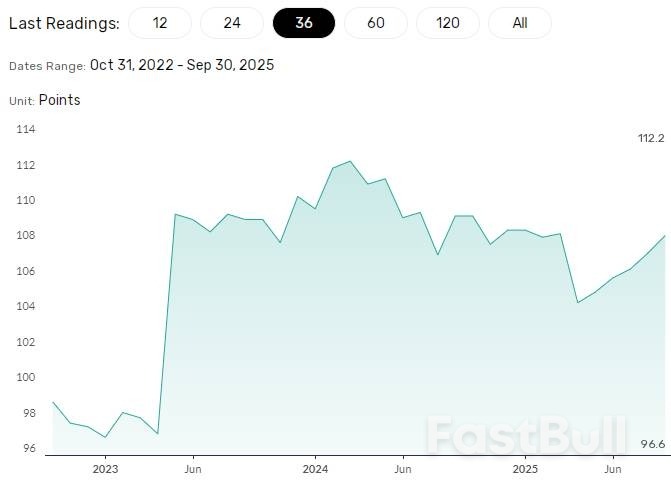 FX Empire – Japan Leading Economic Index
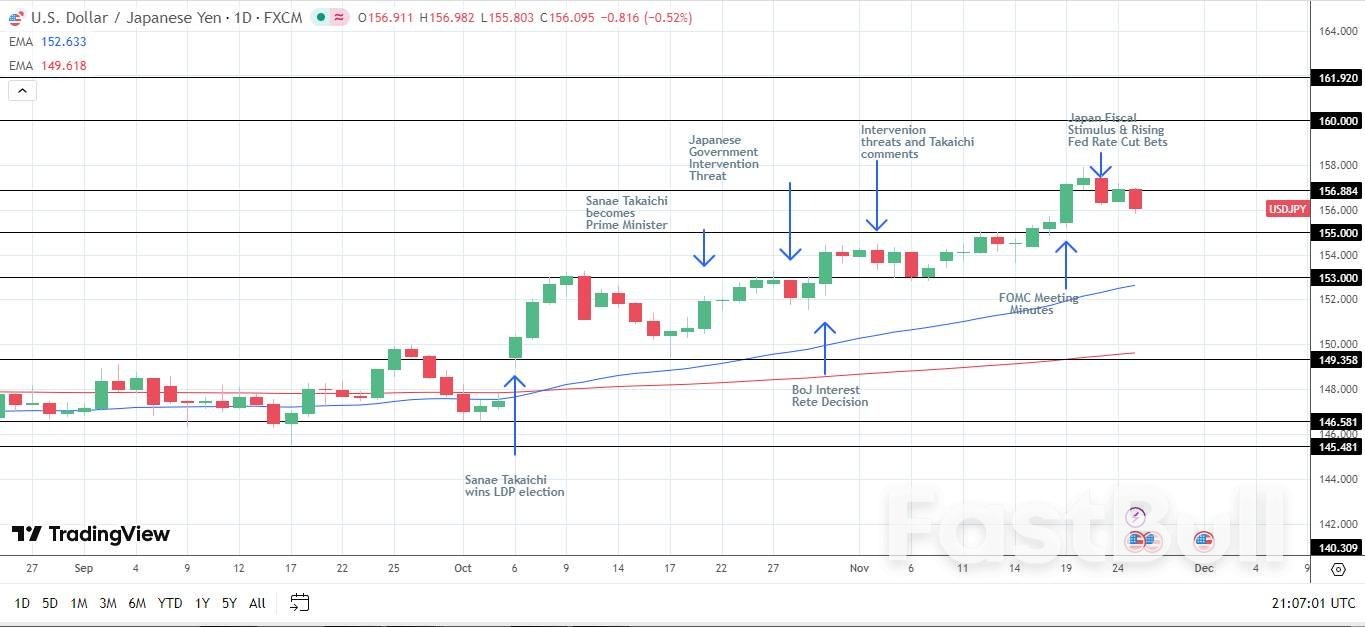 USDJPY – Daily Chart – 261125 – Fiscal Stimulus and Dovish Fed
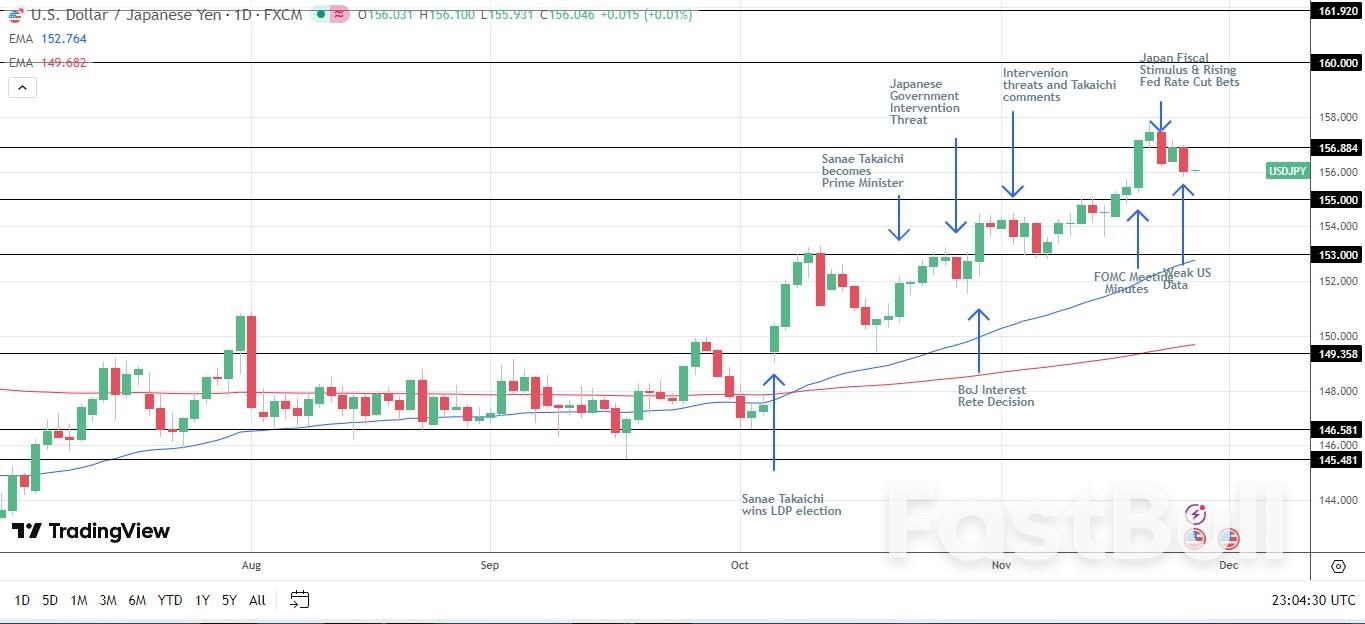 USDJPY – Daily Chart – 261125