• Trade
  • Markets
  • Copy
  • Contests
  • News
  • 24/7
  • Calendar
  • Q&A
  • Chats
Trending
Screeners
SYMBOL
LAST
BID
ASK
HIGH
LOW
NET CHG.
%CHG.
SPREAD
SPX
S&P 500 Index
6851.97
6851.97
6851.97
6861.30
6847.07
+24.56
+ 0.36%
--
DJI
Dow Jones Industrial Average
48619.86
48619.86
48619.86
48679.14
48557.21
+161.82
+ 0.33%
--
IXIC
NASDAQ Composite Index
23280.59
23280.59
23280.59
23345.56
23265.18
+85.43
+ 0.37%
--
USDX
US Dollar Index
97.830
97.910
97.830
98.070
97.810
-0.120
-0.12%
--
EURUSD
Euro / US Dollar
1.17556
1.17563
1.17556
1.17596
1.17262
+0.00162
+ 0.14%
--
GBPUSD
Pound Sterling / US Dollar
1.33951
1.33959
1.33951
1.33970
1.33546
+0.00244
+ 0.18%
--
XAUUSD
Gold / US Dollar
4333.57
4333.98
4333.57
4350.16
4294.68
+34.18
+ 0.79%
--
WTI
Light Sweet Crude Oil
56.897
56.927
56.897
57.601
56.789
-0.336
-0.59%
--

Community Accounts

Signal Accounts
--
Profit Accounts
--
Loss Accounts
--
View More

Become a signal provider

Sell trading signals to earn additional income

View More

Guide to Copy Trading

Get started with ease and confidence

View More

Signal Accounts for Members

All Signal Accounts

Best Return
  • Best Return
  • Best P/L
  • Best MDD
Past 1W
  • Past 1W
  • Past 1M
  • Past 1Y

All Contests

  • All
  • Trump Updates
  • Recommend
  • Stocks
  • Cryptocurrencies
  • Central Banks
  • Featured News
Top News Only
Share

The Nasdaq Golden Dragon China Index Fell 0.9% In Early Trading

Share

The S&P 500 Opened 32.78 Points Higher, Or 0.48%, At 6860.19; The Dow Jones Industrial Average Opened 136.31 Points Higher, Or 0.28%, At 48594.36; And The Nasdaq Composite Opened 134.87 Points Higher, Or 0.58%, At 23330.04

Share

Miran: Goods Inflation Could Be Settling In At A Higher Level Than Was Normal Before The Pandemic, But That Will Be More Than Offset By Housing Disinflation

Share

Miran, Who Dissented In Favor Of A Larger Cut At Last Fed Meeting, Repeats Keeping Policy Too Tight Will Lead To Job Losses

Share

Miran: Does Not Think Higher Goods Inflation Is Mostly From Tariffs, But Acknowledges Does Not Have A Full Explanation For It

Share

Toronto Stock Index .GSPTSE Rises 67.16 Points, Or 0.21 Percent, To 31594.55 At Open

Share

Miran: Excluding Housing And Non-Market Based Items, Core Pce Inflation May Be Below 2.3%, “Within Noise” Of The Fed's 2% Target

Share

Polish State Assets Minister Balczun Says Jsw Needs Over USD 830 Million Financing To Keep Liquidity For A Year

Share

Miran: Prices Are “Once Again Stable” And Monetary Policy Should Reflect That

Share

Fed's Miran: Current Excess Inflation Is Not Reflective Of Underlying Supply And Demand In The Economy

Share

Portugal Treasury Puts 2026 Net Financing Needs At 13 Billion Euros, Up From 10.8 Billion In 2025

Share

Portugal Treasury Expects 2026 Net Financing Needs At 29.4 Billion Euros, Up From 25.8 Billion In 2025

Share

Bank Of America Says With Indonesia's Smelter Now Ramping Up, It Expects Aluminium Supply Growth To Accelerate To 2.6% Year On Year In 2026

Share

Bank Of America Expects A Deficit In Aluminium Next Year And Sees Prices Pushing Above $3000/T

Share

Fed Data - USA Effective Federal Funds Rate At 3.64 Percent On 12 December On $102 Billion In Trades Versus 3.64 Percent On $99 Billion On 11 December

Share

Brazil's Petrobras Says No Impact Seen On Oil, Petroleum Products Output As Workers Start Planned Strike

Share

Statement: US Travel Group Warns New Proposed Trump Administration Requirements For Foreign Tourists To Provide Social Media Histories Could Mean Millions Of People Opting Not To Visit

Share

Blackrock: Kerry White Will Become Head Of Citi Investment Management At Citi Wealth

Share

Blackrock: Rob Jasminski, Head Of Citi Investment Management, Has Joined With Team

Share

Blackrock: Effective Dec 15, Citi Investment Management Employees Will Join Blackrock

TIME
ACT
FCST
PREV
Japan Tankan Small Manufacturing Outlook Index (Q4)

A:--

F: --

P: --

Japan Tankan Large Non-Manufacturing Outlook Index (Q4)

A:--

F: --

P: --

Japan Tankan Large Manufacturing Outlook Index (Q4)

A:--

F: --

P: --

Japan Tankan Small Manufacturing Diffusion Index (Q4)

A:--

F: --

P: --

Japan Tankan Large Manufacturing Diffusion Index (Q4)

A:--

F: --

P: --

Japan Tankan Large-Enterprise Capital Expenditure YoY (Q4)

A:--

F: --

P: --

U.K. Rightmove House Price Index YoY (Dec)

A:--

F: --

P: --

China, Mainland Industrial Output YoY (YTD) (Nov)

A:--

F: --

P: --

China, Mainland Urban Area Unemployment Rate (Nov)

A:--

F: --

P: --

Saudi Arabia CPI YoY (Nov)

A:--

F: --

P: --

Euro Zone Industrial Output YoY (Oct)

A:--

F: --

P: --

Euro Zone Industrial Output MoM (Oct)

A:--

F: --

P: --

Canada Existing Home Sales MoM (Nov)

A:--

F: --

P: --

Canada National Economic Confidence Index

A:--

F: --

P: --

Canada New Housing Starts (Nov)

A:--

F: --

P: --
U.S. NY Fed Manufacturing Employment Index (Dec)

A:--

F: --

P: --

U.S. NY Fed Manufacturing Index (Dec)

A:--

F: --

P: --

Canada Core CPI YoY (Nov)

A:--

F: --

P: --

Canada Manufacturing Unfilled Orders MoM (Oct)

A:--

F: --

P: --

U.S. NY Fed Manufacturing Prices Received Index (Dec)

A:--

F: --

P: --

U.S. NY Fed Manufacturing New Orders Index (Dec)

A:--

F: --

P: --

Canada Manufacturing New Orders MoM (Oct)

A:--

F: --

P: --

Canada Core CPI MoM (Nov)

A:--

F: --

P: --

Canada Trimmed CPI YoY (SA) (Nov)

A:--

F: --

P: --

Canada Manufacturing Inventory MoM (Oct)

A:--

F: --

P: --

Canada CPI YoY (Nov)

A:--

F: --

P: --

Canada CPI MoM (Nov)

A:--

F: --

P: --

Canada CPI YoY (SA) (Nov)

A:--

F: --

P: --

Canada Core CPI MoM (SA) (Nov)

A:--

F: --

P: --

Canada CPI MoM (SA) (Nov)

A:--

F: --

P: --

Federal Reserve Board Governor Milan delivered a speech
U.S. NAHB Housing Market Index (Dec)

--

F: --

P: --

Australia Composite PMI Prelim (Dec)

--

F: --

P: --

Australia Services PMI Prelim (Dec)

--

F: --

P: --

Australia Manufacturing PMI Prelim (Dec)

--

F: --

P: --

Japan Manufacturing PMI Prelim (SA) (Dec)

--

F: --

P: --

U.K. 3-Month ILO Employment Change (Oct)

--

F: --

P: --

U.K. Unemployment Claimant Count (Nov)

--

F: --

P: --

U.K. Unemployment Rate (Nov)

--

F: --

P: --

U.K. 3-Month ILO Unemployment Rate (Oct)

--

F: --

P: --

U.K. Average Weekly Earnings (3-Month Average, Including Bonuses) YoY (Oct)

--

F: --

P: --

U.K. Average Weekly Earnings (3-Month Average, Excluding Bonuses) YoY (Oct)

--

F: --

P: --

France Services PMI Prelim (Dec)

--

F: --

P: --

France Composite PMI Prelim (SA) (Dec)

--

F: --

P: --

France Manufacturing PMI Prelim (Dec)

--

F: --

P: --

Germany Services PMI Prelim (SA) (Dec)

--

F: --

P: --

Germany Manufacturing PMI Prelim (SA) (Dec)

--

F: --

P: --

Germany Composite PMI Prelim (SA) (Dec)

--

F: --

P: --

Euro Zone Composite PMI Prelim (SA) (Dec)

--

F: --

P: --

Euro Zone Services PMI Prelim (SA) (Dec)

--

F: --

P: --

Euro Zone Manufacturing PMI Prelim (SA) (Dec)

--

F: --

P: --

U.K. Services PMI Prelim (Dec)

--

F: --

P: --

U.K. Manufacturing PMI Prelim (Dec)

--

F: --

P: --

U.K. Composite PMI Prelim (Dec)

--

F: --

P: --

Euro Zone ZEW Economic Sentiment Index (Dec)

--

F: --

P: --

Germany ZEW Current Conditions Index (Dec)

--

F: --

P: --

Germany ZEW Economic Sentiment Index (Dec)

--

F: --

P: --

Euro Zone Trade Balance (Not SA) (Oct)

--

F: --

P: --

Euro Zone ZEW Current Conditions Index (Dec)

--

F: --

P: --

Euro Zone Trade Balance (SA) (Oct)

--

F: --

P: --

U.S. Retail Sales MoM (Excl. Automobile) (SA) (Oct)

--

F: --

P: --

Q&A with Experts
    • All
    • Chatrooms
    • Groups
    • Friends
    Connecting
    .
    .
    .
    Type here...
    Add Symbol or Code

      No matching data

      All
      Trump Updates
      Recommend
      Stocks
      Cryptocurrencies
      Central Banks
      Featured News
      • All
      • Russia-Ukraine Conflict
      • Middle East Flashpoint
      • All
      • Russia-Ukraine Conflict
      • Middle East Flashpoint
      Search
      Products

      Charts Free Forever

      Chats Q&A with Experts
      Screeners Economic Calendar Data Tools
      Membership Features
      Data Warehouse Market Trends Institutional Data Policy Rates Macro

      Market Trends

      Market Sentiment Order Book Forex Correlations

      Top Indicators

      Charts Free Forever
      Markets

      News

      News Analysis 24/7 Columns Education
      From Institutions From Analysts
      Topics Columnists

      Latest Views

      Latest Views

      Trending Topics

      Top Columnists

      Latest Update

      Signals

      Copy Rankings Latest Signals Become a signal provider AI Rating
      Contests
      Brokers

      Overview Brokers Assessment Rankings Regulators News Claims
      Broker listing Forex Brokers Comparison Tool Live Spread Comparison Scam
      Q&A Complaint Scam Alert Videos Tips to Detect Scam
      More

      Business
      Events
      Careers About Us Advertising Help Center

      White Label

      Data API

      Web Plug-ins

      Affiliate Program

      Awards Institution Evaluation IB Seminar Salon Event Exhibition
      Vietnam Thailand Singapore Dubai
      Fans Party Investment Sharing Session
      FastBull Summit BrokersView Expo
      Recent Searches
        Top Searches
          Markets
          News
          Analysis
          User
          24/7
          Economic Calendar
          Education
          Data
          • Names
          • Latest
          • Prev

          View All

          No data

          Scan to Download

          Faster Charts, Chat Faster!

          Download App
          English
          • English
          • Español
          • العربية
          • Bahasa Indonesia
          • Bahasa Melayu
          • Tiếng Việt
          • ภาษาไทย
          • Français
          • Italiano
          • Türkçe
          • Русский язык
          • 简中
          • 繁中
          Open Account
          Search
          Products
          Charts Free Forever
          Markets
          News
          Signals

          Copy Rankings Latest Signals Become a signal provider AI Rating
          Contests
          Brokers

          Overview Brokers Assessment Rankings Regulators News Claims
          Broker listing Forex Brokers Comparison Tool Live Spread Comparison Scam
          Q&A Complaint Scam Alert Videos Tips to Detect Scam
          More

          Business
          Events
          Careers About Us Advertising Help Center

          White Label

          Data API

          Web Plug-ins

          Affiliate Program

          Awards Institution Evaluation IB Seminar Salon Event Exhibition
          Vietnam Thailand Singapore Dubai
          Fans Party Investment Sharing Session
          FastBull Summit BrokersView Expo

          Pound under pressure ahead of US, UK inflation reports

          Adam

          Forex

          Summary:

          The British pound is slightly higher ahead of key UK and US inflation reports. UK CPI stuck at 3.4% may delay BoE cuts, while US inflation could shift Fed rate expectations.

          The British pound has edged up higher on Tuesday. In the European session, GBP/USD is trading at 1.3453, up 0.21% on the day. Earlier, GBP/USD touched a low of 1.3416, its lowest level since June 23.

          UK inflation expected at 3.4%

          All eyes will be on the UK inflation report for June, which will be released on Wednesday. Headline CPI is expected to remain unchanged at 3.4% y/y, as is core CPI at 3.5%. Monthly, both the headline rates are expected to stay steady at 0.2%.
          Has the BoE's battle to lower inflation stalled? The BoE was looking good in March, when inflation eased to 2.6%, but CPI has rebounded to 3.4%, well above the BoE's inflation target of 2%. Services data has been especially sticky, although it dropped to 4.7% in May, down from 5.4% a month earlier.
          At 3.4%, inflation is stuck at its highest level since February 2024 and that will complicate plans at the BoE to renew interest rate cuts in order to kick-start the weak UK economy. The central bank has lowered rates twice this year and would like to continue trimming the current cash rate of 4.25%. The Bank meets next on Aug. 7 and Wednesday's inflation data could be a significant factor in the rate decision.

          US CPI expected to accelerate

          In the US, if June inflation data rises as is expected, fingers will quickly point to President Trump's tariffs as finally having an impact. Recent inflation reports have not shown a significant spike higher due to the tariffs, which were first imposed in April. However, the tariffs may have needed time to filter throughout the economy and could be felt for the first time in the June inflation reading.
          The Fed meets next on July 30, with the markets pricing in a 95% chance of a hold, according to CME's FedWatch. For September, the odds of a rate cut stand at 59%. Today's inflation report could cause a shift in these numbers.

          GBPUSD Technical

          GBP/USD tested resistance at 1.3454 earlier. Above, there is resistance at 1.3484
          1.3396 and 1.3366 are the next support levels
          Pound under pressure ahead of US, UK inflation reports_1

          Source : marketpulse

          Risk Warnings and Disclaimers
          You understand and acknowledge that there is a high degree of risk involved in trading. Following any strategies or investment methods may lead to potential losses. The content on the site is provided by our contributors and analysts for information purposes only. You are solely responsible for determining whether any trading assets, securities, strategy, or any other product is suitable for investing based on your own investment objectives and financial situation.
          Add to Favorites
          Share

          Powell’s Caution On Tariff-Driven Inflation Is Right

          Jason

          Central Bank

          President Donald Trump has taken to routinely maligning Federal Reserve Chair Jerome Powell as “too late” because interest rates have been on hold at 4.25%-4.5% since he took office. On Tuesday alone, he characteristically took to social media to demand three percentage points of rate cuts — something that is never going to happen outside of a recession. Trump’s needling aside, the latest inflation data show that Powell’s wait-and-see approach is the exact right tack for today’s economic outlook.

          The Bureau of Labor Statistics said Tuesday that the core consumer price index rose 0.2% in June from a month earlier, a slightly encouraging surprise that leaves the year-over-year rate at 2.9%. But the reading remains well above the Fed’s 2% target, and the details of the report show that tariffs are starting to fan higher prices and that larger effects might start to feed through over the next couple of months.

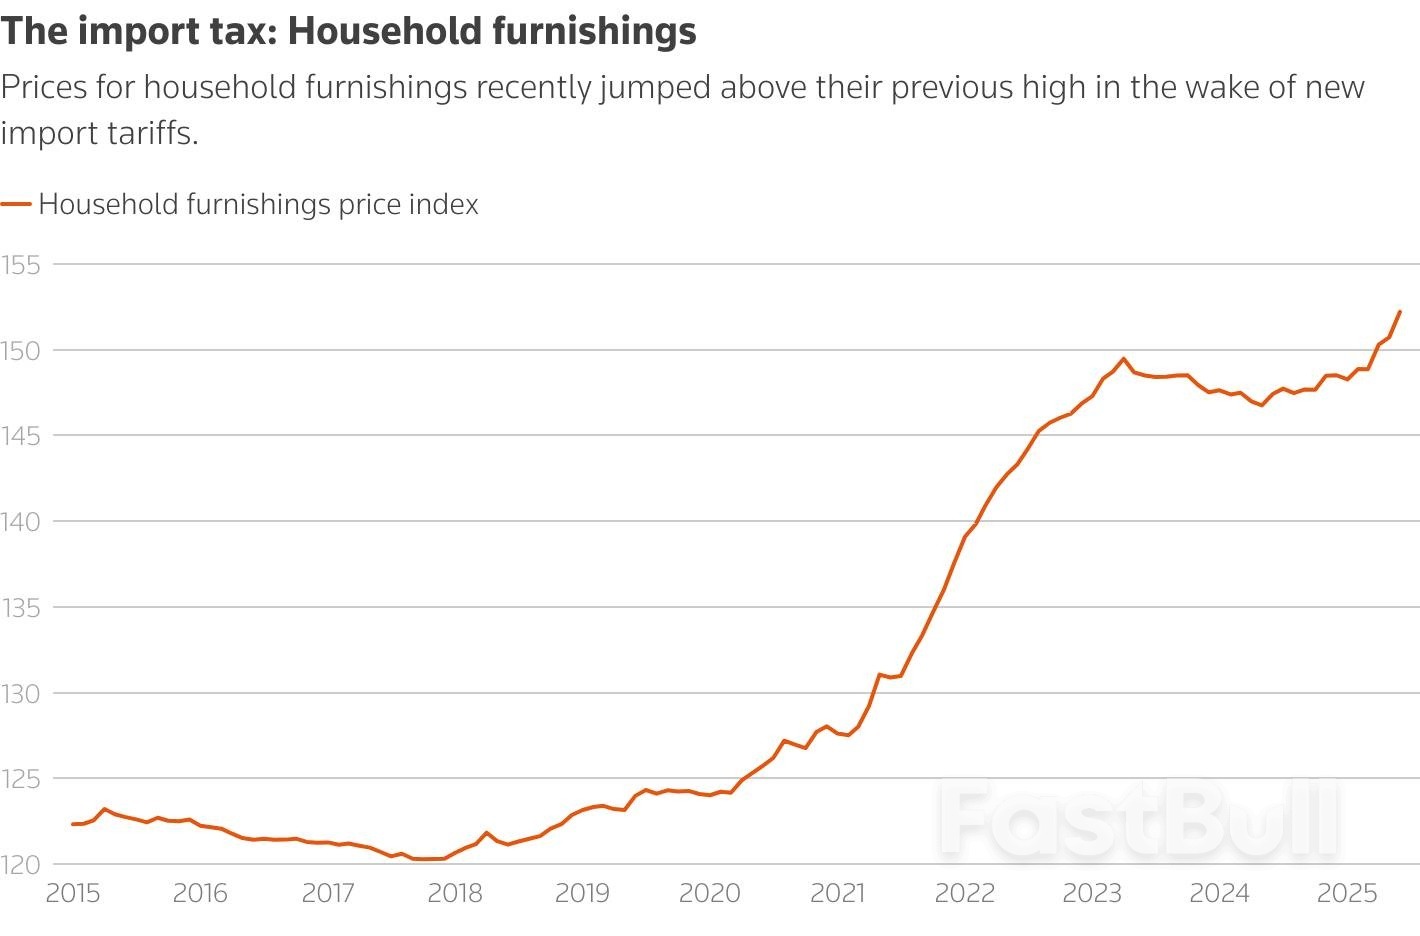
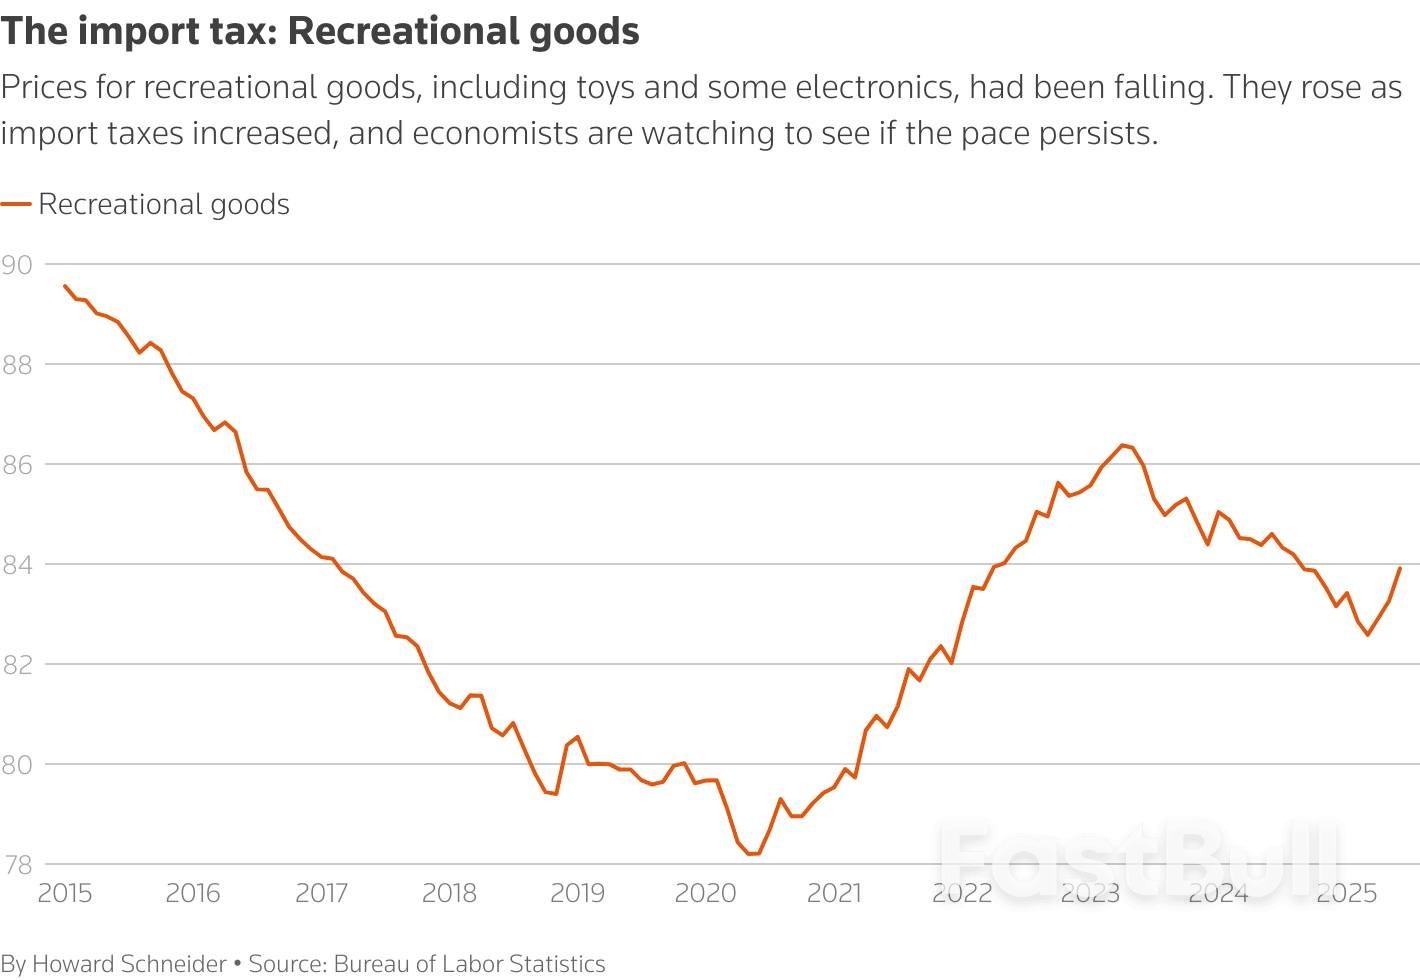
          More specifically, core goods rose 0.2% in June from a month earlier, the most brisk pace since February, driven in large part by a jump in household furnishings and supplies — a telltale sign of tariff passthrough. That category (think appliances, rugs, housekeeping supplies, etc.) jumped by 1% from the prior month, the biggest such increase since January 2022. Also notching the biggest month-on-month jump since 2022 were recreation commodities (sporting goods, toys, video equipment, etc.). Not only were tariff impacts undeniable this month, they appeared to be broadening out from what had been a very light and scattered influence in previous months’ data.

          Still, this was neither a month to panic nor celebrate. With the backdrop of a steady unemployment rate, it’s time to do as the embattled Fed chair — whom Trump has committed to replacing when his term is up next year — has been advising all along: Wait for more data.

          Among Fed policymakers and private sector economists, the general view of tariffs has been that they would hit sometime over the summer. For starters, Trump’s biggest and broadest tariff salvo didn’t come until April. Goldman Sachs Group Inc. economists estimate that it takes about a month for many imports to reach US shores, and goods were exempt if they were already on the ship at the time of the “Liberation Day” duties. What’s more, businesses stockpiled inventory in advance of the deadline and Customs and Border Protection allows many importers to delay payments for up to a month and a half. Hence, many forecasters expected June to be the start of a tariff-impact story that could become more evident in July and August.

          Powell has been broadly in that camp. At the post-decision press conference in June, he said that he expected to learn more “over the summer” about tariffs. “We hadn’t expected them to show up much by now, and they haven’t,” he said. “And we will see the extent to which they do over coming months.” In markets, his comments have been broadly interpreted to mean that further rate cuts were possible (though hardly guaranteed) as soon September, and that still feels appropriate. By that time, the committee will have additional inflation data in hand for the months of July and August.

          Unfortunately, Trump has used his social media platform to advocate for more immediate cuts, and his Council of Economic Advisers recently published an analysis that found no evidence that tariffs have caused “any economically meaningful inflation.” Inflation Insights President Omair Sharif wrote Monday that the CEA had gotten ahead of itself. “Setting aside the methodology for a moment, if the main point of the CEA’s analysis is to suggest that tariffs are not impacting inflation, then I think they’ve spiked the ball at the 50-yard line,” he said.

          It’s entirely possible, of course, that tariff impacts could spread further and that the Fed will still lower policy rates. The central bank doesn’t have to wait for inflation to return to 2% to start lowering rates again; rates are clearly at a level that the median Fed policymaker would deem restrictive. Powell and his colleagues just need to gain confidence that it remains on the right trajectory.

          Furthermore, tariffs are generally seen as a one-off increase in prices — the sort of supply shock that monetary policy orthodoxy would tell you to “look through.” The ultimate question as it pertains to trade policy is whether tariffs will shock expectations to such an extent that inflation gets back into the bones of the economy. That may depend on both the magnitude of the tariff impacts and their duration. And all of those variables depend, in turn, on whether Trump decides to temper the policies — as he’s occasionally proved willing to do, especially when financial markets react badly.

          To some extent, monetary policy will also depend on what happens with other key categories in the inflation basket. Among major imported goods, the auto sector is a big question mark. While tariffs are driving up car prices and threatening profit margins, the government data showed that prices of both new and used vehicles fell in June from May — a reminder that the duties aren’t the only consideration. Dealers are also contending with high borrowing costs and a general affordability crunch that’s weighing on demand. Many are uncertain about whether they can increase prices without hitting customer traffic and market share.

          What’s more, it’s important to remember that core services — which aren’t directly impacted by the tariffs — still constitute about three quarters of core CPI and about two thirds of inflation overall. As such, it’s plausible that services disinflation could mitigate the jumps in certain core goods prices, especially if shelter inflation remains as tame as it’s been for the better part of 2025. With all the crosscurrents, the responsible solution is for policymakers to wait for more evidence, and that’s exactly what the Fed is doing under Powell’s stewardship. No matter what the partisans around the White House say, the chairman is handling tariff uncertainty about as well as you could ask for.

          Source: Bloomberg Europe

          Risk Warnings and Disclaimers
          You understand and acknowledge that there is a high degree of risk involved in trading. Following any strategies or investment methods may lead to potential losses. The content on the site is provided by our contributors and analysts for information purposes only. You are solely responsible for determining whether any trading assets, securities, strategy, or any other product is suitable for investing based on your own investment objectives and financial situation.
          Add to Favorites
          Share

          FTSE 100 hits a record

          Adam

          Stocks

          European stocks have erased weakness from Monday and are higher, as a risk on mood takes hold ahead of key event risk on Tuesday. The FTSE 100 has passed a key milestone and is above the 9,000 level for the first time, proving how resilient the UK index has been to economic uncertainty, tariff risks and a weaker dollar. US CPI will be released later this afternoon, along with a raft of US earnings reports from top tier banks, including JP Morgan, Citigroup and Wells Fargo.

          Easing export restrictions gives Nvidia a boost

          News that the US has relaxed restrictions on exports of Nvidia’s H20 chip to China, has boosted risk sentiment this morning. This is huge news for the company and could lead to a raft of earnings upgrades for the second half of this year. It may also benefit the US semiconductor space more broadly, as hopes rise that export restrictions to China get lifted for more than just Nvidia. Although China has been circumnavigating US export controls and accessing US chip technology through third countries, in the three months to April, Nvidia reported a $4.5bn charge to its earnings statement due to increased inventory caused by blocked sales to China. Thus, this news could make a material difference to revenues for Nvidia and other US semiconductor companies. Nvidia had announced that it was working on a specific chip for the China market to get around export restrictions, however, today’s development could make life much easier for the company and be an earlier boost to revenues.

          China less likely to become a rival to US chip sector with export move

          The H20 chip is not Nvidia’s most advanced chip, however, now that the US has eased export restrictions, it opens the door to future sales of even more advanced Nvidia technology. This is a boon for the entire chip sector in the US and Europe, since it removes an existential risk: that China would develop its own chips, which could be a major rival to US semiconductor companies.

          Nvidia may cement its status as world’s most valuable company

          Nvidia’s stock price is likely to get a boost from this news, after falling at the start of the week. The stock is higher by 20% so far this year, after staging an impressive recovery since April. It also became the world’s first company with a $4 trillion valuation, and this news could see it maintain these gains, and could see its valuation get another boost as the risk of China developing its own chip and becoming a formidable rival to Nvidia may now be reduced.

          ASML gets a boost from Nvidia news

          This news is impacting the European market, as ASML is the top performing stock on the Eurostoxx 50 index, its share price is higher by more than 1.2% on Tuesday, which could be a sign of how the chip sector will perform when the US opens later today. US stock futures are higher today, and European markets are also in the green and the FTSE 100 has topped 9,000 for the first time, even though it is lagging other European indices on Tuesday.

          FTSE 100 hits record even with pockets of weakness

          The 0.8% decline in the oil price is hitting the share price of Shell, which is down 0.5% on Tuesday. The homebuilding sector is also one of the laggards on the FTSE 100 this morning after Barret Redrow’s trading update highlighted weakness in the London property market and continued red tape and planning regulations being a hindrance to growth. This is weighing heavily on Barrat Redrow, and its stock price is down more than 10% this morning, it is also weighing on Persimmon and The Berkely Group. Overall, this is another sign that the UK government’s plans to boost growth are taking longer to implement than first hoped.

          Will Rachel Reeves give certainty on tax and growth measures at Manion House?

          While the focus for global markets will be on US CPI and banking earnings, UK investors may want to focus on Chancellor Rachel Reeves’ Mansion House speech this evening. If the chancellor wants to build economic confidence over the summer, then she should send a message that gives certainty on tax and find a way to stem the wealth flight from the UK. The City will also look for assurances that there will not be any taxes levied on the banking sector, which have been touted by some in the Labour party as a way to plug the UK’s fiscal black hole. Lloyds’ share price has had a strong run this year, and is higher by 40%, a sign that if banks are tapped for tax at this Budget, then it may weigh on the sector later this year.
          Overall, stocks are higher, the FTSE 100 is at a record, bonds are higher, and yields are lower, and the dollar and other safe haven currencies are broadly lower on Tuesday. Today is a good day for risky assets, but will US CPI derail the party?

          Source: xtb

          Risk Warnings and Disclaimers
          You understand and acknowledge that there is a high degree of risk involved in trading. Following any strategies or investment methods may lead to potential losses. The content on the site is provided by our contributors and analysts for information purposes only. You are solely responsible for determining whether any trading assets, securities, strategy, or any other product is suitable for investing based on your own investment objectives and financial situation.
          Add to Favorites
          Share

          Bitcoin’s ‘Most Reliable Reversal Pattern’ Hints at BTC Price Rally Toward $160K

          Warren Takunda

          Cryptocurrency

          Key takeaways:
          Bitcoin has confirmed an inverted head-and-shoulders breakout.
          A short-term pullback toward $114K–$115K may retest former resistance as support.
          The MVRV Z-Score remains well below historical peak levels, signaling BTC’s rally still has room to run.
          Bitcoin has entered the breakout stage of what chartists call one of its “most reliable reversal patterns,” signaling an extended upside move toward $160,000.

          Bitcoin may drop toward $114,000 first

          An inverted head and shoulders (IH&S) pattern has appeared on the 3-day and weekly BTC/USD charts.
          A recent breakout above neckline resistance near $113,000 confirms the structure and opens the door for a measured move toward at least $140,000, according to chartist Merlijn the Trader.Bitcoin’s ‘Most Reliable Reversal Pattern’ Hints at BTC Price Rally Toward $160K_1

          Source: X

          Meanwhile, popular analyst Trader Tardigrade sees even more upside while presenting a similar but slightly ascended IH&S pattern on a weekly chart.
          He anticipates the BTC price to reach the reversal setup’s measured target around $160,000.Bitcoin’s ‘Most Reliable Reversal Pattern’ Hints at BTC Price Rally Toward $160K_2

          BTC/USD weekly price chart ft. inverse head and shoulders breakout scenario. Source: Trader Tardigrade/TradingView

          Bitcoin is cooling off after hitting a record high near $123,250 on Monday, slipping about 5.65% in a likely overbought correction.
          The pullback follows days of strong gains, with BTC’s daily relative strength index (RSI) recently crossing 70, signaling short-term upside exhaustion among traders.Bitcoin’s ‘Most Reliable Reversal Pattern’ Hints at BTC Price Rally Toward $160K_3

          BTC/USD daily price chart. Source: TradingView

          On-chain data also suggests profit-taking played a role. Large holders, including both long-term investors and short-term speculators, have been locking in gains, adding to the downside pressure.
          Analyst Hardy says Bitcoin may revisit the CME gap between $114,300 and $115,600 to confirm it as new support before pushing higher.Bitcoin’s ‘Most Reliable Reversal Pattern’ Hints at BTC Price Rally Toward $160K_4

          Source: Hardy

          This region nearly aligns with the neckline of the IH&S pattern.
          It is relatively common for price to return to the breakout zone—previous resistance turned support—before resuming its trend. Such behavior often helps flush out weak hands and build a stronger foundation for continuation.
          A successful bounce from the neckline zone would likely strengthen Bitcoin's rally case toward the $140,000-160,000 target by August or September.

          Bitcoin rally not overheated, MVRV Z-Score shows

          Bitcoin is trading near all-time highs, yet its MVRV Z-Score remains far below levels historically associated with market tops. That divergence suggests the current rally may still have room to run.
          The MVRV Z-Score measures how far Bitcoin’s market value deviates from its realized value, a proxy for the capital actually invested into the network.Bitcoin’s ‘Most Reliable Reversal Pattern’ Hints at BTC Price Rally Toward $160K_5

          Bitcoin MVRV-Z Score chart. Source: Glassnode

          Historically, when market value vastly exceeds realized value, the score enters the red zone, signaling overvaluation and often preceding major tops.
          This indicates that, from an onchain perspective, Bitcoin is not yet overheated and may continue climbing before entering a classic top formation, potentially hitting the IH&S’s $160,000 price target by August or September.

          Source: Cointelegraph

          Risk Warnings and Disclaimers
          You understand and acknowledge that there is a high degree of risk involved in trading. Following any strategies or investment methods may lead to potential losses. The content on the site is provided by our contributors and analysts for information purposes only. You are solely responsible for determining whether any trading assets, securities, strategy, or any other product is suitable for investing based on your own investment objectives and financial situation.
          Add to Favorites
          Share

          Stocks: Still No Signs of Weakness

          Adam

          Stocks

          The S&P 500 index closed 0.14% higher on Monday, continuing its short-term fluctuations and remaining near Thursday’s record high of 6,290.22. While it appeared the market was waiting for today’s major bank earnings and inflation data, overnight news that Nvidia would resume chip sales to China pushed futures higher toward a new all-time high.
          This morning, the S&P 500 is expected to open 0.4% higher following the release of the Consumer Price Index (CPI), which came in as expected at +0.3% month-over-month.
          Investors are now shifting their focus to the upcoming corporate earnings season, with major banks reporting this week. Wednesday and Thursday will be especially important, with ASML reporting on Wednesday, followed by TSMC and Netflix on Thursday.
          Investor sentiment remains elevated, as reflected in the last Wednesday’s AAII Investor Sentiment Survey, which reported that 41.4% of individual investors are bullish, while 35.6% are bearish.
          The S&P 500 continues to hover near last week’s record, as the daily chart shows.
          Stocks: Still No Signs of Weakness_1

          Nasdaq 100: Likely to Reach New All-Time High

          The Nasdaq 100 closed 0.33% higher on Monday and is expected to open 0.5% higher today, fueled largely by Nvidia’s 4.4% premarket surge, which pushed its market cap to a staggering $4.2 trillion.
          While no strong negative signals have emerged, recent price action could be forming a potential topping pattern.
          Stocks: Still No Signs of Weakness_2

          VIX: Short-Term Elevated

          The Volatility Index (VIX) dropped to a local low of 15.70 on Thursday, signaling continued strength in equities. Yesterday, however, the VIX rebounded to a daily high of 17.85 despite relatively calm market action.
          Historically, a dropping VIX indicates less fear in the market, and rising VIX accompanies stock market downturns. However, the lower the VIX, the higher the probability of the market’s downward reversal. Conversely, the higher the VIX, the higher the probability of the market’s upward reversal.
          Stocks: Still No Signs of Weakness_3

          S&P 500 Futures Contract: Fluctuating Around 6,300

          This morning, the S&P 500 futures contract hit a new record near 6,350 following the CPI release.
          Despite this new high, the index remains in a consolidation – potentially forming either a topping pattern or a flat correction before a possible next leg higher.
          Resistance is near 6,350, while support is around 6,300.
          Markets remain highly sensitive to geopolitical developments and could stay volatile in the near term.
          Stocks: Still No Signs of Weakness_4

          Crude Oil Update: Retreat Toward $67

          Crude oil fell 2.15% on Monday after a 2.8% gain on Friday, pulling back from the key $70 level and confirming it as strong psychological resistance. Today, price is consolidating near $67.
          For oil markets specifically, these developments are worth monitoring:
          Oil prices fell as traders reacted to President Trump’s decision to delay immediate sanctions on Russia, giving Moscow 50 days to end the war in Ukraine before enforcing penalties. Analysts believe the lack of immediate action reduced market fears of a supply shock.
          OPEC expects the global economy to perform better in the second half of 2025, citing strong momentum in countries like India, China, and Brazil. Despite geopolitical tensions, the group left its oil demand growth forecasts for 2025 and 2026 unchanged, reflecting optimism in global recovery.
          China’s Q2 GDP slightly beat expectations at 5.2%, helped by strong exports and stimulus measures. Crude imports surged over 7% year-on-year in June, driven by refineries resuming operations after maintenance.

          Oil: Extending Fluctuations

          Currently, crude oil is trading 0.2% lower, hovering near $67. Resistance is around $68, with support between $65-66.
          My short-term outlook on oil remains neutral, and no positions are currently justified from a risk/reward standpoint.
          Stocks: Still No Signs of Weakness_5

          Conclusion

          The S&P 500 is expected to open 0.4% higher, buoyed by Nvidia’s overnight announcement, bank earnings, and CPI data.
          With tariff-related news still circulating, investor focus will shift toward the start of earnings season.
          And if you’re not yet on our free mailing list, I strongly encourage you to join it – you’ll stay up-to-date with our free analyses that will still put you ahead of 99% of investors that don’t have access to this information. Join our free stock newsletter today.

          Source: fxempire

          Risk Warnings and Disclaimers
          You understand and acknowledge that there is a high degree of risk involved in trading. Following any strategies or investment methods may lead to potential losses. The content on the site is provided by our contributors and analysts for information purposes only. You are solely responsible for determining whether any trading assets, securities, strategy, or any other product is suitable for investing based on your own investment objectives and financial situation.
          Add to Favorites
          Share

          Fed's Inflation Fears Start To Be Realized With June CPI Increase

          James Whitman

          Economic

          Rising prices across an array of goods from coffee to audio equipment to home furnishings pulled inflation higher in June in what economists see as evidence of the Trump administration's increasing import taxes passing through to consumers.

          Overall consumer prices rose 0.3% in June, a roughly 3.5% annual rate, after a 0.1% increase in May.

          Economists - and Fed officials - say they were expecting inflation to gather pace this summer as the lagged impact of tariffs gets passed along by businesses, and the June data suggest central bank policymakers in particular may remain reluctant to cut interest rates until more information is at hand.

          The tariff price shock could ultimately prove a temporary, one-time adjustment. But with the final tariff levels still being considered by President Donald Trump, and steeper levies threatened as of August 1, the inflation outlook remains unsettled.

          "Today's report showed that tariffs are beginning to bite," said Omair Sharif, head of Inflation Insights, "apparel prices rose, household furnishing prices jumped...and recreation commodities increased."

          Those are heavily imported items and the increases were substantial. Prices for audio-video equipment rose 1.1% over the month and have risen 11.1% on a year over year basis, the largest jump ever in a category where globalization had generally meant steady or falling prices.

          It will likely strike a note of caution for the Fed, which has been facing almost daily criticism from Trump for not cutting interest rates, a step central bankers have been reluctant to take until it is clear where the tariffs will leave the U.S. economy.

          Fed officials see the most likely immediate outcomes as higher inflation, slower growth, or a combination of both. The Trump administration argues that over time its tariff proposals will boost economic growth and keep inflation moderate, and that rates should be lowered in the meantime.

          "With increases in categories like household furnishings, recreation, and apparel, import levies are slowly filtering through," wrote Seema Shah, Chief Global Strategist at Principal Asset Management. "It would be wise for the Fed to remain on the sidelines for a few more months at least.”

          Investors still expect the Fed in September to cut a quarter of a percentage point from the current 4.25% to 4.5% benchmark interest rate maintained since December, but odds of a cut at the upcoming July 29-30 meeting are now below 5%.

          Powell had earlier pinpointed this summer as the time when the U.S. central bank will learn if inflation is responding to the tariffs applied on trading partners and various industrial sectors.

          So far the levies were having only a limited impact on inflation, but economists broadly have expected to see them eventually filter into retail prices.

          "We know there is a lag between implementation and the inflationary effect," said Gregory Daco, chief economist at EY-Parthenon. "Businesses manage imports using different processes ... We have not seen the full-blown effects of tariffs on CPI data ... I would expect to start to see more."

          Overall inflation, excluding volatile food and energy prices increased at a 2.9% annual rate in June, slightly below the 3% consensus forecast, with car prices helping hold down the overall increases. Food and energy costs both increased.

          CLAWING BACK TARIFF COSTS

          The June CPI data will likely leave the Personal Consumption Expenditures Price Index the Fed uses for its 2% inflation target well above that goal, with increased uncertainty now that Trump has threatened tariff levels of 30% or more on Mexico, Canada and the European Union, and more actions always possible.

          The PCE index outside food and energy rose at a 2.7% annual rate in May; recent Fed policymaker projections see it hitting 3.1% by the end of 2025; and the most recent round of tariffs threatened by Trump for August 1 could push it even higher.

          The new tariff rates "if fully passed through, would add about 0.4 percentage points to the PCE price level," Michael Feroli, chief U.S. economist at JP Morgan, estimated. "Given imperfect pass-through, margin compression, a more likely estimate is 0.2-0.3 points. We think this bolsters the case for the Fed to take a very cautious approach to rate cuts."

          Daco said there was already "divergence" beginning across a wide swath of goods where prices are rising faster than they did before Trump's initial rounds of tariffs.

          The price of household furnishings, for example, jumped a full percentage point in June. Prices of those products had been dropping, but reversed course in the spring.

          Line chart of household furnishings price index.

          Other economists have pinpointed different items that could show where the new import taxes are starting to hit consumer prices.

          Sharif, the head of Inflation Insights, said the broad category referred to as "recreational commodities," which includes things like toys and audio and visual equipment that are often imported from China, bears watching -- and rose 0.8% in June, twice as fast as in the preceding two months.

          In his press conference following the June 17-18 policy meeting, Powell noted that electronics were an area where "we're beginning to see some effects. And we do expect to see more of them over coming months."

          Line chart of the price index for recreational goods.

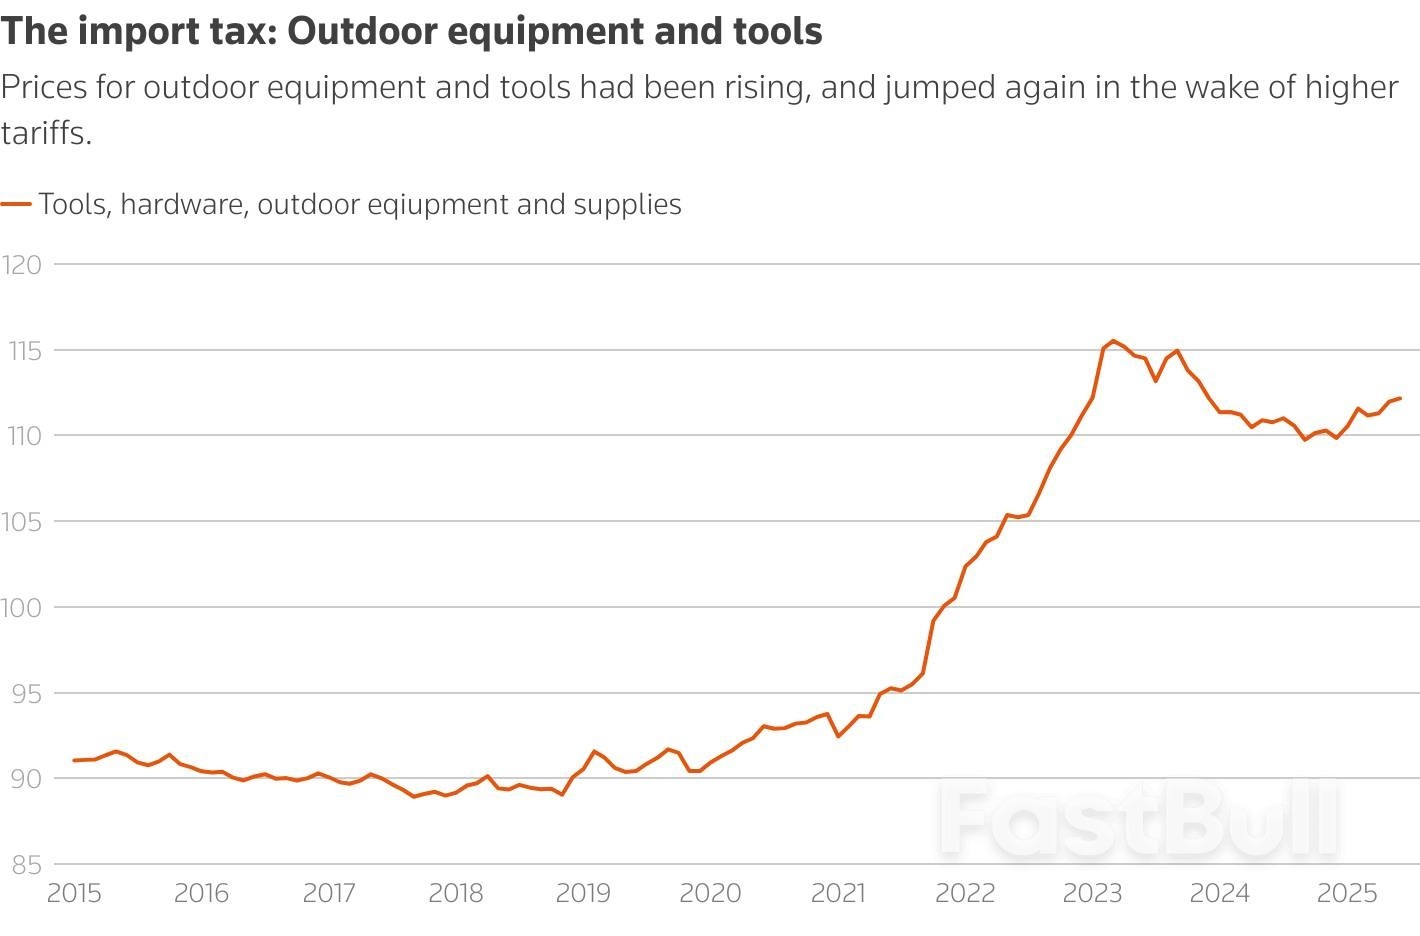
          Outdoor equipment and tools are also items that are heavily imported, and while the pace of price increases had picked up in the spring it fell back in June to 0.2% versus 0.6% in May.

          Line chart of the price index for outdoor equipment.

          Still, "tariff costs are strikingly visible in June’s CPI data," wrote Samuel Tombs, chief U.S. economist for Pantheon Macroeconomics. Excluding autos, prices for other non-food or energy goods rose at the fastest pace since June, 2022, when the Fed was still in a battle to lower pandemic-era inflation.

          "Prices rose especially sharply for goods which are primarily imported," with prices for appliances, sports equipment and toys all rising nearly 2% on the month, he said.

          Source: Reuters

          To stay updated on all economic events of today, please check out our Economic calendar
          Risk Warnings and Disclaimers
          You understand and acknowledge that there is a high degree of risk involved in trading. Following any strategies or investment methods may lead to potential losses. The content on the site is provided by our contributors and analysts for information purposes only. You are solely responsible for determining whether any trading assets, securities, strategy, or any other product is suitable for investing based on your own investment objectives and financial situation.
          Add to Favorites
          Share

          US Inflation Rose in June as Trump’s Tariffs Start to Show in Prices

          Warren Takunda

          Economic

          Inflation shot up in June as the impacts of Donald Trump’s tariffs slowly started to show in US prices.
          Business leaders have said for months that the high, volatile rates of Trump’s tariffs will force companies to raise consumer prices. Prices remained stable in the spring, particularly as many of Trump’s highest tariffs were paused; however, they started increasing in May and have continued to rise in June.
          Annual inflation rose to 2.7% in June, up from 2.4% in May, according to the Consumer Price Index (CPI), which tracks the prices of a basket of goods and services each month. Core CPI, which leaves out energy and food prices, ticked up slightly to 2.9%, compared with 2.8% in May.
          The prices of appliances, furniture and toys, products typically manufactured outside the US, all rose. Food prices increased by 3%, with the price of beef rising by more than 2% over the month, coffee up 2.2% and citrus fruit prices rising 2.3%. While the price of eggs has been dropping over the last few months, a dozen eggs are still 27% more expensive than last year.
          Inflation remains far below the price peaks seen three years ago, when price increases reached as high as 9%, and even a year ago, when increases were closer to 3%. But tariffs have appeared to halt inflation’s downward path.
          According to the Yale Budget Lab, Americans now face an average tariff rate of 18.7% – the highest rate since 1933. That includes 30% tariffs on China, a 50% tariff on steel and aluminum, 25% on auto parts and a universal 10% tariff on all imports.
          The levies currently in effect do not include those Trump is threatening to impose on other large US trading partners. Over the weekend, Trump threatened the EU and Mexico with 30% tariffs and Canada with a 35% tariff. Brazil is set to face 50% tariffs as punishment for the trial of Trump ally Jair Bolsonaro, Brazil’s former president, who is facing charges of attempting a coup.
          Prices will likely be pushed up much higher should these tariff rates go into effect, but it’s unclear if and when that could happen. Trump initially set negotiation deadlines to 9 July, but pushed it forward to 1 August as the date approached. Trump’s trade advisers have said they aim to end negotiations by Labor Day at the beginning of September.
          As prices remain volatile, the Federal Reserve appears unlikely to adjust interest rates anytime soon, despite cutting rates three times in the fall. Fed officials, including the central bank’s chair, Jerome Powell, have said that price increases are expected to continue in the summer, drawing away from the Fed’s 2% inflation target.

          Source: Theguardian

          To stay updated on all economic events of today, please check out our Economic calendar
          Risk Warnings and Disclaimers
          You understand and acknowledge that there is a high degree of risk involved in trading. Following any strategies or investment methods may lead to potential losses. The content on the site is provided by our contributors and analysts for information purposes only. You are solely responsible for determining whether any trading assets, securities, strategy, or any other product is suitable for investing based on your own investment objectives and financial situation.
          Add to Favorites
          Share
          FastBull
          Copyright © 2025 FastBull Ltd

          728 RM B 7/F GEE LOK IND BLDG NO 34 HUNG TO RD KWUN TONG KLN HONG KONG

          TelegramInstagramTwitterfacebooklinkedin
          App Store Google Play Google Play
          Products
          Charts

          Chats

          Q&A with Experts
          Screeners
          Economic Calendar
          Data
          Tools
          Membership
          Features
          Function
          Markets
          Copy Trading
          Latest Signals
          Contests
          News
          Analysis
          24/7
          Columns
          Education
          Company
          Careers
          About Us
          Contact Us
          Advertising
          Help Center
          Feedback
          User Agreement
          Privacy Policy
          Business

          White Label

          Data API

          Web Plug-ins

          Poster Maker

          Affiliate Program

          Risk Disclosure

          The risk of loss in trading financial instruments such as stocks, FX, commodities, futures, bonds, ETFs and crypto can be substantial. You may sustain a total loss of the funds that you deposit with your broker. Therefore, you should carefully consider whether such trading is suitable for you in light of your circumstances and financial resources.

          No decision to invest should be made without thoroughly conducting due diligence by yourself or consulting with your financial advisors. Our web content might not suit you since we don't know your financial conditions and investment needs. Our financial information might have latency or contain inaccuracy, so you should be fully responsible for any of your trading and investment decisions. The company will not be responsible for your capital loss.

          Without getting permission from the website, you are not allowed to copy the website's graphics, texts, or trademarks. Intellectual property rights in the content or data incorporated into this website belong to its providers and exchange merchants.

          Not Logged In

          Log in to access more features

          FastBull Membership

          Not yet

          Purchase

          Become a signal provider
          Help Center
          Customer Service
          Dark Mode
          Price Up/Down Colors

          Log In

          Sign Up

          Position
          Layout
          Fullscreen
          Default to Chart
          The chart page opens by default when you visit fastbull.com