• Trade
  • Markets
  • Copy
  • Contests
  • News
  • 24/7
  • Calendar
  • Q&A
  • Chats
Trending
Screeners
SYMBOL
LAST
BID
ASK
HIGH
LOW
NET CHG.
%CHG.
SPREAD
SPX
S&P 500 Index
6846.50
6846.50
6846.50
6878.28
6827.18
-23.90
-0.35%
--
DJI
Dow Jones Industrial Average
47739.31
47739.31
47739.31
47971.51
47611.93
-215.67
-0.45%
--
IXIC
NASDAQ Composite Index
23545.89
23545.89
23545.89
23698.93
23455.05
-32.22
-0.14%
--
USDX
US Dollar Index
99.000
99.080
99.000
99.000
99.000
+0.050
+ 0.05%
--
EURUSD
Euro / US Dollar
1.16364
1.16386
1.16364
1.16365
1.16322
0.00000
0.00%
--
GBPUSD
Pound Sterling / US Dollar
1.33170
1.33289
1.33170
1.33178
1.33140
-0.00035
-0.03%
--
XAUUSD
Gold / US Dollar
4189.70
4190.14
4189.70
4218.85
4175.92
-8.21
-0.20%
--
WTI
Light Sweet Crude Oil
58.555
58.807
58.555
60.084
58.495
-1.254
-2.10%
--

Community Accounts

Signal Accounts
--
Profit Accounts
--
Loss Accounts
--
View More

Become a signal provider

Sell trading signals to earn additional income

View More

Guide to Copy Trading

Get started with ease and confidence

View More

Signal Accounts for Members

All Signal Accounts

Best Return
  • Best Return
  • Best P/L
  • Best MDD
Past 1W
  • Past 1W
  • Past 1M
  • Past 1Y

All Contests

  • All
  • Trump Updates
  • Recommend
  • Stocks
  • Cryptocurrencies
  • Central Banks
  • Featured News
Top News Only
Share

SPDR Gold Holdings Down 0.11%, Or 1.14 Tonnes

Share

On Monday (December 8), In Late New York Trading, S&P 500 Futures Fell 0.21%, Dow Jones Futures Fell 0.43%, NASDAQ 100 Futures Fell 0.08%, And Russell 2000 Futures Fell 0.04%

Share

Morgan Stanley: Data Center ABS Spreads Are Expected To Widen In 2026

Share

(US Stocks) The Philadelphia Gold And Silver Index Closed Down 2.34% At 311.01 Points. (Global Session) The NYSE Arca Gold Miners Index Closed Down 2.17%, Hitting A Daily Low Of 2235.45 Points; US Stocks Remained Slightly Down Before The Opening Bell—holding Steady Around 2280 Points—before Briefly Rising Slightly

Share

IMF: IMF Executive Board Approves Extension Of The Extended Credit Facility Arrangement With Nepal

Share

Trump: Same Approach Will Apply To Amd, Intel, And Other Great American Companies

Share

Trump: Department Of Commerce Is Finalizing Details

Share

Trump: $25% Will Be Paid To United States Of America

Share

Trump: President Xi Responded Positively

Share

[Consumer Discretionary ETFs Fell Over 1.4%, Leading The Decline Among US Sector ETFs; Semiconductor ETFs Rose Over 1.1%] On Monday (December 8), The Consumer Discretionary ETF Fell 1.45%, The Energy ETF Fell 1.09%, The Internet ETF Fell 0.18%, The Regional Banks ETF Rose 0.34%, The Technology ETF Rose 0.70%, The Global Technology ETF Rose 0.93%, And The Semiconductor ETF Rose 1.13%

Share

Trump: I Have Informed President Xi, Of China, That United States Will Allow Nvidia To Ship Its H200 Products To Approved Customers In China

Share

Argentina's Merval Index Closed Up 0.02% At 3.047 Million Points. It Rose To A New Daily High Of 3.165 Million Points In Early Trading In Buenos Aires Before Gradually Giving Back Its Gains

Share

US Stock Market Closing Report | On Monday (December 8), The Magnificent 7 Index Fell 0.20% To 208.33 Points. The "mega-cap" Tech Stock Index Fell 0.33% To 405.00 Points

Share

Pentagon - USA State Dept Approves Potential Sale Of Hellfire Missiles To Belgium For An Estimated $79 Million

Share

Toronto Stock Index .GSPTSE Unofficially Closes Down 141.44 Points, Or 0.45 Percent, At 31169.97

Share

The Nasdaq Golden Dragon China Index Closed Up Less Than 0.1%. Nxtt Rose 21%, Microalgo Rose 7%, Daqo New Energy Rose 4.3%, And 21Vianet, Baidu, And Miniso All Rose More Than 3%

Share

The S&P 500 Initially Closed Down More Than 0.4%, With The Telecom Sector Down 1.9%, And Materials, Consumer Discretionary, Utilities, Healthcare, And Energy Sectors Down By As Much As 1.6%, While The Technology Sector Rose 0.7%. The NASDAQ 100 Initially Closed Down 0.3%, With Marvell Technology Down 7%, Fortinet Down 4%, And Netflix And Tesla Down 3.4%

Share

IMF: Review Pakistan Authorities To Draw The Equivalent Of About US$1 Billion

Share

President Trump Is Committed To The Continued Cessation Of Violence And Expects The Governments Of Cambodia And Thailand To Fully Honor Their Commitments To End This Conflict - Senior White House Official

Share

[Water Overflows From Spent Fuel Pool At Japanese Nuclear Facility] According To Japan's Nuclear Waste Management Company, Following A Strong Earthquake Off The Coast Of Aomori Prefecture Late On December 8th, Workers At The Nuclear Waste Treatment Plant In Rokkasho Village, Aomori Prefecture, Discovered "at Least 100 Liters Of Water" On The Ground Around The Spent Fuel Pool During An Inspection. Analysis Suggests This Water "may Have Overflowed Due To The Earthquake's Shaking." However, It Is Reported That The Overflowed Water "remains Inside The Building And Has Not Affected The External Environment."

TIME
ACT
FCST
PREV
France Trade Balance (SA) (Oct)

A:--

F: --

P: --
Euro Zone Employment YoY (SA) (Q3)

A:--

F: --

P: --
Canada Part-Time Employment (SA) (Nov)

A:--

F: --

P: --

Canada Unemployment Rate (SA) (Nov)

A:--

F: --

P: --

Canada Full-time Employment (SA) (Nov)

A:--

F: --

P: --

Canada Labor Force Participation Rate (SA) (Nov)

A:--

F: --

P: --

Canada Employment (SA) (Nov)

A:--

F: --

P: --

U.S. PCE Price Index MoM (Sept)

A:--

F: --

P: --

U.S. Personal Income MoM (Sept)

A:--

F: --

P: --

U.S. Core PCE Price Index MoM (Sept)

A:--

F: --

P: --

U.S. PCE Price Index YoY (SA) (Sept)

A:--

F: --

P: --

U.S. Core PCE Price Index YoY (Sept)

A:--

F: --

P: --

U.S. Personal Outlays MoM (SA) (Sept)

A:--

F: --

P: --
U.S. 5-10 Year-Ahead Inflation Expectations (Dec)

A:--

F: --

P: --

U.S. Real Personal Consumption Expenditures MoM (Sept)

A:--

F: --

P: --
U.S. Weekly Total Rig Count

A:--

F: --

P: --

U.S. Weekly Total Oil Rig Count

A:--

F: --

P: --

U.S. Consumer Credit (SA) (Oct)

A:--

F: --

P: --
China, Mainland Foreign Exchange Reserves (Nov)

A:--

F: --

P: --

Japan Trade Balance (Oct)

A:--

F: --

P: --

Japan Nominal GDP Revised QoQ (Q3)

A:--

F: --

P: --

China, Mainland Imports YoY (CNH) (Nov)

A:--

F: --

P: --

China, Mainland Exports (Nov)

A:--

F: --

P: --

China, Mainland Imports (CNH) (Nov)

A:--

F: --

P: --

China, Mainland Trade Balance (CNH) (Nov)

A:--

F: --

P: --

China, Mainland Exports YoY (USD) (Nov)

A:--

F: --

P: --

China, Mainland Imports YoY (USD) (Nov)

A:--

F: --

P: --

Germany Industrial Output MoM (SA) (Oct)

A:--

F: --

P: --
Euro Zone Sentix Investor Confidence Index (Dec)

A:--

F: --

P: --

Canada National Economic Confidence Index

A:--

F: --

P: --

U.K. BRC Like-For-Like Retail Sales YoY (Nov)

--

F: --

P: --

U.K. BRC Overall Retail Sales YoY (Nov)

--

F: --

P: --

Australia Overnight (Borrowing) Key Rate

--

F: --

P: --

RBA Rate Statement
RBA Press Conference
Germany Exports MoM (SA) (Oct)

--

F: --

P: --

U.S. NFIB Small Business Optimism Index (SA) (Nov)

--

F: --

P: --

Mexico 12-Month Inflation (CPI) (Nov)

--

F: --

P: --

Mexico Core CPI YoY (Nov)

--

F: --

P: --

Mexico PPI YoY (Nov)

--

F: --

P: --

U.S. Weekly Redbook Index YoY

--

F: --

P: --

U.S. JOLTS Job Openings (SA) (Oct)

--

F: --

P: --

China, Mainland M1 Money Supply YoY (Nov)

--

F: --

P: --

China, Mainland M0 Money Supply YoY (Nov)

--

F: --

P: --

China, Mainland M2 Money Supply YoY (Nov)

--

F: --

P: --

U.S. EIA Short-Term Crude Production Forecast For The Year (Dec)

--

F: --

P: --

U.S. EIA Natural Gas Production Forecast For The Next Year (Dec)

--

F: --

P: --

U.S. EIA Short-Term Crude Production Forecast For The Next Year (Dec)

--

F: --

P: --

EIA Monthly Short-Term Energy Outlook
U.S. API Weekly Gasoline Stocks

--

F: --

P: --

U.S. API Weekly Cushing Crude Oil Stocks

--

F: --

P: --

U.S. API Weekly Crude Oil Stocks

--

F: --

P: --

U.S. API Weekly Refined Oil Stocks

--

F: --

P: --

South Korea Unemployment Rate (SA) (Nov)

--

F: --

P: --

Japan Reuters Tankan Non-Manufacturers Index (Dec)

--

F: --

P: --

Japan Reuters Tankan Manufacturers Index (Dec)

--

F: --

P: --

Japan Domestic Enterprise Commodity Price Index MoM (Nov)

--

F: --

P: --

Japan Domestic Enterprise Commodity Price Index YoY (Nov)

--

F: --

P: --

China, Mainland PPI YoY (Nov)

--

F: --

P: --

China, Mainland CPI MoM (Nov)

--

F: --

P: --

Italy Industrial Output YoY (SA) (Oct)

--

F: --

P: --

Q&A with Experts
    • All
    • Chatrooms
    • Groups
    • Friends
    Connecting
    .
    .
    .
    Type here...
    Add Symbol or Code

      No matching data

      All
      Trump Updates
      Recommend
      Stocks
      Cryptocurrencies
      Central Banks
      Featured News
      • All
      • Russia-Ukraine Conflict
      • Middle East Flashpoint
      • All
      • Russia-Ukraine Conflict
      • Middle East Flashpoint
      Search
      Products

      Charts Free Forever

      Chats Q&A with Experts
      Screeners Economic Calendar Data Tools
      Membership Features
      Data Warehouse Market Trends Institutional Data Policy Rates Macro

      Market Trends

      Market Sentiment Order Book Forex Correlations

      Top Indicators

      Charts Free Forever
      Markets

      News

      News Analysis 24/7 Columns Education
      From Institutions From Analysts
      Topics Columnists

      Latest Views

      Latest Views

      Trending Topics

      Top Columnists

      Latest Update

      Signals

      Copy Rankings Latest Signals Become a signal provider AI Rating
      Contests
      Brokers

      Overview Brokers Assessment Rankings Regulators News Claims
      Broker listing Forex Brokers Comparison Tool Live Spread Comparison Scam
      Q&A Complaint Scam Alert Videos Tips to Detect Scam
      More

      Business
      Events
      Careers About Us Advertising Help Center

      White Label

      Data API

      Web Plug-ins

      Affiliate Program

      Awards Institution Evaluation IB Seminar Salon Event Exhibition
      Vietnam Thailand Singapore Dubai
      Fans Party Investment Sharing Session
      FastBull Summit BrokersView Expo
      Recent Searches
        Top Searches
          Markets
          News
          Analysis
          User
          24/7
          Economic Calendar
          Education
          Data
          • Names
          • Latest
          • Prev

          View All

          No data

          Scan to Download

          Faster Charts, Chat Faster!

          Download App
          English
          • English
          • Español
          • العربية
          • Bahasa Indonesia
          • Bahasa Melayu
          • Tiếng Việt
          • ภาษาไทย
          • Français
          • Italiano
          • Türkçe
          • Русский язык
          • 简中
          • 繁中
          Open Account
          Search
          Products
          Charts Free Forever
          Markets
          News
          Signals

          Copy Rankings Latest Signals Become a signal provider AI Rating
          Contests
          Brokers

          Overview Brokers Assessment Rankings Regulators News Claims
          Broker listing Forex Brokers Comparison Tool Live Spread Comparison Scam
          Q&A Complaint Scam Alert Videos Tips to Detect Scam
          More

          Business
          Events
          Careers About Us Advertising Help Center

          White Label

          Data API

          Web Plug-ins

          Affiliate Program

          Awards Institution Evaluation IB Seminar Salon Event Exhibition
          Vietnam Thailand Singapore Dubai
          Fans Party Investment Sharing Session
          FastBull Summit BrokersView Expo

          North Korea Sending Up to 30,000 Troops to Bolster Russia's Forces

          Michelle

          Political

          Summary:

          There's reason to be highly suspicious of the claims sourced to Ukrainian intelligence...

          North Korea is reportedly preparing to triple the number of its troops fighting for Russia along the front lines with Ukraine, sending an additional 25,000 to 30,000 soldiers to assist Russian forces. This is based on an intelligence assessment from Ukrainian officials.

          According to CNN, "The troops may arrive in Russia in the coming months, according to the assessment seen by CNN, adding to the 11,000 sent in November who helped repel Ukraine’s incursion into Russia’s Kursk region." The report adds: "Around 4,000 of those North Korean soldiers were killed or injured in the deployment, according to Western officials, yet Pyongyang’s cooperation with Moscow has since bloomed."

          But there's reason to be suspicious and skeptical of the report sourced to Ukrainian intelligence as well as Western intelligence officials, which are cited, given the crucial timing.

          The claims of this drastic escalation in North Korea's support come within 24 hours after the White House revealed it would be halting key weapons transfers to Kiev, on concerns that Pentagon stockpiles are growing thin.

          And so it seems the Ukrainian government wants to desperately get the West's attention, at a moment it is losing a key vital weapons and ammo pipeline.

          It was just last month that Ukrainian President Volodymyr Zelensky reiterated his urgent call for joint international action against Russia, Iran and North Korea - or a new 'axis' conspiring against Ukraine.

          "Russia is now trying to save Iran's nuclear program – there is no other way to interpret the public signals and non-public activities," Zelensky had said two weeks ago.

          "When Iranian Shahed drones – now significantly upgraded – and ballistic missiles from North Korea – also upgraded – kill our people in Ukraine, it is a clear sign that global solidarity and global pressure are not enough," Zelensky said. "We must significantly tighten sanctions."

          As for the new intel assessment on the alleged North Korea troop surge, CNN continues:

          The Ukrainian assessment seen by CNN says the Russian ministry of defense is capable of providing “needed equipment, weapons and ammunition” with the aim of “further integration to Russian combat units.” The document adds “there is a great possibility” the North Korean troops will be engaged in combat in parts of Russian-occupied Ukraine “to strengthen the Russian contingent, including during the large-scale offensive operations.”

          The assessment, from Ukraine’s defense intelligence agency, also says there are signs that Russian military aircraft are being refitted to carry personnel, reflecting the vast undertaking of moving tens of thousands of foreign troops across Russian Siberia, which shares a border with North Korea in its far southwest.

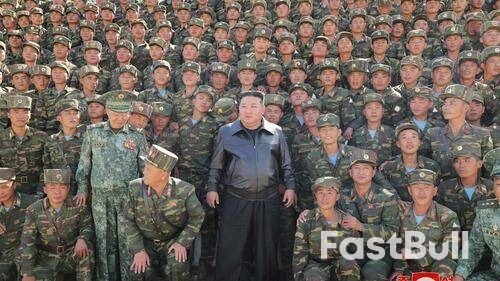
          Earlier this week North Korea's state-run media aired footage showing leader Kim Jong-un mourning the deaths of North Korean soldiers, said to be killed while fighting in Russia's war in Ukraine as part of allied forces. The occasion for the memorial footage was the return of the soldiers' remains from Russia, though no details were given as to the number of the deceased being remembered.

          This past weekend also marked the first anniversary of the signing of the two countries' "comprehensive strategic partnership" treaty. This served as the 'legal basis' on which the North Korean troop deployment to Russia happened.

          Source: Zero Hedge

          Risk Warnings and Disclaimers
          You understand and acknowledge that there is a high degree of risk involved in trading. Following any strategies or investment methods may lead to potential losses. The content on the site is provided by our contributors and analysts for information purposes only. You are solely responsible for determining whether any trading assets, securities, strategy, or any other product is suitable for investing based on your own investment objectives and financial situation.
          Add to Favorites
          Share

          Oil Prices Steady on Solid Job Market, Tariff Uncertainty

          Glendon

          Economic

          Commodity

          Oil prices were little changed on Friday as a solid job market bolstered the case for the U.S. Federal Reserve keeping interest rates on hold, with investors also awaiting clarity on President Donald Trump's plans for tariffs on various countries.

          Brent crude futures rose 1 cent, or 0.01%, to $68.81 a barrel by 0036 GMT, while U.S. West Texas Intermediate crude firmed 3 cents, or 0.04%, to $67.03.

          Trade was thinned by the U.S. Independence Day holiday.

          The U.S. labour market receded as a risk when new data on Thursday showed that American firms added a more-than-expected 147,000 jobs in June and the unemployment rate unexpectedly fell to 4.1% - signs the economy remained resilient despite the turbulence and uncertainty over how big tariffs will be.

          President Trump said Washington will start sending letters to countries on Friday specifying what tariff rates they will face on goods sent to the United States, a clear shift from earlier pledges to strike scores of individual deals.

          Trump told reporters before departing for Iowa on Thursday the letters would be sent to 10 countries at a time, laying out tariff rates of 20% to 30%.

          Trump's 90-day pause on higher U.S. tariffs ends on July 9, and several large trading partners have yet to clinch trade deals, including the European Union and Japan.

          Keeping prices in check, however, OPEC+, the world's largest group of oil producers, is set to announce an increase of 411,000 barrels per day in production for August as it looks to regain market share, four delegates from the group told Reuters.

          The U.S. also imposed sanctions on Thursday against a network that smuggles Iranian oil disguised as Iraqi oil and on a Hezbollah-controlled financial institution, the Treasury Department said.

          Barclays on Thursday said it raised its Brent oil price forecast by $6 to $72 per barrel for 2025 and by $10 to $70 a barrel for 2026 on an improved outlook for demand.

          Source: Yahoo Finance

          To stay updated on all economic events of today, please check out our Economic calendar
          Risk Warnings and Disclaimers
          You understand and acknowledge that there is a high degree of risk involved in trading. Following any strategies or investment methods may lead to potential losses. The content on the site is provided by our contributors and analysts for information purposes only. You are solely responsible for determining whether any trading assets, securities, strategy, or any other product is suitable for investing based on your own investment objectives and financial situation.
          Add to Favorites
          Share

          USDJPY Accelerates Within Range After Back-to-Back Positive US Data Surprises

          Blue River

          Economic

          Technical Analysis

          The United States continues to demonstrate why it remains the largest and most powerful economy in the world, consistently surprising markets with its resilience in the past few data releases.

          While market participants have been eager to question US strength—especially under President Trump’s “US Exceptionalism” policy, which many feared could backfire—recent economic data continues to challenge that narrative.

          Despite ongoing concerns over diplomatic volatility and declining business confidence, the US economy once again delivered upside surprises. The Non-Farm Payrolls (NFP) report, expected at 110K, surprised with a +37K beat, and the more influential ISM Services PMI came in strong—reaffirming underlying economic momentum.

          As a result, the US Dollar is regaining its footing. The Dollar Index (DXY) is up approximately 0.35% on the session, and even with an early close ahead of Independence Day, USDJPY surged 1300 pips on the heels of the release.

          USDJPY Technical Analysis from the Daily to 1H Charts

          USDJPY Daily Chart

          USDJPY Daily Chart, July 3, 2025 – Source: TradingView

          Overnight, markets perceived some hawkish comments from Bank of Japan’s Takata, who mentioned that the BoJ would still look to resume hikes after a pause – such comments did not do much to add strength to the Yen.

          Nonetheless, the longer-term range 142.00 to 146.50 range remains intact, with the pair up 1,350 pips on the session.

          It remains notable that 146.00 served many times as the higher resistance level within the range, but two occasions of USD dominance (Potential tariff removals in beginning of May and Iran-Israel War) led to what seemed like breakouts before rejecting the Extreme of Range 147.50 to 148.

          Broader USD strength following this morning’s data could bring the pair to such extremes again if the Greenback keeps rebounding from its lows.

          USDJPY 4H Chart

          USDJPY 4H Chart, July 3, 2025 – Source: TradingView

          The latest round trip within the range led to a wick on the Main Range support (last swing low 142.68), followed by a swift rebound, particularly as markets retested the Intermediate Support at 143.55.

          Key Moving Averages are still flat on the 4H timeframe, confirming again the strength of the range, which may only lead to actual breakouts when markets start to price in new fundamental change – mostly expected when respective US and Japanese Central Bank policies diverge further.

          The RSI moved quite aggressively higher in this morning’s up-move but still had some space before becoming overbought, leaving some margin for manoeuvre for bulls – Let’s take a look closer to spot more zones of interest.

          USDJPY 1H Chart

          USDJPY 1H Chart, July 3, 2025 – Source: TradingView

          On this shorter timeframe, we can observe with more details how volatile but rangebound the price action is in the pair. Although there has been many catalysts for breakouts, the action is still contained.

          This morning’s Hourly bar from the data release did close at its highs and has consolidated at its top, a sign of strength for the USD as seen in other currency pairs.

          Look at 144.50 as immediate pivot – a break below would retest the lower parts of the range explored in higher timeframes. Sellers will have to show some strength at the current Lower timeframe Resistance 145.00 to regain some edge.

          Staying above here leaves the bulls in control, and a failure of sellers to correct prices will hint at a re-entry within the 146.00 to 146.70 Main Resistance Zone

          Safe Trades!

          Source: ACTIONFOREX

          To stay updated on all economic events of today, please check out our Economic calendar
          Risk Warnings and Disclaimers
          You understand and acknowledge that there is a high degree of risk involved in trading. Following any strategies or investment methods may lead to potential losses. The content on the site is provided by our contributors and analysts for information purposes only. You are solely responsible for determining whether any trading assets, securities, strategy, or any other product is suitable for investing based on your own investment objectives and financial situation.
          Add to Favorites
          Share

          Barclays Raises Brent Forecast to $72 per Barrel for 2025

          Manuel

          Commodity

          Barclays on Thursday said it raised its Brent oil price forecast by $6 to $72 per barrel for 2025 and by $10 to $70 a barrel for 2026 on an improved outlook for demand.
          "Geopolitical tensions have eased as the U.S​.-​mediated ceasefire between Israel and Iran continues to hold and the risk premium has evaporated, but price action has been reflecting better​-​than​-​expected fundamentals, in our view," said Barclays in a note.
          Despite an accelerated increase in output from the Organization of the Petroleum Exporting Countries and its allies including Russia (OPEC+), global crude oil inventories declined in the second quarter, Barclays said.
          The tighter balance outlook is driven by stronger demand growth, weaker non-OPEC supply growth, and the International Energy Agency's (IEA) upward revision of baseline demand estimates, it said.
          Barclays raised its outlook for global demand growth by 260,000 barrels per day, with most of that coming from Organisation for Economic Co-operation and Development (OECD) countries, where it said "demand has been coming in stronger than expected".
          It now sees U.S. oil demand growing by 130,000 bpd this year, which is 100,000 bpd ahead of its previous estimate following a weather-related demand boost earlier in the year, although it still expects a gradual slowdown in activity.
          On the supply side, while OPEC+ will likely continue to phase out its voluntary production cuts at an accelerated pace, the actual output increase likely will continue to lag, Barclays said, pointing to pressure on some OPEC+ producers to curb output to compensate for earlier producing above their quotas.
          "Between March and May 2025, OPEC+ target increased by 548 kb/d but the group's output remained largely flat, resulting in better compliance, in aggregate," it said.

          Source: Reuters

          Risk Warnings and Disclaimers
          You understand and acknowledge that there is a high degree of risk involved in trading. Following any strategies or investment methods may lead to potential losses. The content on the site is provided by our contributors and analysts for information purposes only. You are solely responsible for determining whether any trading assets, securities, strategy, or any other product is suitable for investing based on your own investment objectives and financial situation.
          Add to Favorites
          Share

          BlackRock’s Bitcoin ETF Rapidly Climbs to Third in Revenue, Nears Top Spot

          Manuel

          Cryptocurrency

          BlackRock’s spot Bitcoin exchange-traded fund IBIT has become the asset manager’s third-highest revenue-generating ETF just 18 months after its launch, according to data shared by Bloomberg senior ETF analyst Eric Balchunas.
          Strategy Chairman Michael Saylor responded to the milestone by predicting that IBIT will soon become BlackRock’s number one revenue-generating ETF.
          The IBIT fund has approximately $76 billion in assets under management and an expense ratio of 0.25%, generating an estimated $191 million in annual revenue.
          The revenue places it behind only BlackRock’s iShares Russell 1000 Growth ETF (IWF), which generates around $211 million, and the iShares MSCI EAFE ETF (EFA), which generates roughly $207 million.
          A separate Bloomberg News report noted that IBIT is now only $9 billion in assets away from overtaking IWF to become BlackRock’s top revenue-generating ETF out of its lineup of over 1,100 funds.

          According to Balchunas:

          “Just another insane stat for a 1.5-year-old (literally an infant) ETF.”
          IBIT launched in January 2024 alongside other spot Bitcoin ETFs approved by the U.S. Securities and Exchange Commission.
          Within days of its debut, IBIT became the fastest ETF in history to cross $2 billion in inflows, surpassing traditional market leaders and setting multiple records for first-week subscriptions.
          By its six-month mark, the fund had already grown to over $50 billion in assets, reflecting accelerating institutional and retail demand for regulated Bitcoin exposure.
          According to the Bloomberg report, IBIT’s performance highlights the growing integration of Bitcoin into traditional portfolios, mirroring the trajectory of gold ETFs over the past two decades.
          The product has been widely adopted by financial advisors, corporate treasuries, and hedge funds seeking liquid, regulated exposure to Bitcoin without the complexities of direct custody.

          Source: Cryptoslate

          Risk Warnings and Disclaimers
          You understand and acknowledge that there is a high degree of risk involved in trading. Following any strategies or investment methods may lead to potential losses. The content on the site is provided by our contributors and analysts for information purposes only. You are solely responsible for determining whether any trading assets, securities, strategy, or any other product is suitable for investing based on your own investment objectives and financial situation.
          Add to Favorites
          Share

          Gold Drops After Strong Jobs Number Makes Early Fed Cut Unlikely

          Manuel

          Central Bank

          Commodity

          Gold dropped after strong US jobs data took the pressure off the Federal Reserve to lower interest rates at the end of this month.
          Gold fell as much as 1.4% after trading in a narrow range for most of the day. Payroll numbers came in above analyst expectations, while the unemployment rate was lower than forecast. The dollar rose along with Treasury yields, as traders pared the already slim odds of a cut at the Fed’s July meeting. Higher rates typically weigh on gold, which doesn’t bear interest.
          “The big question was the unemployment rate,” said Gregory Faranello, head of US rates trading and strategy for AmeriVet Securities. “The door for July is over and the Fed will take the summer off. The needle for the Fed to move was employment and that gives Fed Chair Powell the room for a ‘wait and see approach’.”
          Gold is still up by more than a quarter this year, trading about $170 short of a record set in April. The precious metal has been bolstered by demand for havens as investors grapple with heightened geopolitical and trade tensions. The rally has also been supported by robust central-bank purchases, as well as inflows into bullion-backed exchange-traded funds.
          Meanwhile, there are lingering concerns about the US deficit, after President Donald Trump secured a sweeping shift in US domestic policy as the House passed a $3.4 trillion fiscal package.
          Investors also continued to monitor progress in US trade negotiations, after Trump said he reached a deal with Vietnam. As his July 9 deadline for higher tariffs approaches, there are signs investors are becoming increasingly less worried by the president’s unpredictable stance on levies given the economy appears resilient for now.
          Spot gold fell 0.9% to $3,326.55 an ounce as of 4:24 p.m. in New York. The Bloomberg Dollar Spot Index edged up 0.2%%. Silver rose, while palladium and platinum fell.

          Source: Bloomberg

          Risk Warnings and Disclaimers
          You understand and acknowledge that there is a high degree of risk involved in trading. Following any strategies or investment methods may lead to potential losses. The content on the site is provided by our contributors and analysts for information purposes only. You are solely responsible for determining whether any trading assets, securities, strategy, or any other product is suitable for investing based on your own investment objectives and financial situation.
          Add to Favorites
          Share

          RBNZ to Hold Rates at 3.25% on July 9 but Cut Once More This Year

          Manuel

          Economic

          Forex

          The Reserve Bank of New Zealand will leave interest rates unchanged on July 9, a majority of economists polled by Reuters expected, with the median forecast showing just one more 25 basis point cut this year compared with two in a May survey.
          After one of the most aggressive tightening cycles in its history to tame inflation, the central bank has lowered rates by 225 basis points since August.
          That supported an economy that emerged from recession last year. It grew by 0.8% in the January-March quarter, giving policymakers time to consider the next rate cut.
          Although inflation eased to 2.5% in the first quarter, within the RBNZ's 1%–3% target range, uncertainty around medium-term price pressures has increased.
          With second-quarter inflation data due on July 21, the central bank is expected to hold off on further easing for now.
          A majority of economists, 19 of 27, in a June 30-July 3 Reuters poll expected the RBNZ to hold its official cash rate at 3.25% on July 9. Eight expected a 25 basis point cut.
          All major New Zealand banks - ANZ, ASB, BNZ, Kiwibank and Westpac - forecast no change in rates.
          Another 25 basis point cut is due by end-September, according to 16 of 22 economists, with half expecting it at the August meeting.
          "The data that has come out since the May monetary policy statement has been pretty mixed," said Wesley Tanuvasa, economist at ASB.
          "So pause now, see the inflation expectation data. From there, that can help them navigate whether August is a cut or not. Right now, we've priced in a cut for August," he said.
          While there is no majority on where rates will end the year, the median forecast shows 3.00% compared with 2.75% in the May poll.
          Inflation is expected to average 2.8% this quarter and stay within the RBNZ's target range through at least the end of 2026, according to the poll. It is forecast to average 2.5% in 2025 and 2.1% in 2026.
          New Zealand's economy is expected to grow 1.0% this year and 2.4% in 2026, down from 1.2% and 2.5%, respectively, in an April survey, the poll showed.

          Source: Reuters

          To stay updated on all economic events of today, please check out our Economic calendar
          Risk Warnings and Disclaimers
          You understand and acknowledge that there is a high degree of risk involved in trading. Following any strategies or investment methods may lead to potential losses. The content on the site is provided by our contributors and analysts for information purposes only. You are solely responsible for determining whether any trading assets, securities, strategy, or any other product is suitable for investing based on your own investment objectives and financial situation.
          Add to Favorites
          Share
          FastBull
          Copyright © 2025 FastBull Ltd

          728 RM B 7/F GEE LOK IND BLDG NO 34 HUNG TO RD KWUN TONG KLN HONG KONG

          TelegramInstagramTwitterfacebooklinkedin
          App Store Google Play Google Play
          Products
          Charts

          Chats

          Q&A with Experts
          Screeners
          Economic Calendar
          Data
          Tools
          Membership
          Features
          Function
          Markets
          Copy Trading
          Latest Signals
          Contests
          News
          Analysis
          24/7
          Columns
          Education
          Company
          Careers
          About Us
          Contact Us
          Advertising
          Help Center
          Feedback
          User Agreement
          Privacy Policy
          Business

          White Label

          Data API

          Web Plug-ins

          Poster Maker

          Affiliate Program

          Risk Disclosure

          The risk of loss in trading financial instruments such as stocks, FX, commodities, futures, bonds, ETFs and crypto can be substantial. You may sustain a total loss of the funds that you deposit with your broker. Therefore, you should carefully consider whether such trading is suitable for you in light of your circumstances and financial resources.

          No decision to invest should be made without thoroughly conducting due diligence by yourself or consulting with your financial advisors. Our web content might not suit you since we don't know your financial conditions and investment needs. Our financial information might have latency or contain inaccuracy, so you should be fully responsible for any of your trading and investment decisions. The company will not be responsible for your capital loss.

          Without getting permission from the website, you are not allowed to copy the website's graphics, texts, or trademarks. Intellectual property rights in the content or data incorporated into this website belong to its providers and exchange merchants.

          Not Logged In

          Log in to access more features

          FastBull Membership

          Not yet

          Purchase

          Become a signal provider
          Help Center
          Customer Service
          Dark Mode
          Price Up/Down Colors

          Log In

          Sign Up

          Position
          Layout
          Fullscreen
          Default to Chart
          The chart page opens by default when you visit fastbull.com