Markets
News
Analysis
User
24/7
Economic Calendar
Education
Data
- Names
- Latest
- Prev


In this monthly technical analysis, we examine key chart patterns and levels for the EURUSD, USDJPY, GBPUSD, AUDUSD, USDCAD pairs, gold, and Brent crude oil to forecast potential developments for August 2025.
Major technical levels to watch in August 2025
August will begin amid rising expectations of a Fed rate cut closer to Q4 – the labour market remains resilient, but inflation indicators show no signs of increasing. The ECB maintains a cautious tone, not signalling imminent easing steps.
US trade policy puts additional pressure on the euro. New tariffs imposed by the Trump administration on European goods undermine the eurozone’s export potential and increase concerns about slowing economic growth. These measures drive capital outflows into safe-haven assets, particularly the US dollar, thereby strengthening its position against the euro.The overall yield differential and geopolitical tensions continue to create a strong bearish backdrop for the EURUSD pair.
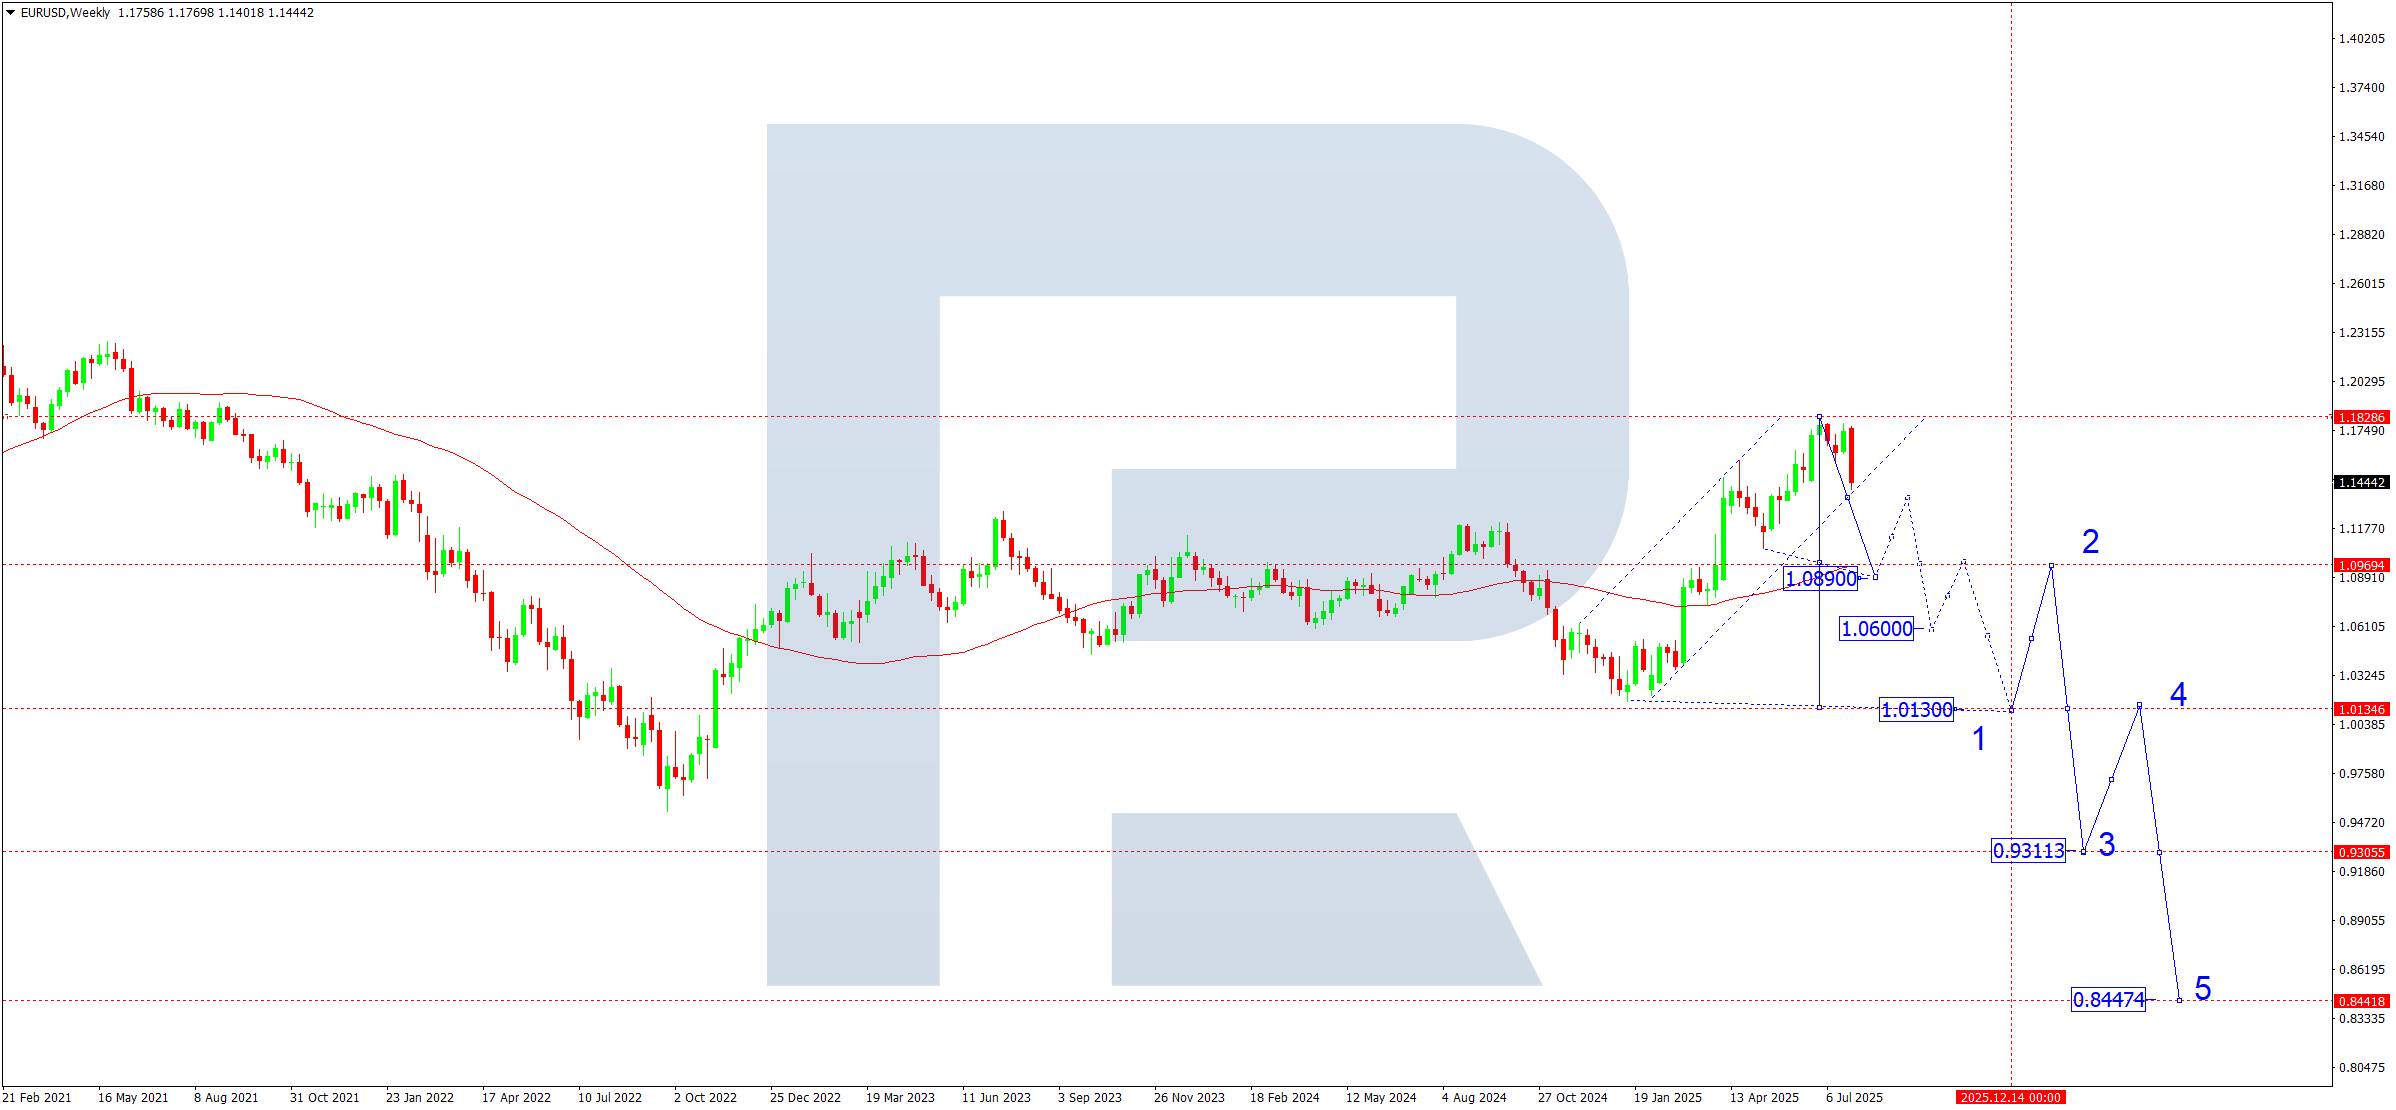
On the weekly chart, the EURUSD pair continues its steady downtrend that started in late June 2025. Breaking through the 1.1555 level has opened the path to a medium-term target corresponding to the width of the previous consolidation range.The current momentum suggests the development of the first downward wave, targeting the 1.0130 zone. In August, the first leg of this decline is expected to reach 1.0890 – where the SMA50 lies, which could temporarily hold the market and trigger a corrective pullback towards 1.1355.
Bullish scenario (alternative):
A confident breakout and consolidation above 1.1850 will pave the way for growth, with target levels at:
Bearish scenario (primary):
A consolidation below 1.1500 confirms the beginning of the fifth downward wave with a final target in the 0.8444 area.The nearest target is 1.0130 as the completion of the first wave of decline. In August, the development of the first leg of this downward wave towards 1.0890 remains relevant.
The Japanese yen remains under pressure due to persistent interest rate differentials. Markets are pricing in a potential further rate hike in the US amid a moderate inflation slowdown.
Weakness in Japan’s economy and the Bank of Japan’s ongoing loose policy (including yield curve control) limit the yen's appeal as a safe-haven currency. In addition, dollar strength is supported by rising US Treasury yields and high expectations for corporate earnings. An added layer of uncertainty comes from Japan’s stance on intervention – markets anticipate strict countermeasures if yen depreciation intensifies below key levels.
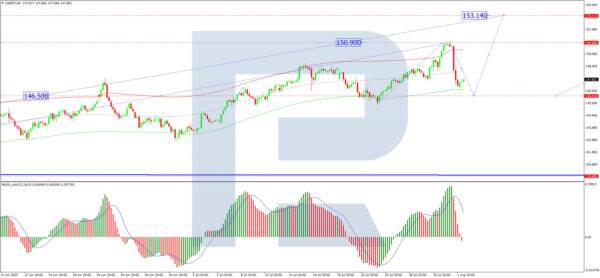
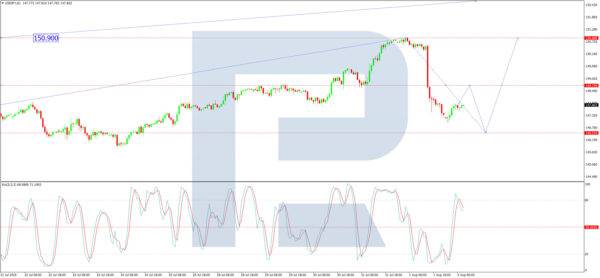
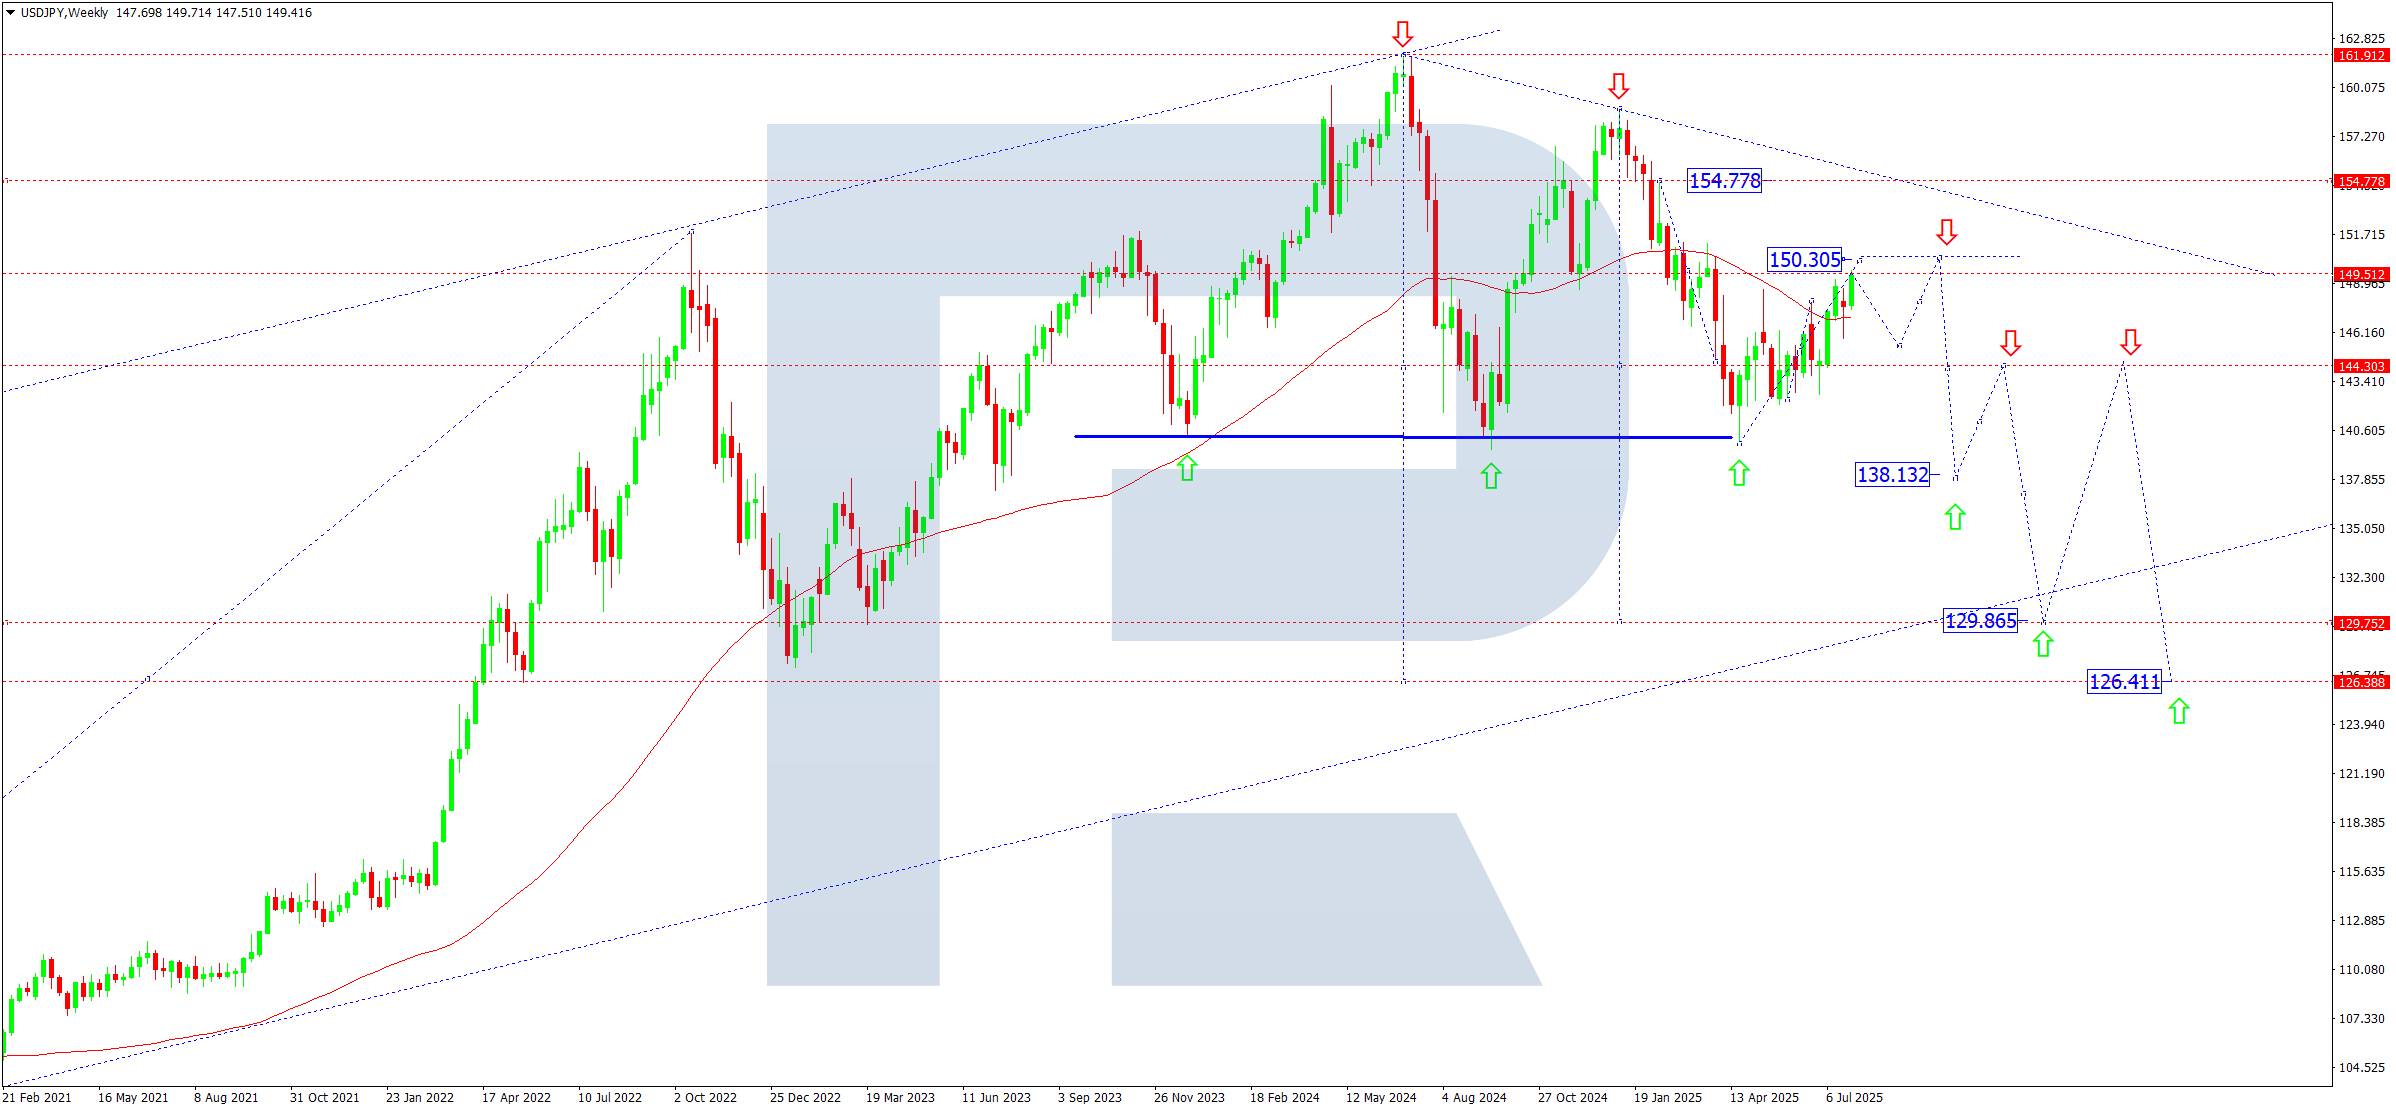
The USDJPY pair is trading within a Symmetrical Triangle on the weekly chart, which began to form after hitting an all-time high of 161.91. Since January 2025, a downward structure has emerged, with an intermediate target around 129.90 – a level of interest for medium-term sellers.
Current consolidation near 145.50 reflects a supply-demand balance (pivot point), around which a correction phase is unfolding. The 50-week Moving Average acts as dynamic support in the 145.75 area. If the current structure holds, the price could rise to 150.30-151.00 before a new downward move.
Bearish scenario (alternative):
A breakout below 145.40 followed by consolidation below 145.00 would open the way for a decline towards 138.15, and further to 129.90 if pressure increases.
Bullish scenario (primary):
A stable breakout and consolidation above 147.50 would signal a return to the bullish channel. In that case, the price is expected to climb to 151.00, and with strong momentum, to 155.00.
The fundamental picture for the pound remains mixed. On one hand, the market maintains expectations of Bank of England policy easing in the second half of the year amid signs of slowing inflation and weakening economic activity. On the other hand, pressure on the British currency increases due to the strengthening of the US dollar amid the possible continuation of the Fed’s hawkish rhetoric.
Global risks also play an important role, including changes in US trade policy, particularly the imposition of tariffs by the Trump administration, which could potentially boost demand for the dollar as a safe-haven asset and put pressure on developed economy currencies, including the pound.
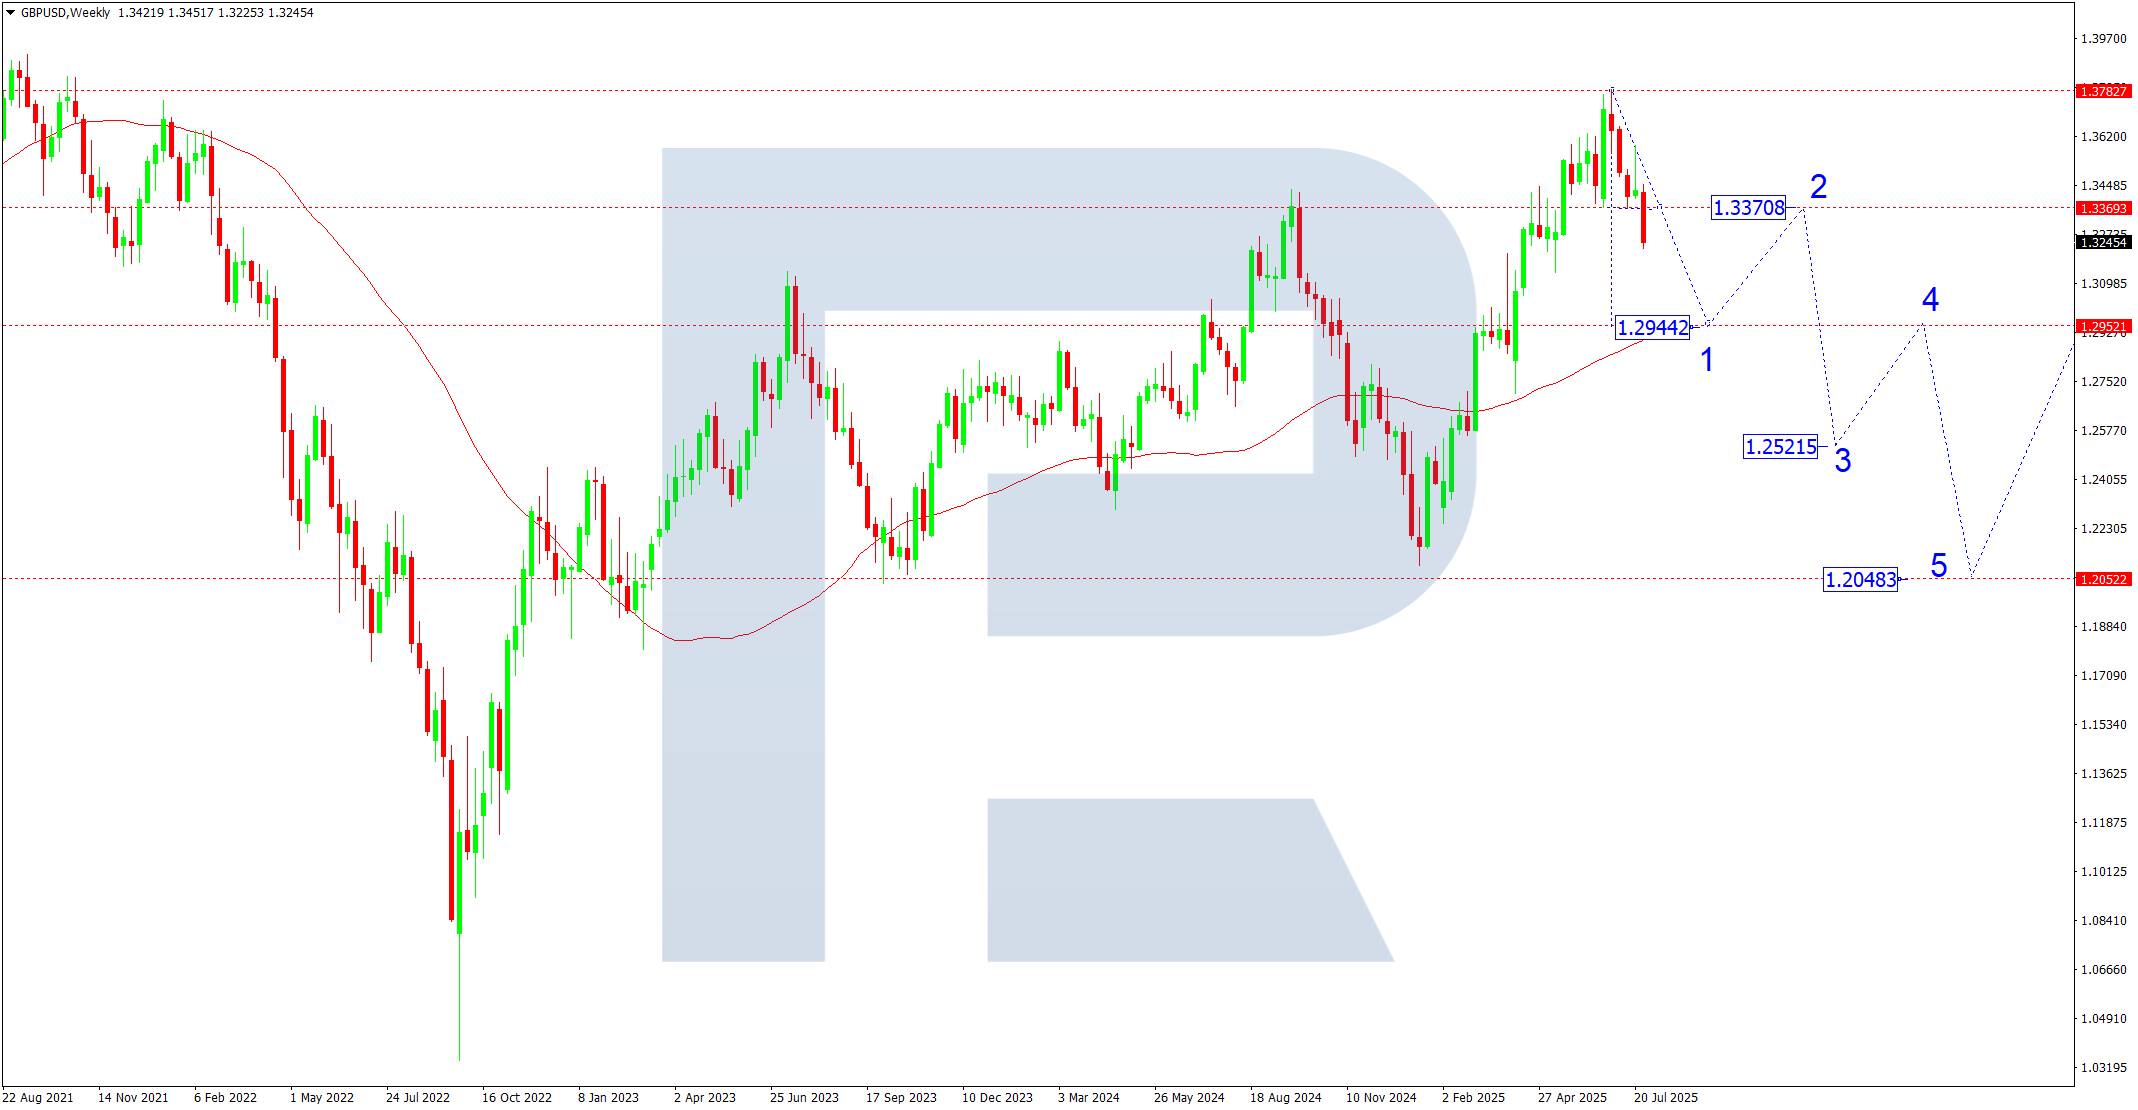
On the weekly chart, the GBPUSD pair has completed a growth wave that began in January 2025 from the 1.2100 level. A consolidation range has formed around 1.3790, structurally resembling a Diamond reversal pattern. The breakout of the 1.3370 level triggered a downward phase with the first target in the 1.2944 zone, where the 50-week Moving Average passes. Local support and a possible rebound within a correction back to 1.3370 (testing from below) are expected here.
If the downward impulse develops, the following targets for this wave become relevant:
GBPUSD forecast scenarios for August 2025
Bearish scenario (base):
Bullish scenario (alternative):
The Australian dollar remains dependent on commodity market dynamics and the prospects of economic growth in China, Australia’s key trading partner. Slowing demand for raw materials puts pressure on AUD.At the same time, the Fed’s hawkish rhetoric and reduced risk appetite amid geopolitical factors and global volatility support interest in the US dollar as a safe-haven asset. The balance between Australia’s export vulnerability and the US economy’s resilience continues to shape a bearish sentiment for AUDUSD.
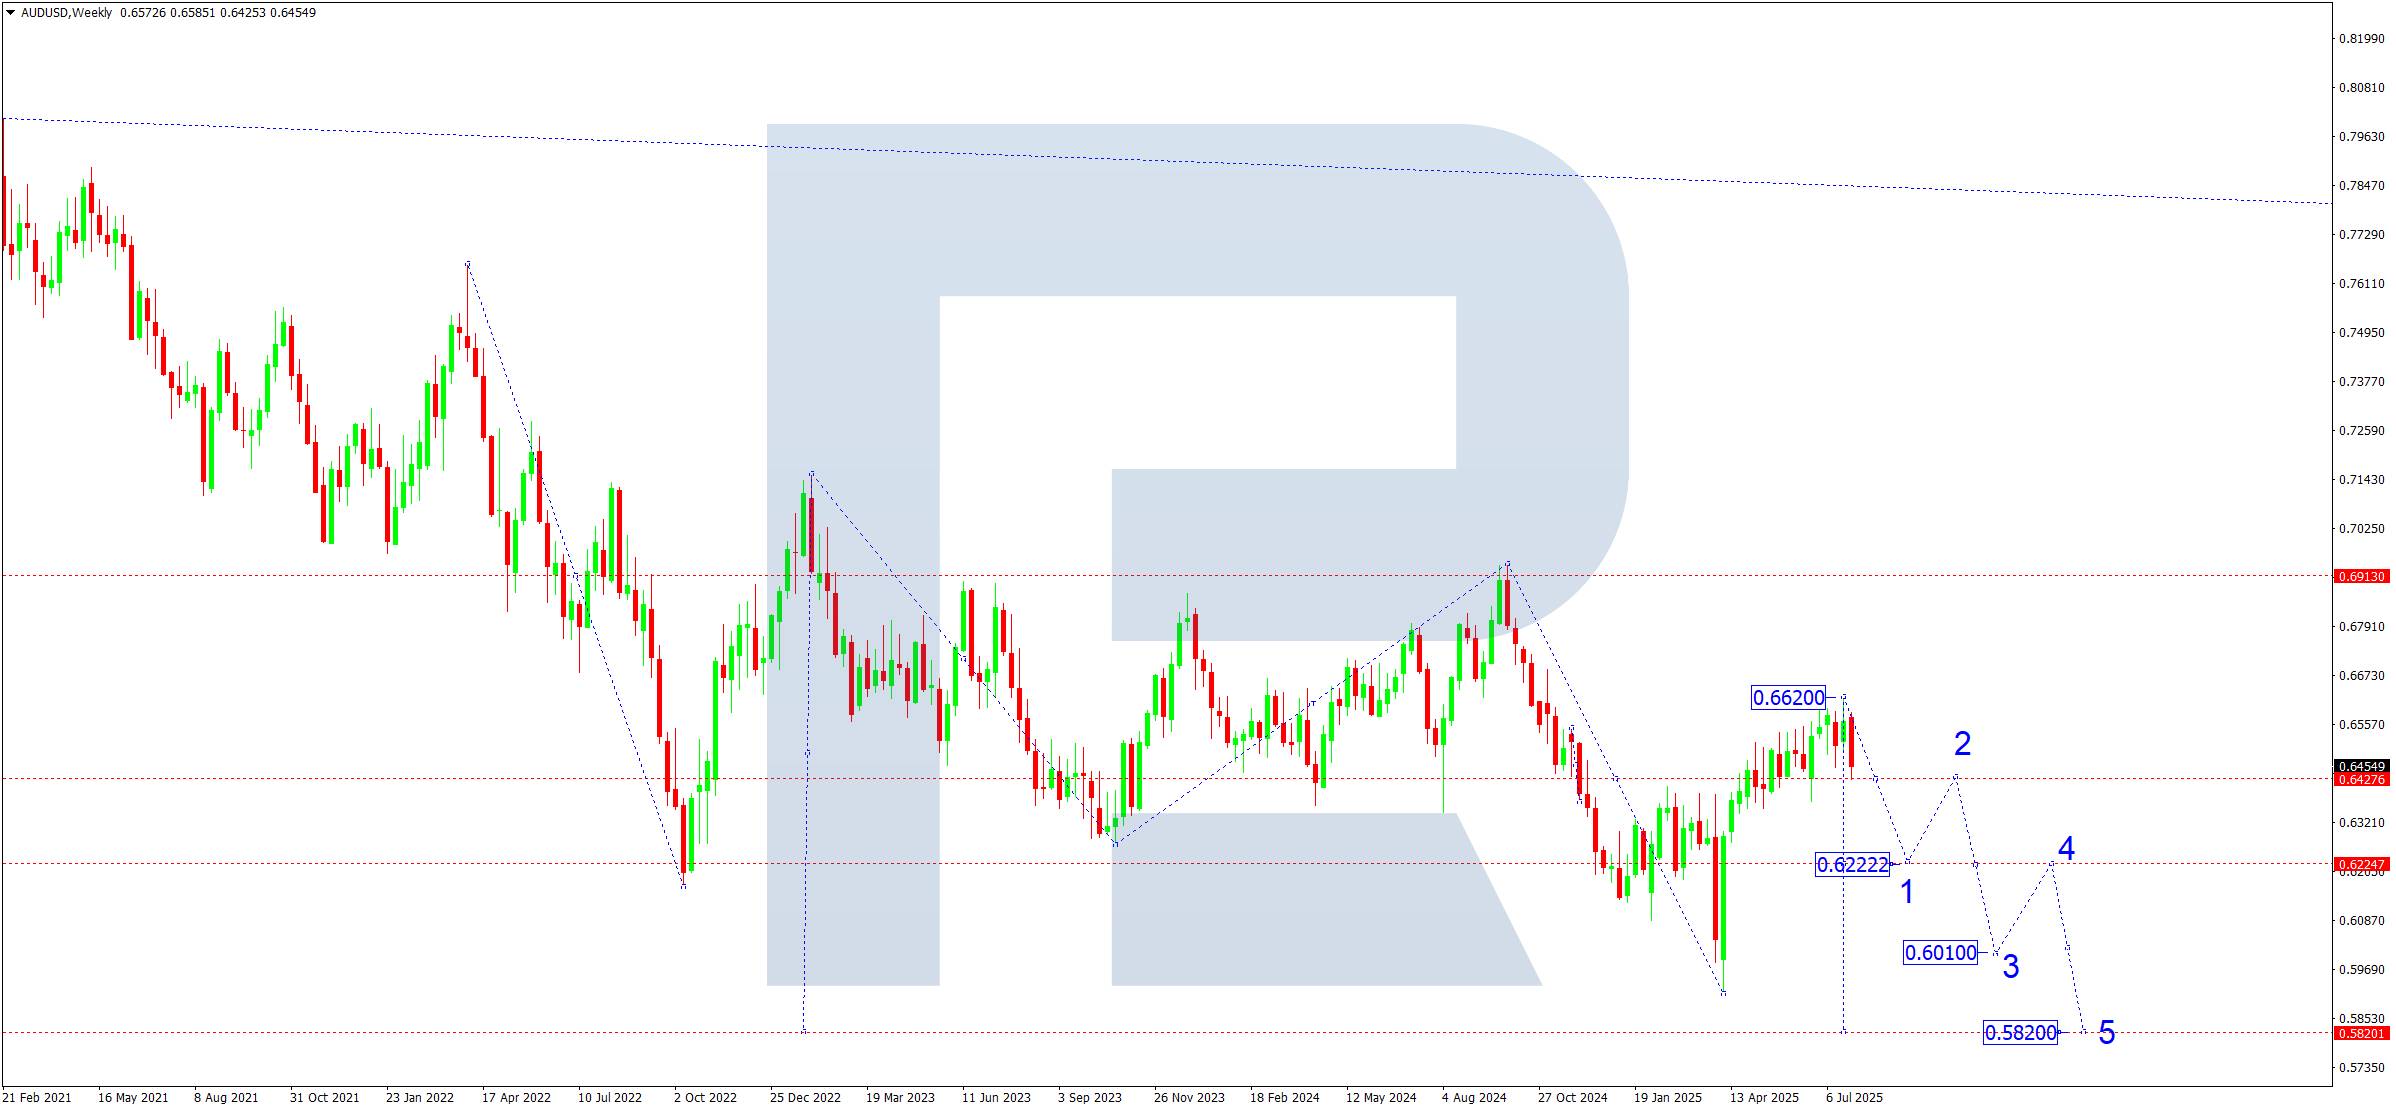
On the weekly chart, the AUDUSD pair completed a corrective move near the 0.6620 level and began to form a new downward wave. The current structure indicates the development of a final fifth wave of decline within a medium-term trend.The key support level is 0.6222, which is seen as the first target for August. A short-term correction to 0.6430 is possible from there. The scenario of a third wave down becomes relevant next, targeting 0.6010, followed by trend extension to the 0.5820 zone.
A consolidation below the SMA50 would confirm dominant bearish sentiment. A breakout below 0.6430 will act as an additional signal of increasing pressure.
AUDUSD forecast scenarios for August 2025
Bearish scenario (primary):
Bullish scenario (alternative):
USDCAD forecast
The USDCAD pair remains under pressure following the end of its upward phase in February 2025, when the rate reached a local peak at 1.4790. Since then, the Canadian dollar has shown steady strengthening, supported by both internal and external factors.
One of the key drivers behind the pair’s decline was the normalisation of trade relations between the US and Canada. The Canadian government made a significant diplomatic gesture by cancelling the planned digital tax, which markets positively interpreted as a sign of readiness for dialogue and de-escalation of trade disputes.This step reduced the likelihood of retaliatory tariffs from the US and thus relieved some pressure on business activity in Canada. Combined with a moderately weakening US dollar, this has supported demand for the CAD.
Market participants are focusing on the upcoming speech by FOMC member Raphael Bostic, who may signal the Fed’s future policy direction. Amid easing inflation and weak employment data, markets are pricing in a higher probability of a US rate cut before the end of Q3 2025. This weakens the dollar and boosts interest in commodity-linked currencies, including the Canadian dollar.
As an oil exporter, Canada receives additional support from stable WTI oil prices. Despite a lack of notable macroeconomic surprises, the Canadian economy shows moderately stable performance: the labour market remains steady, inflation is falling in line with forecasts, and domestic demand remains subdued.The Bank of Canada is expected to keep the rate unchanged in July but may hint at possible easing later in the summer if the Fed takes the first step.
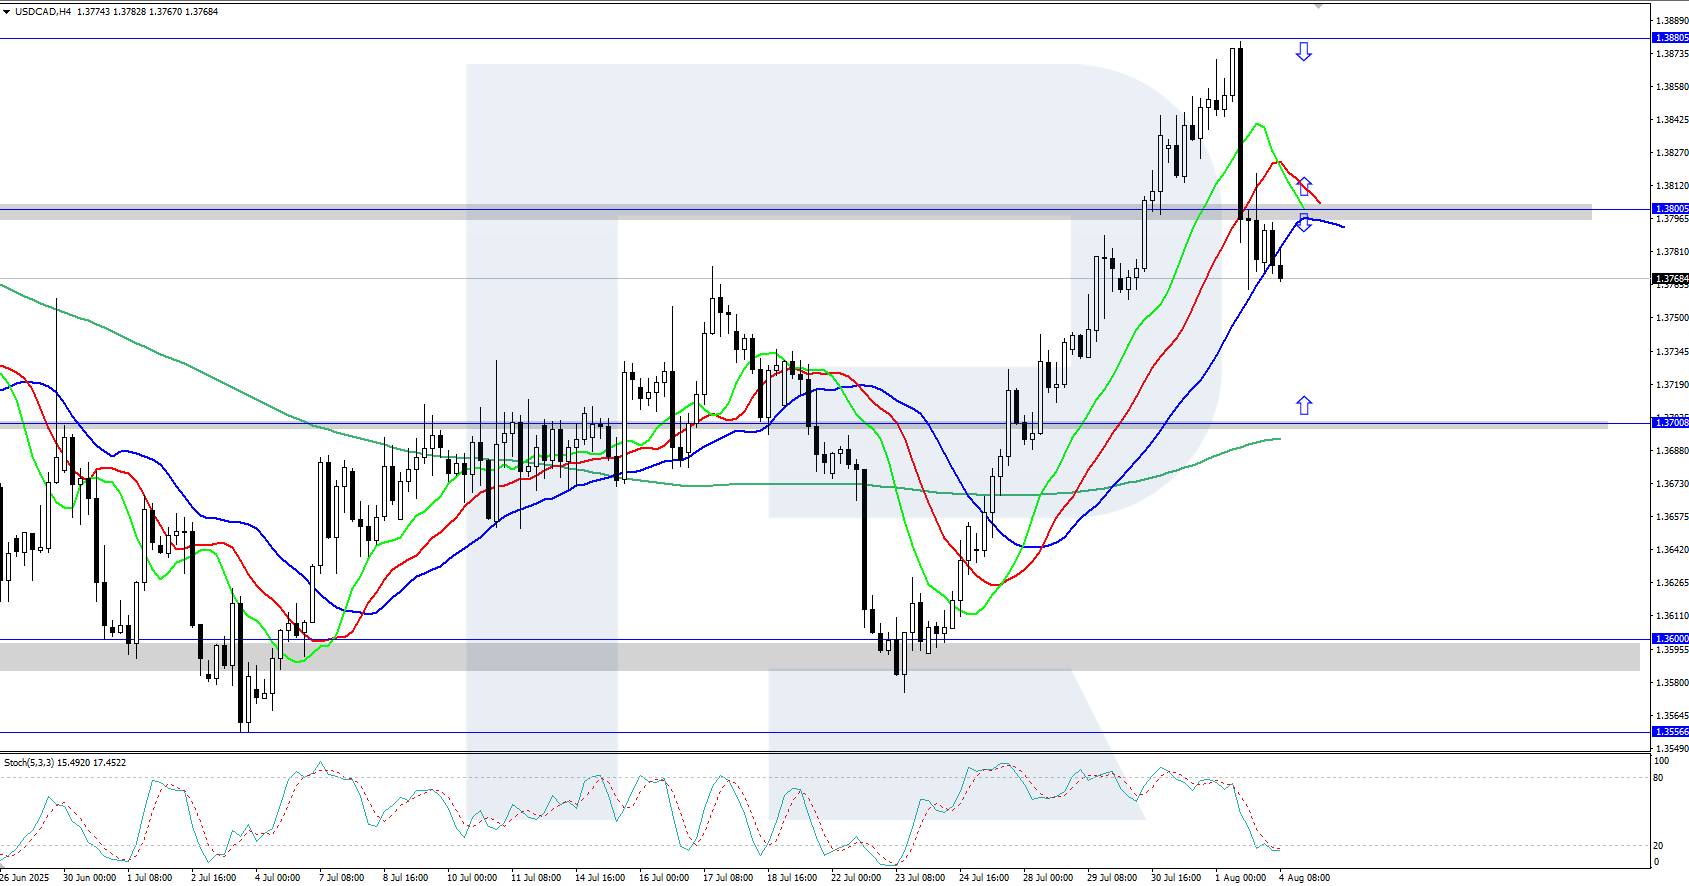
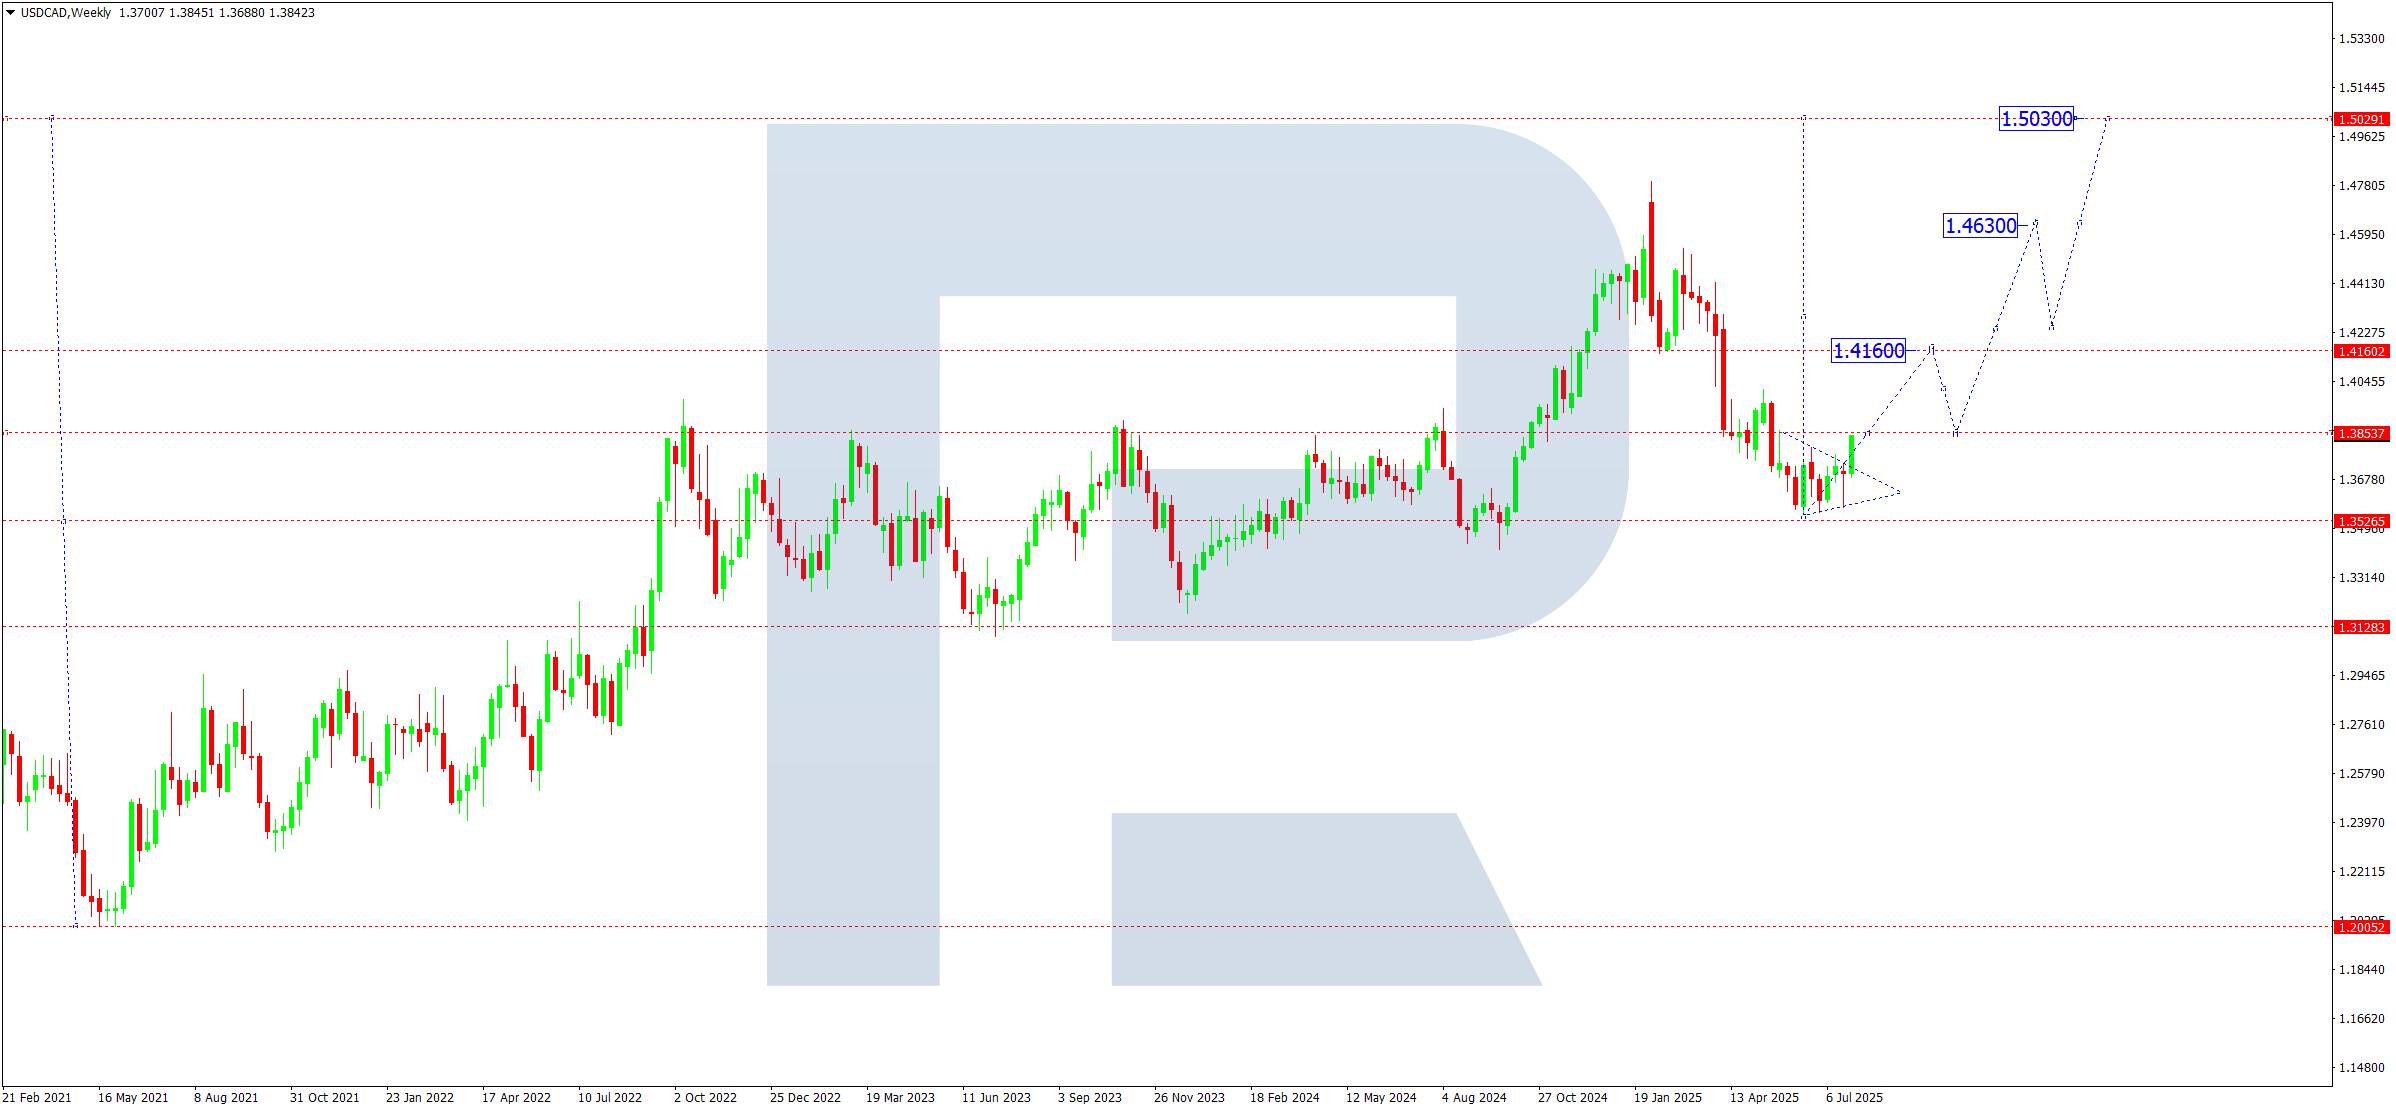
On the weekly chart, the pair rebounded from the key level of 1.4020 (pivot point) and is forming a clear downward structure typical for a third wave of decline. The main target of the current impulse is 1.3500, where a short-term pause and correction are expected.
After reaching this target, a pullback to 1.4020 is possible, which may act as resistance. The trend remains under pressure as the price trades steadily below the SMA50 (Moving Average). Any approach to this average will likely be seen by the market as an opportunity to open new short positions.
If the 1.3500 level is breached, the next targets will be 1.3250 and 1.3100. With increased bearish pressure, a move towards the psychologically significant 1.3000 level is also possible.
Bullish scenario: if the USDCAD pair breaks and consolidates above 1.4020, especially with confirmation on the weekly chart and a move above the SMA50, this will signal a change in the short-term trend. In this case, growth towards 1.4200 is possible.
Bearish scenario: if the 1.4020 level holds, the pair will likely continue its decline towards 1.3250. If this level breaks, the drop may extend to 1.3100 and further to 1.3000. The bearish structure will remain in place as long as the price trades below the SMA50.
The gold market remains sensitive to geopolitical risks, Fed rhetoric, and global macroeconomic uncertainty. The focus is on inflation expectations in the US and Europe, as well as potential interventions by central banks amid a cooling global economy.
The pause in the Fed's rate hike cycle and expectations of possible monetary easing in the second half of the year support investment interest in gold. However, the strengthening of the US dollar and the rise in US Treasury yields temporarily limit the upward momentum.
An additional pressure factor is the political instability associated with the potential return of Trump to power and his protectionist agenda. The imposed tariff restrictions could escalate trade conflicts, which, in turn, may trigger a surge in demand for safe-haven assets, including gold. On the demand side, stability persists: central banks of developing countries continue to increase their gold reserves, and retail demand in Asia remains resilient despite seasonal slowing.
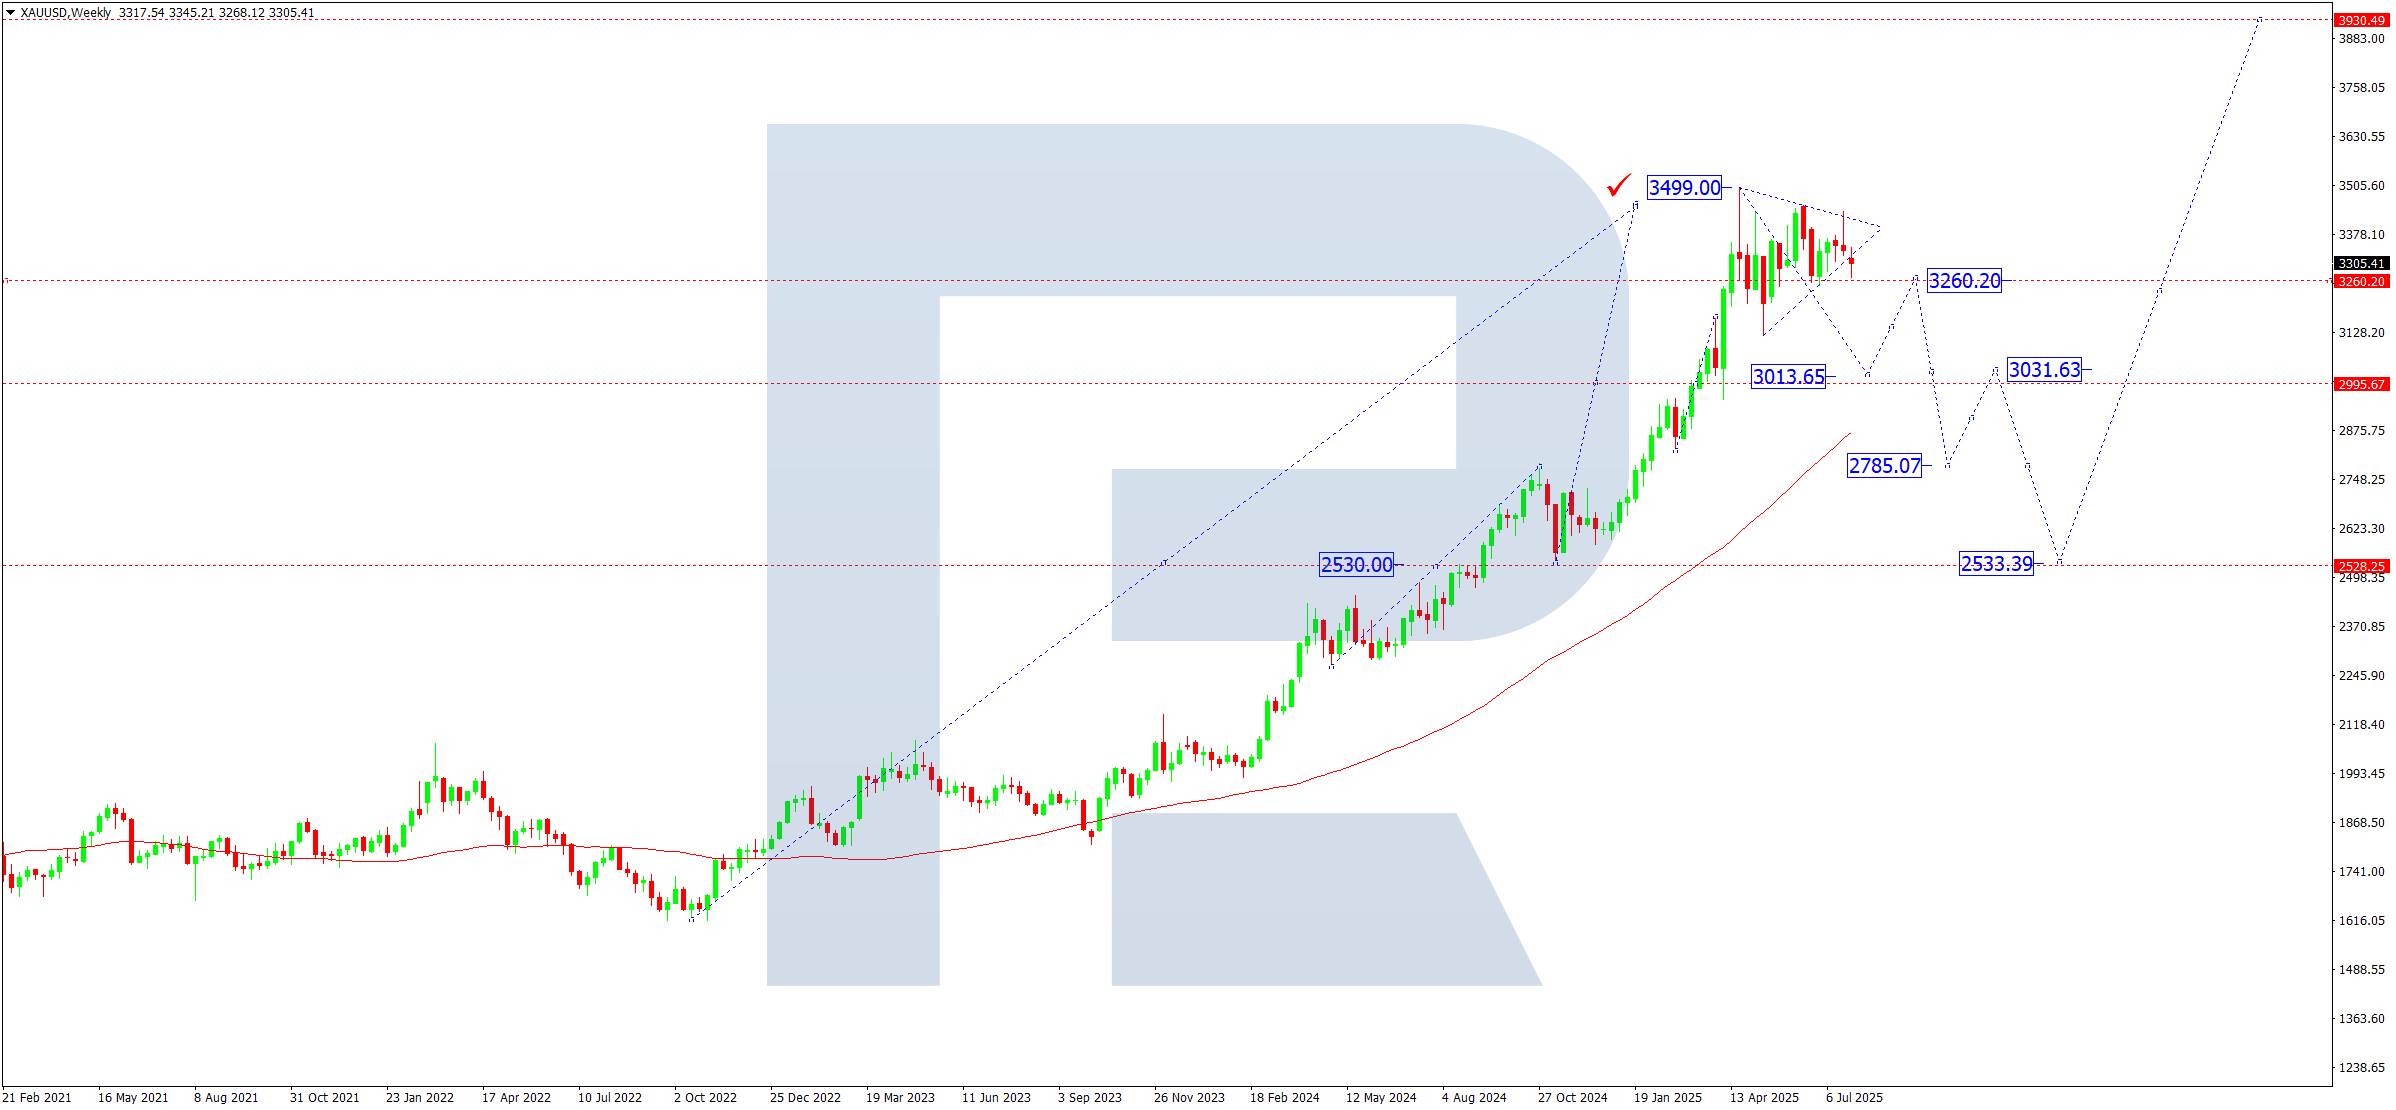
On the weekly chart, a Triangle pattern has formed near the historical high (3,499), indicating a consolidation phase following an extended growth impulse. The 3,120-3,450 range has become a balance zone between supply and demand.
The 3,250 level serves as a local pivot point and a short-term reference level. A breakout below 3,250 would open the path to key support at 3,000, coinciding with the lower boundary of the medium-term balance. At this level also lies the potential target of the first corrective wave – 3,013.
If the price rebounds from the support level, it could form a growth wave towards 3,260 (second target), after which another downward wave towards 2,785 is possible. This scenario aligns with the classic structure of a correction following the completion of the fifth growth wave.
Bearish scenario (base):
A breakout below 3,200 would strengthen correction pressure.
A test of the 3,000 zone may follow. A breakout below this level would open the path to 2,800 and, if selling intensifies, to 2,500, where the price is expected to stabilise and form a base for a new uptrend.
Bullish scenario (alternative):
Stabilisation above 3,200 and a breakout of 3,450 would confirm further upward momentum. In this case, the price could reach an all-time high of 3,500, with targets at 3,750 and 4,000 – the key psychological benchmark for the medium-term growth structure.
The oil market remains in the focus of global macroeconomic expectations and political decisions of major producers. The main driver continues to be the behaviour of OPEC+ and demand from China and developing economies amid signs of a slowdown in the industrial sector in Europe and the US.The US labour market remains resilient; however, recession risks in the global economy and a decline in energy consumption exert moderate pressure on oil prices. At the same time, the US dollar remains strong, which reduces oil demand from countries with emerging market currencies.
The political factor has strengthened: the possible return of Donald Trump and his promises to tighten sanctions against Iran and Venezuela increase uncertainty. Such measures could limit supply and support prices in the medium term.In addition, the decline in commercial inventories in the US and signals of production cuts from Saudi Arabia and Russia form a fundamental basis for maintaining the uptrend, especially if key resistance levels are breached.
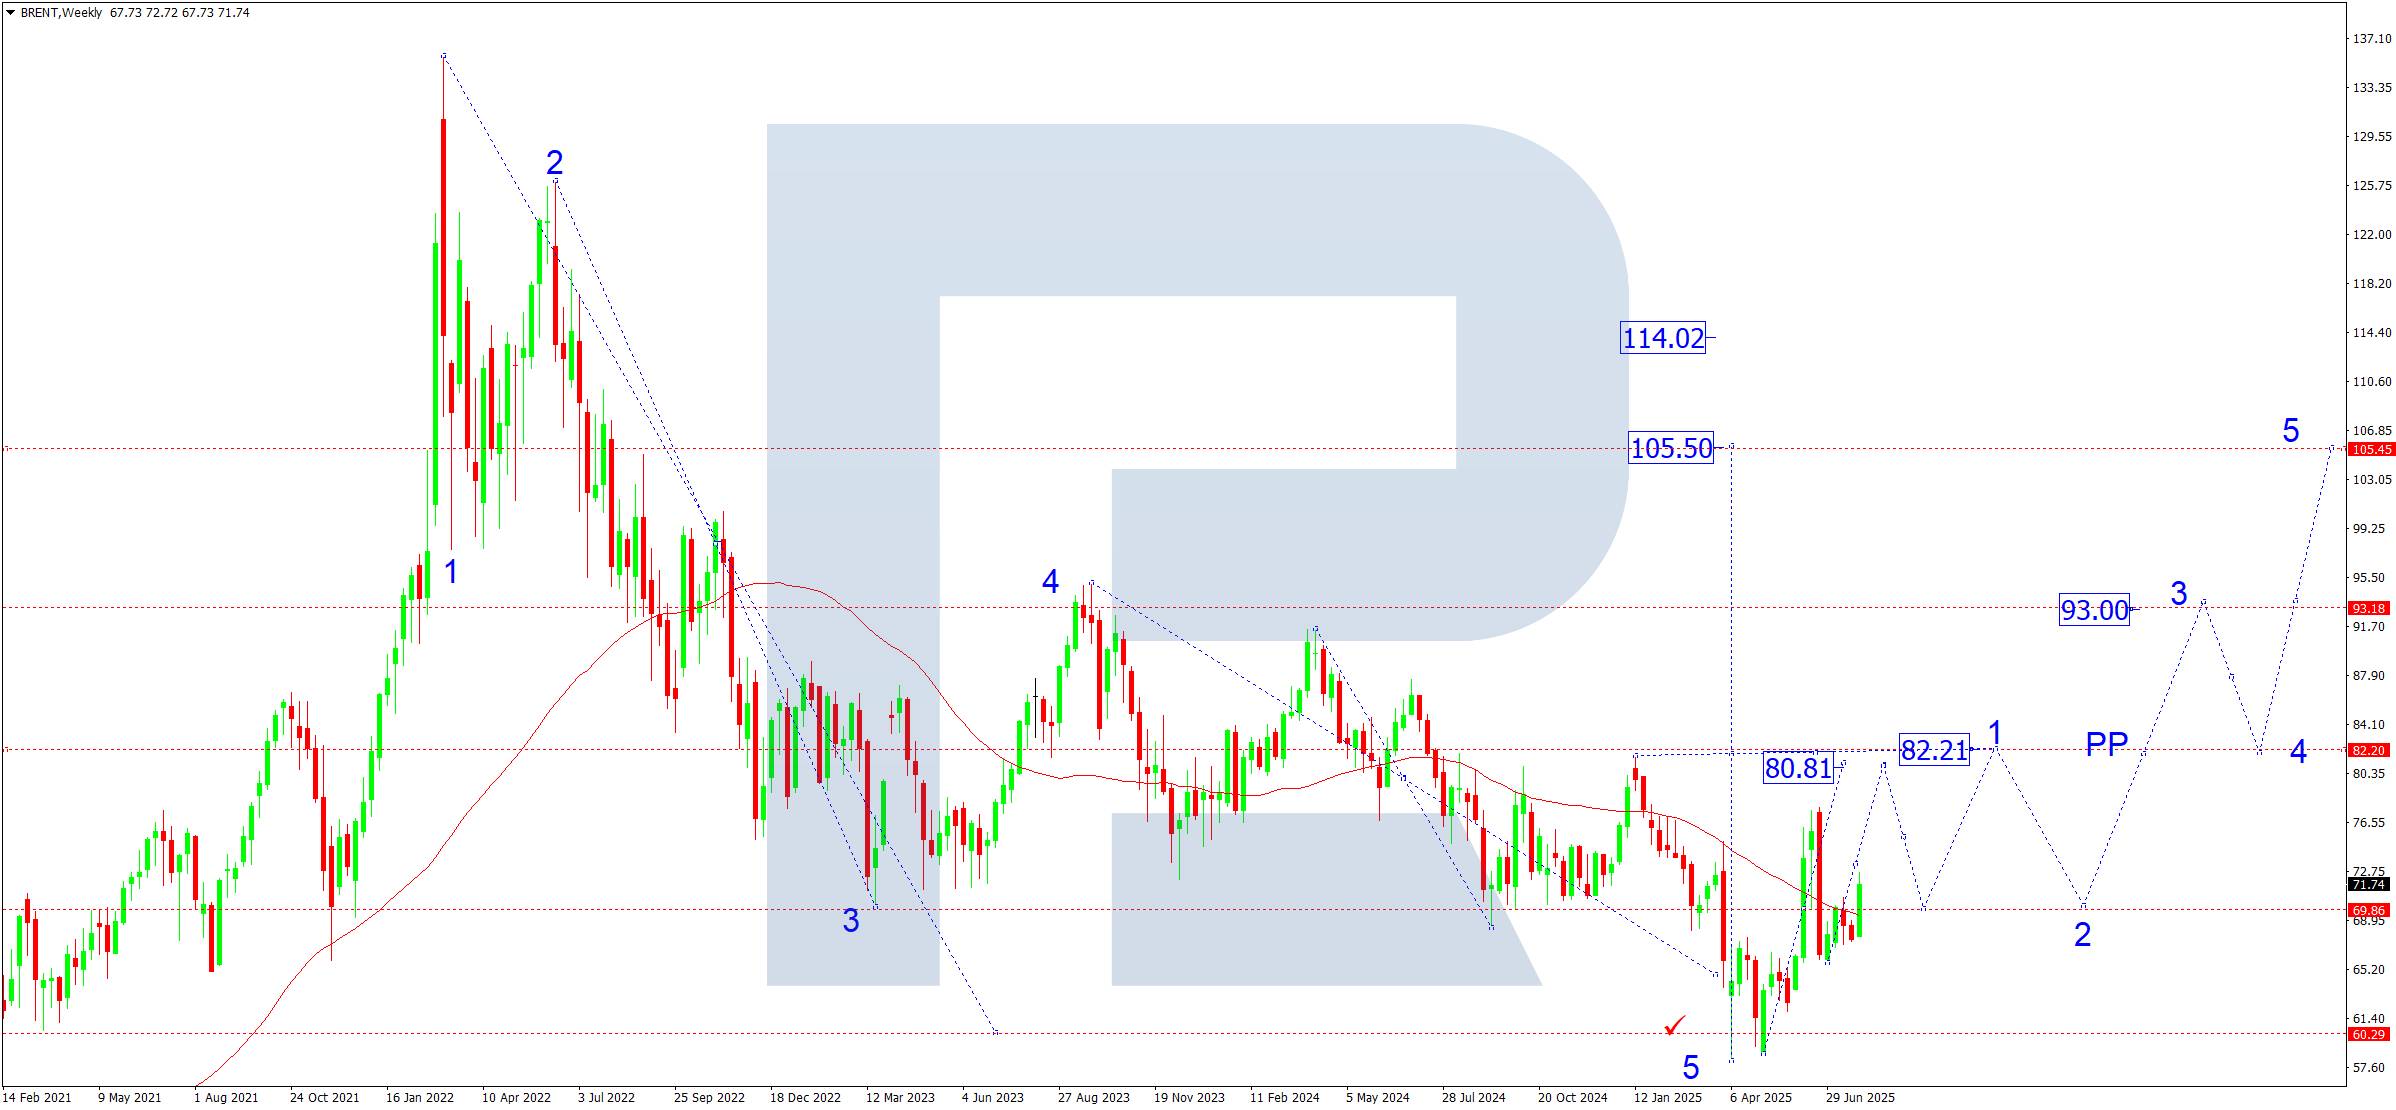
On the weekly chart, Brent crude is forming a stable upward structure. After stabilising in the 70.00 zone, the market is heading towards the first target at 82.20; a breakout of this level would open the path to 93.00 (second target). The upward impulse is expected to continue within the fifth wave of growth, with a target at 105.50.The 70.00 level acts as a key support zone and the balance of the medium-term range, where the SMA50 Moving Average also lies, adding significance to this area. If the price consolidates above it, this will confirm the medium-term growth scenario.
In case of a pullback, a correction may form towards 70.00, and under negative factors, the price could fall to the 66.00 area. A breakout of this zone may send the price to the psychologically important level of 60.00, which has historically served as a fundamental bottom and area of interest for exporting countries.
Brent forecast scenarios for August 2025
Bullish scenario (base):
If the price holds above 70.00 and breaks above the 82.20 resistance level, this would activate the next growth wave, with targets at 93.00 and 105.50, the upper boundary of the potential fifth wave. An increase in geopolitical risks and new restrictions from OPEC+ may accelerate the uptrend.
Bearish scenario (alternative):
In case of weak macroeconomic statistics, especially from China, and a lack of support from OPEC+, oil may return to the 68.00-65.00 range. A breakout below 65.00 would open the way for a move towards 60.00, a level near the profitability threshold for a number of exporters and traditionally serving as a turning point on long-term charts.
728 RM B 7/F GEE LOK IND BLDG NO 34 HUNG TO RD KWUN TONG KLN HONG KONG


The risk of loss in trading financial instruments such as stocks, FX, commodities, futures, bonds, ETFs and crypto can be substantial. You may sustain a total loss of the funds that you deposit with your broker. Therefore, you should carefully consider whether such trading is suitable for you in light of your circumstances and financial resources.
No decision to invest should be made without thoroughly conducting due diligence by yourself or consulting with your financial advisors. Our web content might not suit you since we don't know your financial conditions and investment needs. Our financial information might have latency or contain inaccuracy, so you should be fully responsible for any of your trading and investment decisions. The company will not be responsible for your capital loss.
Without getting permission from the website, you are not allowed to copy the website's graphics, texts, or trademarks. Intellectual property rights in the content or data incorporated into this website belong to its providers and exchange merchants.
Not Logged In
Log in to access more features

FastBull Membership
Not yet
Purchase


Log In
Sign Up