Markets
News
Analysis
User
24/7
Economic Calendar
Education
Data
- Names
- Latest
- Prev


Signal Accounts for Members
All Signal Accounts
All Contests


France Trade Balance (SA) (Oct)A:--
F: --
Euro Zone Employment YoY (SA) (Q3)A:--
F: --
Canada Part-Time Employment (SA) (Nov)A:--
F: --
P: --
Canada Unemployment Rate (SA) (Nov)A:--
F: --
P: --
Canada Full-time Employment (SA) (Nov)A:--
F: --
P: --
Canada Labor Force Participation Rate (SA) (Nov)A:--
F: --
P: --
Canada Employment (SA) (Nov)A:--
F: --
P: --
U.S. PCE Price Index MoM (Sept)A:--
F: --
P: --
U.S. Personal Income MoM (Sept)A:--
F: --
P: --
U.S. Core PCE Price Index MoM (Sept)A:--
F: --
P: --
U.S. PCE Price Index YoY (SA) (Sept)A:--
F: --
P: --
U.S. Core PCE Price Index YoY (Sept)A:--
F: --
P: --
U.S. Personal Outlays MoM (SA) (Sept)A:--
F: --
U.S. 5-10 Year-Ahead Inflation Expectations (Dec)A:--
F: --
P: --
U.S. Real Personal Consumption Expenditures MoM (Sept)A:--
F: --
U.S. Weekly Total Rig CountA:--
F: --
P: --
U.S. Weekly Total Oil Rig CountA:--
F: --
P: --
U.S. Consumer Credit (SA) (Oct)A:--
F: --
China, Mainland Foreign Exchange Reserves (Nov)A:--
F: --
P: --
Japan Trade Balance (Oct)A:--
F: --
P: --
Japan Nominal GDP Revised QoQ (Q3)A:--
F: --
P: --
China, Mainland Imports YoY (CNH) (Nov)A:--
F: --
P: --
China, Mainland Exports (Nov)A:--
F: --
P: --
China, Mainland Imports (CNH) (Nov)A:--
F: --
P: --
China, Mainland Trade Balance (CNH) (Nov)A:--
F: --
P: --
China, Mainland Exports YoY (USD) (Nov)A:--
F: --
P: --
China, Mainland Imports YoY (USD) (Nov)A:--
F: --
P: --
Germany Industrial Output MoM (SA) (Oct)A:--
F: --
Euro Zone Sentix Investor Confidence Index (Dec)A:--
F: --
P: --
Canada National Economic Confidence IndexA:--
F: --
P: --
U.K. BRC Like-For-Like Retail Sales YoY (Nov)--
F: --
P: --
U.K. BRC Overall Retail Sales YoY (Nov)--
F: --
P: --
Australia Overnight (Borrowing) Key Rate--
F: --
P: --
RBA Rate Statement
RBA Press Conference
Germany Exports MoM (SA) (Oct)--
F: --
P: --
U.S. NFIB Small Business Optimism Index (SA) (Nov)--
F: --
P: --
Mexico 12-Month Inflation (CPI) (Nov)--
F: --
P: --
Mexico Core CPI YoY (Nov)--
F: --
P: --
Mexico PPI YoY (Nov)--
F: --
P: --
U.S. Weekly Redbook Index YoY--
F: --
P: --
U.S. JOLTS Job Openings (SA) (Oct)--
F: --
P: --
China, Mainland M1 Money Supply YoY (Nov)--
F: --
P: --
China, Mainland M0 Money Supply YoY (Nov)--
F: --
P: --
China, Mainland M2 Money Supply YoY (Nov)--
F: --
P: --
U.S. EIA Short-Term Crude Production Forecast For The Year (Dec)--
F: --
P: --
U.S. EIA Natural Gas Production Forecast For The Next Year (Dec)--
F: --
P: --
U.S. EIA Short-Term Crude Production Forecast For The Next Year (Dec)--
F: --
P: --
EIA Monthly Short-Term Energy Outlook
U.S. API Weekly Gasoline Stocks--
F: --
P: --
U.S. API Weekly Cushing Crude Oil Stocks--
F: --
P: --
U.S. API Weekly Crude Oil Stocks--
F: --
P: --
U.S. API Weekly Refined Oil Stocks--
F: --
P: --
South Korea Unemployment Rate (SA) (Nov)--
F: --
P: --
Japan Reuters Tankan Non-Manufacturers Index (Dec)--
F: --
P: --
Japan Reuters Tankan Manufacturers Index (Dec)--
F: --
P: --
Japan Domestic Enterprise Commodity Price Index MoM (Nov)--
F: --
P: --
Japan Domestic Enterprise Commodity Price Index YoY (Nov)--
F: --
P: --
China, Mainland PPI YoY (Nov)--
F: --
P: --
China, Mainland CPI MoM (Nov)--
F: --
P: --


No matching data
Latest Views
Latest Views
Trending Topics
Top Columnists
Latest Update
White Label
Data API
Web Plug-ins
Affiliate Program
View All

No data
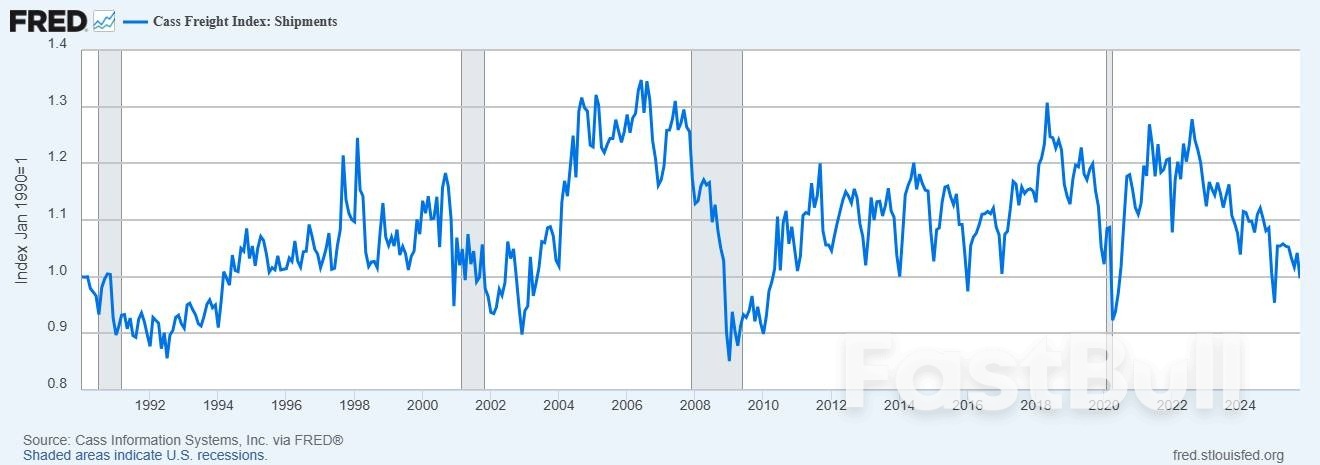
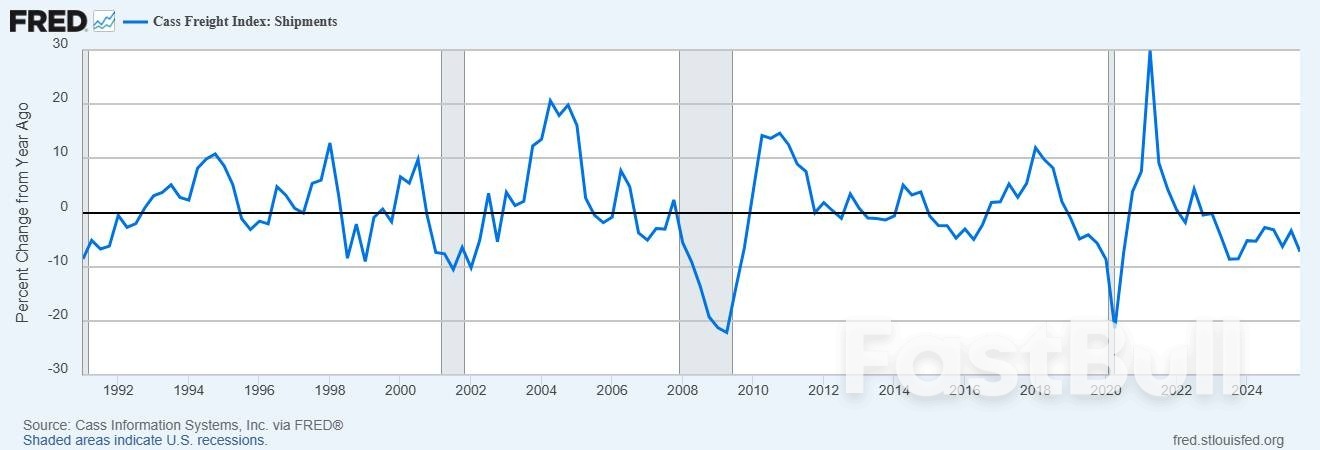
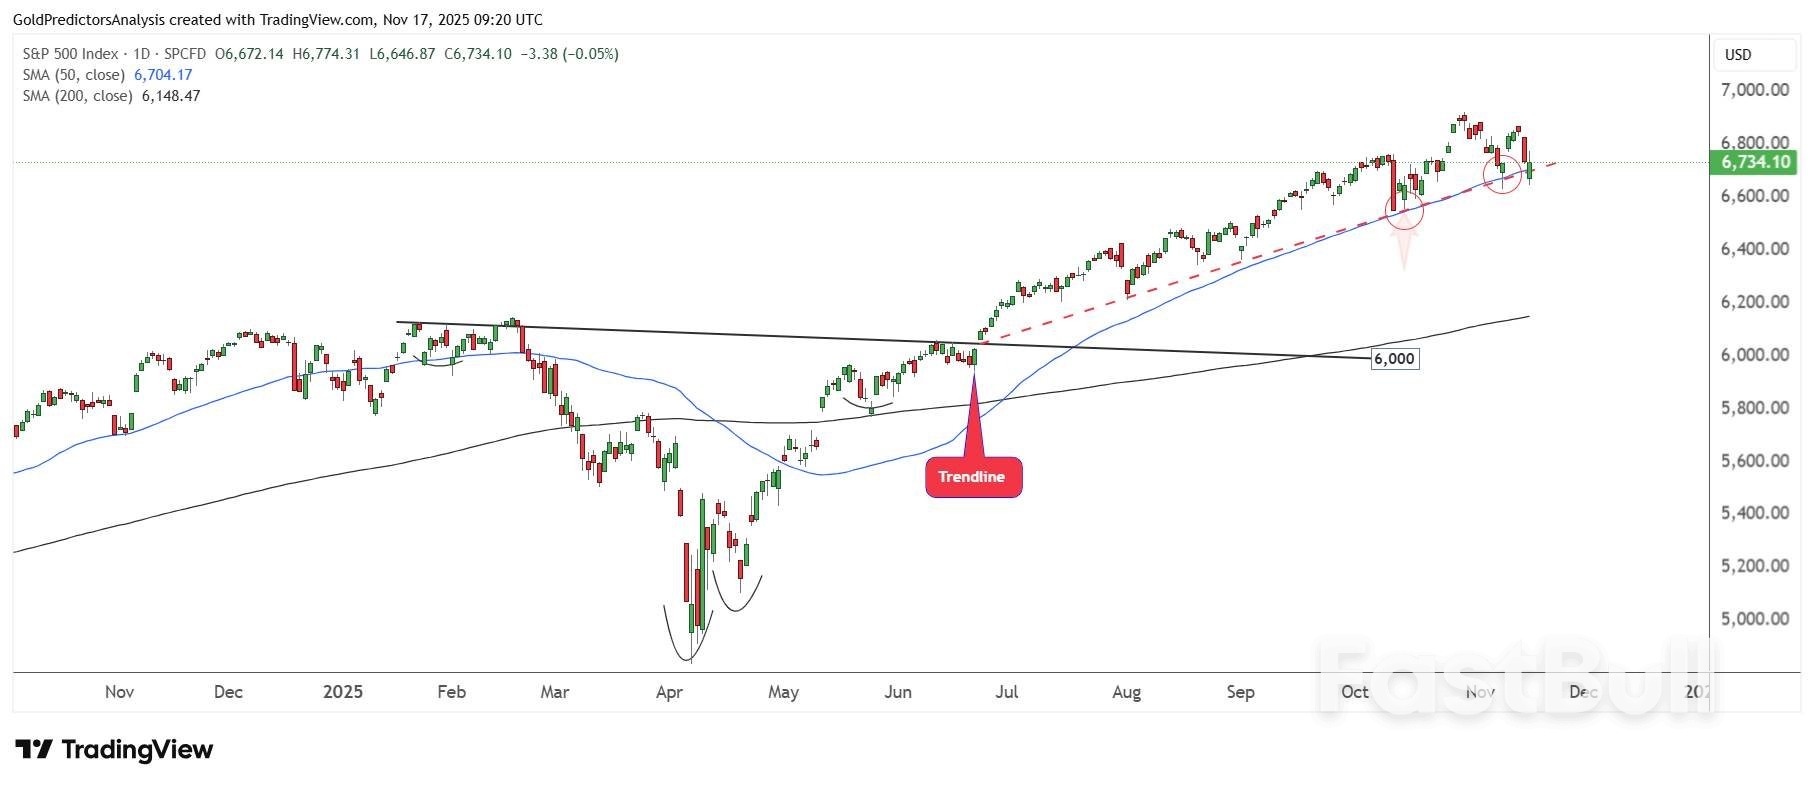
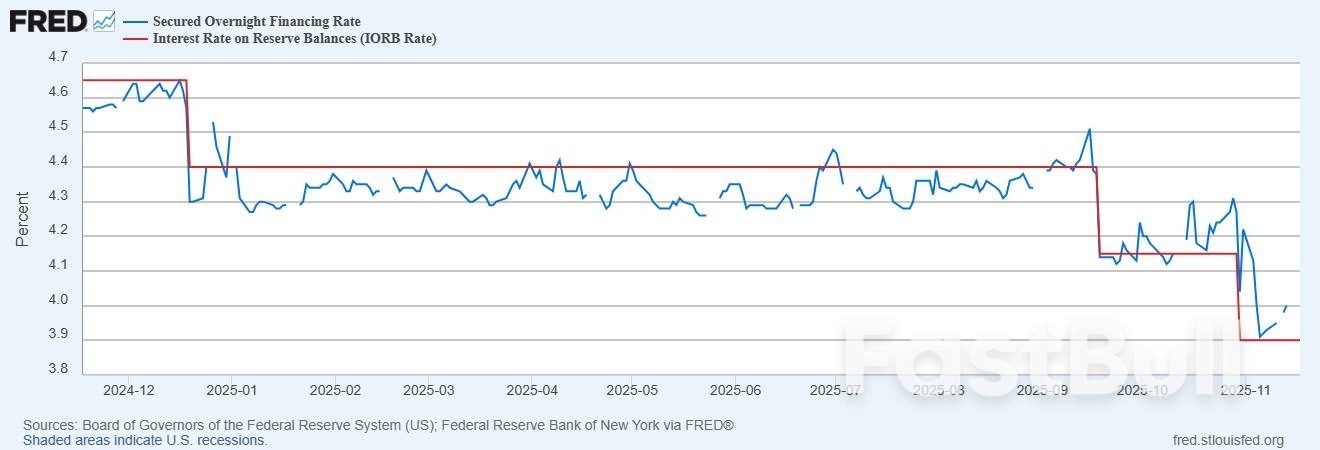
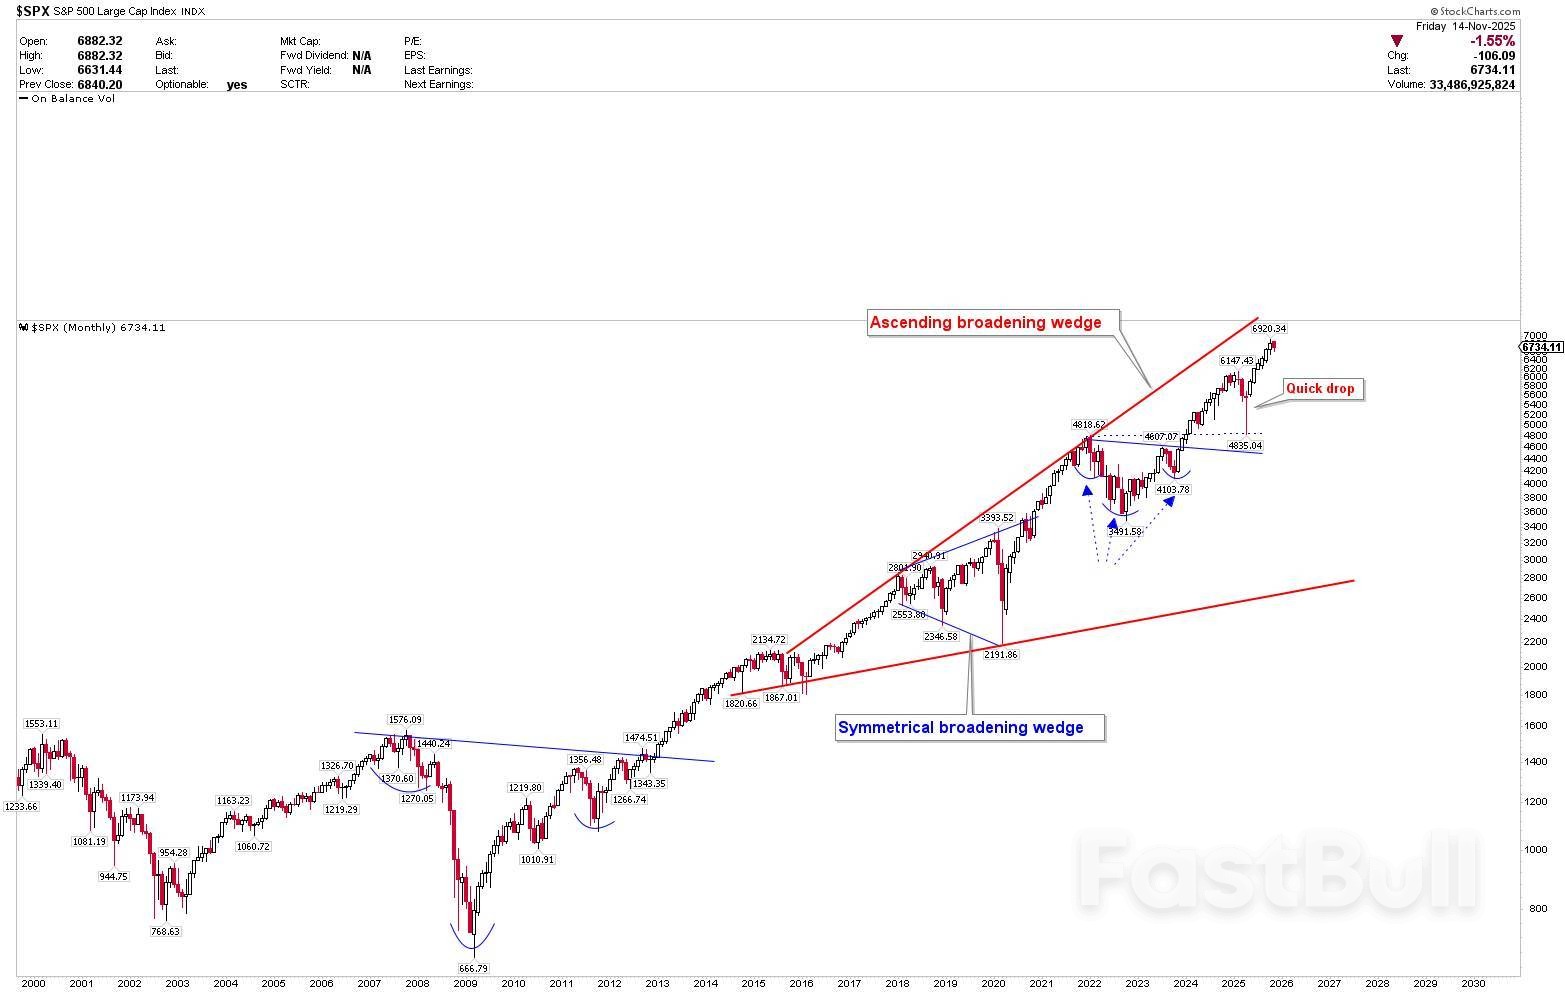
Markets face a pivotal week as U.S. data releases resume, Nvidia earnings loom, and recession fears rise. Sector rotation intensifies, China’s recovery wavers, Bitcoin hits six-month lows, and major indices test key technical levels.
as of 16 Nov 2025. Past performance is not a reliable indicator of future performance.
as of 14 Nov 2025. Past performance is not a reliable indicator of future performance.


Binance BTC/USDT order-book data. Source: BitBull/X
BTC/USDT four-hour chart. Source: Michaël van de Poppe/X


Crypto total market cap four-hour chart. Source: The Kobeissi Letter/X
Bitcoin vs. Nasdaq correlation. Source: The Kobeissi Letter/X
Crypto Fear & Greed Index (screenshot). Source: Alternative.me
Canada inflation cooled by less than expected last month, supporting the Bank of Canada's move to the sidelines after back-to-back rate cuts.
Headline inflation decelerated to 2.2% in October, Statistics Canada data showed Monday, driven by a faster yearly decrease in gasoline costs.
That's above the median projection in a Bloomberg survey of economists, who were expecting yearly price pressures to slow to a 2.1% yearly clip, from 2.4% in September.
On a monthly basis, the consumer price index rose by 0.2%, matching expectations.
The report showed conflicting signals for core inflation. The Bank of Canada's trim and median gauges decelerated to at 2.95% yearly clip, from 3.1% previous. On a three-month moving annualized basis, those measures slowed to 2.6%, from 2.7% in September.
The breadth of inflationary pressures also narrowed, with about 34% of items in the consumer price index rising above a 3% yearly pace, from 38% previously.
But excluding food and energy, prices rose 2.7% from a year earlier, up from 2.4% in September. The bank's previous measure of core inflation -- CPI excluding eight volatile components and indirect taxes -- also accelerated to 2.9%.
Combined, the report shows headline inflation trending back towards the central bank's 2% target, but core measures are sticking in the top part of policymaker's control band for price pressures.
Officials led by Governor Tiff Macklem cut interest rates to 2.25% last month as the economy continues to take damage from the trade war, but signaled reluctance to ease borrowing costs further, saying their ability to help the economy was limited by the potential for higher inflation stemming from the trade dispute.
Policymakers said rates were at "about the right level" as long as the economy and inflation evolved in line with their expectations.
Shelter prices were a major contributor to monthly price pressures, rising 0.6% and driven by rental costs and insurance. On a yearly basis, shelter is up 2.5% from a year earlier.
Food prices fell 0.3% on the month, but are up 3.4% on the year.
In recent months, the bank warned that markets may be putting too much emphasis on its two "preferred" core inflation measures, the so-called trim and median gauges.
Japanese artificial intelligence startup Turing has partnered with auto parts giant Denso and is in talks with several major automakers to jointly develop fully autonomous vehicles, after securing 9.77 billion yen ($63 million) in fresh equity funding, its chief executive told Nikkei Asia.
The Tokyo-based company completed the first close of its fundraising round led by state-backed Japan Investment Corp. and local venture capital firm Global Brain. Other participants included GMO Internet Group, Mitsui Fudosan and Denso. According to people familiar with the deal, this brings Turing's post-money valuation to about 60 billion yen, roughly four times the size after the previous fundraising last year.
Turing will now court overseas investors as it accelerates development of full self-driving software, targeting commercial deployment by 2030. The startup has also secured a 5.5 billion yen syndicated loan from Mizuho Bank, Resona Bank and several regional lenders.
CEO Kazunari Yamamoto said the new financing will expand the company's R&D efforts, enabling longer on-road tests and helping it gather higher-quality driving data across Japan.
"The key is how we can catch up with the leading players in a capital-efficient manner," said Yamamoto, the creator of the AI program Ponanza, which defeated several of the country's top players of shogi, or Japanese chess. Turing is also in talks with additional Japanese automakers for partnerships, though Yamamoto declined to name them.
Turing is looking to expand on-road testing of its self-driving technology beyond Tokyo. (Turing)Founded in 2021, Turing is one of Japan's few startups building autonomous systems for passenger cars. While most domestic projects focus on buses or commercial vehicles running fixed routes, Turing is targeting the much larger consumer market.
The company belongs to the "end-to-end" camp of self-driving technology development, in which generative AI handles everything from taking in information from camera images to issuing driving commands. This contrasts with the traditional approach that relies on multiple modules, such as light detection and ranging, or LiDAR, sensors, to take in data and rules-based algorithms to produce commands.
Turing argues that generative AI is better at handling rare or unpredictable road situations, such as temporary construction signs or pedestrians on narrow streets, and believes the method will be essential to achieving full autonomy.
Despite recent progress, Yamamoto acknowledges that overseas rivals remain ahead. Turing recently completed level-2 autonomous driving -- in which drivers keep their hands on the wheel and prepare to control the vehicle as needed -- on public roads in Tokyo. It plans to expand trial sites beyond the capital to diversify its training data.
Momentum among Japanese automakers to prioritize self-driving software is rising, Yamamoto said, driven by a "sense of urgency" as Tesla and Chinese players like WeRide and Huawei rapidly advance their capabilities. Tesla also began testing level-2 autonomous driving on public roads in Japan this year.
Japan's auto industry is facing intensifying competition not only in electric vehicles but also in software. As geopolitical and security concerns grow, the country is under increasing pressure to secure its own technological base. Turing is among the startups and enterprises selected for a national program to develop domestically built AI, positioning it as a key player in this effort.
Beyond strengthening its AI model, Yamamoto said that a major challenge for mass deployment is aligning with each automaker's certification and safety standards. "When making cars AI-centric, relying on conventional safety checks and scenario tests alone is no longer sufficient," he said.

The economic calendar MarketWatch provides is one of the most reliable tools for tracking major financial events and market-moving indicators. From interest rate decisions to CPI, GDP, and employment reports, traders rely on this calendar to prepare for volatility and plan entries with better timing. This guide explains how to use it effectively in 2025.
Economic calendars help traders anticipate market volatility by tracking scheduled data releases such as GDP, CPI, interest rate decisions, and employment reports. Tools like the economic calendar MarketWatch publishes allow investors to prepare strategies ahead of major announcements that influence stocks, forex, bonds, and commodities.
The MarketWatch economic calendar highlights major U.S. and global indicators with clear time stamps, impact levels, and forecast versus actual values. It is widely used by traders who want simple navigation and reliable data updated throughout the day.
MarketWatch pulls economic releases from official institutions such as the U.S. Bureau of Labor Statistics, Federal Reserve, and international government agencies. Data is refreshed in real time as soon as the official releases are published, making the marketwatch.com economic calendar a dependable reference for time-sensitive trading.
Unlike platforms that focus heavily on forex or crypto, MarketWatch emphasizes U.S. macroeconomic releases, making it especially useful for traders tracking the S&P 500, Dow Jones, U.S. Treasury yields, and USD-related markets. It offers a cleaner interface compared to forex-focused calendars and is preferred for its media-style presentation.
You can access the MarketWatch US economic calendar directly from the main site. Navigation is simple and works on both desktop and mobile.
The calendar includes several key columns that help traders interpret macro data efficiently. Understanding these fields allows you to forecast volatility and compare the market’s expectations to real outcomes.
| Column | Meaning |
|---|---|
| Time | Event release time in Eastern Time (ET), essential for global traders. |
| Event | The name of the economic indicator such as CPI, NFP, PMI, or GDP. |
| Impact | Shows expected volatility: High, Medium, or Low. |
| Previous | Last month or last period’s result. |
| Forecast | Market expectation before the event releases. |
| Actual | The real number released at the scheduled time. |
These components are essential whether you use the economic calendar MarketWatch offers or other mainstream calendars.
One of the standout strengths of the MarketWatch weekly economic calendar is its real-time update mechanism. As soon as official agencies publish new data, MarketWatch updates the calendar instantly, letting traders react without delay.
Although the MarketWatch economic calendar offers simpler filtering than forex-oriented tools, it still provides essential features to organize events efficiently. This is useful for traders who want quick access to U.S.-focused releases or specific event categories.
These filters help personalize your calendar view when using the marketwatch.com economic calendar across different trading styles.
The MarketWatch economic calendar is designed to help traders quickly understand key financial events and their expected market influence. Each row shows an event, its scheduled time, forecast figures, and the actual numbers once released. Knowing how to read these columns allows traders to anticipate price volatility and plan positions more effectively.
Impact levels help traders identify which economic events matter most. The economic calendar MarketWatch displays uses simple importance labels to show expected volatility. High-impact events typically cause strong market reactions in stocks, forex, and commodities, while lower-impact events might produce smaller intraday shifts.
These levels help users of the MarketWatch US economic calendar prioritize which events deserve deeper attention or risk management planning.
Forecast and actual values determine how markets react after an economic release. Large deviations typically trigger strong moves. Traders who rely on the MarketWatch weekly economic calendar use these figures to anticipate volatility immediately after data is published.
Understanding these gaps is essential when using real-time data from the MarketWatch economic calendar for active trading decisions.
The economic calendar MarketWatch highlights a range of indicators, but some consistently move global markets. These events affect currencies, interest rates, stocks, and bonds, making them essential for both day traders and long-term investors.
FOMC meetings and speeches from Federal Reserve officials are among the most influential events on the MarketWatch US economic calendar. These updates provide insights into future interest rate decisions and policy shifts, which directly influence USD pairs, equities, and Treasury yields.
Employment indicators often trigger the strongest short-term volatility. The marketwatch.com economic calendar clearly marks these releases as high impact due to their direct link to economic strength and Federal Reserve policy decisions.
Inflation data plays a dominant role in financial markets. Traders use the MarketWatch weekly economic calendar to track these releases because they strongly influence interest rate expectations, bond yields, and sector performance.
GDP and retail sales provide broader insights into economic momentum. These indicators influence risk sentiment and help traders adjust exposure to equities, currencies, and commodities.
The economic calendar MarketWatch provides can be integrated into multiple trading strategies. Whether you are a day trader focusing on short-term volatility or an investor reacting to macroeconomic cycles, the calendar helps align decisions with upcoming data.
This makes the MarketWatch US economic calendar a practical tool for planning entries, exits, and risk management across multiple asset classes.
The economic calendar MarketWatch offers is a valuable tool for tracking essential economic indicators, planning trades, and managing market risk. By understanding impact levels, forecast deviations, and key events such as CPI, NFP, and Fed meetings, traders can make more informed decisions. Using the calendar effectively helps align strategies with real-time market conditions and long-term economic trends.
President Donald Trump rolled back tariffs on more than 200 food items. The exemption list includes everyday essentials such as beef, bananas, coffee, and orange juice, all of which have seen steep price increases. The rollback takes effect retroactively and comes amid growing public frustration over rising grocery bills.
Officials acknowledged that specific tariffs may contribute to higher prices but stated that overall inflation remains contained. The exemption was described as a strategic step, especially for items not made locally. Authorities also pointed to new trade agreements with countries such as Argentina, Ecuador, Guatemala, and El Salvador, noting that the exemptions are part of broader trade progress.
Inflation has become a significant concern for voters. In recent elections in Virginia, New Jersey, and New York, Democrats won several races by focusing on the rising cost of living. Food prices were a significant concern in their campaigns.
Ground beef prices surged nearly 13%, while steak costs rose 17% year-over-year. Meanwhile, banana prices increased by 7%, while tomato prices rose by 1%, and overall food-at-home inflation reached 2.7% in September. Although the U.S. is a major beef producer, cattle shortages have limited supply and kept prices elevated.
Trump announced a plan to give $2,000 to lower- and middle-income Americans next year, using money collected from tariffs. Some observers believe the move is a response to economic pressures linked to rising consumer prices. Moreover, the policy shift reflects growing concern about the broader impact of tariffs on affordability.
Trump's trade strategy includes a 10% base tariff on imports from every country, along with additional state-specific duties. Many economists argue that tariffs have been a direct source of inflation, potentially contributing to increased inflation.
The tariff-related costs will continue rising as more companies pass along expenses to consumers. The Cass Freight Index also declined to recessionary thresholds, as seen in the chart below.

The chart below confirms that the year-over-year change in the Cass Freight Index indicates a warning of a sharp contraction in shipment volumes. This freight weakness, along with lower industrial activity, points to a broader economic slowdown.

Despite broader macroeconomic concerns, the S&P 500 remains at elevated levels. However, the index is currently consolidating near overbought territory, signaling growing uncertainty. At the same time, financial liquidity remains tight.
The daily chart of the S&P 500 shows that the index has reached the red dotted trendline, indicating uncertainty in the short term. A breakout above the $6,900 level could signal further upside toward the $7,000 mark. However, a breakdown below $6,600 would confirm a negative trend and lead to a decline toward the $6,200 level.

The Secured Overnight Financing Rate (SOFR) has risen to 4.0%, aligning with the Federal Reserve's standing repo facility. This suggests that banks are paying more to access short-term funding, which is a classic sign of stress in money markets.

Despite the extremely overbought conditions in the S&P 500, the overall outlook remains strongly bullish. This is supported by the formation of an ascending broadening wedge pattern that has been developing since the 2016 bottom.
Additionally, the presence of an inverted head and shoulders pattern reinforces the bullish momentum. A pullback in the S&P 500 from its overbought condition may present a buying opportunity for investors.

The effects of the trade war are becoming increasingly difficult to ignore. Tariff rollbacks reflect mounting pressure from rising food prices and growing public concern. Inflation is no longer just a headline; it has become a daily reality, and policy responses, such as tariff exemptions and proposed payments, highlight affordability as a central economic issue.
Meanwhile, the market is showing mixed signals. The S&P 500 remains near record highs, but liquidity conditions are tightening, and technical patterns suggest a potential top may be forming. Freight data and industrial output also point to underlying economic weakness. If these trends persist, the long-term impact of the trade war could extend to broader areas of the economy.
White Label
Data API
Web Plug-ins
Poster Maker
Affiliate Program
The risk of loss in trading financial instruments such as stocks, FX, commodities, futures, bonds, ETFs and crypto can be substantial. You may sustain a total loss of the funds that you deposit with your broker. Therefore, you should carefully consider whether such trading is suitable for you in light of your circumstances and financial resources.
No decision to invest should be made without thoroughly conducting due diligence by yourself or consulting with your financial advisors. Our web content might not suit you since we don't know your financial conditions and investment needs. Our financial information might have latency or contain inaccuracy, so you should be fully responsible for any of your trading and investment decisions. The company will not be responsible for your capital loss.
Without getting permission from the website, you are not allowed to copy the website's graphics, texts, or trademarks. Intellectual property rights in the content or data incorporated into this website belong to its providers and exchange merchants.
Not Logged In
Log in to access more features

FastBull Membership
Not yet
Purchase
Log In
Sign Up