Markets
News
Analysis
User
24/7
Economic Calendar
Education
Data
- Names
- Latest
- Prev


Signal Accounts for Members
All Signal Accounts
All Contests


U.S. Personal Income MoM (Sept)A:--
F: --
P: --
U.S. PCE Price Index YoY (SA) (Sept)A:--
F: --
P: --
U.S. PCE Price Index MoM (Sept)A:--
F: --
P: --
U.S. Personal Outlays MoM (SA) (Sept)A:--
F: --
P: --
U.S. Core PCE Price Index MoM (Sept)A:--
F: --
P: --
U.S. Core PCE Price Index YoY (Sept)A:--
F: --
P: --
U.S. UMich 5-Year-Ahead Inflation Expectations Prelim YoY (Dec)A:--
F: --
P: --
U.S. Real Personal Consumption Expenditures MoM (Sept)A:--
F: --
P: --
U.S. UMich Current Economic Conditions Index Prelim (Dec)A:--
F: --
P: --
U.S. UMich Consumer Sentiment Index Prelim (Dec)A:--
F: --
P: --
U.S. UMich 1-Year-Ahead Inflation Expectations Prelim (Dec)A:--
F: --
P: --
U.S. UMich Consumer Expectations Index Prelim (Dec)A:--
F: --
P: --
U.S. Weekly Total Rig CountA:--
F: --
P: --
U.S. Weekly Total Oil Rig CountA:--
F: --
P: --
U.S. Unit Labor Cost Prelim (SA) (Q3)--
F: --
P: --
U.S. Consumer Credit (SA) (Oct)A:--
F: --
P: --
China, Mainland Foreign Exchange Reserves (Nov)A:--
F: --
P: --
Japan Wages MoM (Oct)A:--
F: --
P: --
Japan Trade Balance (Oct)A:--
F: --
P: --
Japan Nominal GDP Revised QoQ (Q3)A:--
F: --
P: --
Japan Trade Balance (Customs Data) (SA) (Oct)A:--
F: --
P: --
Japan GDP Annualized QoQ Revised (Q3)A:--
F: --
China, Mainland Exports YoY (CNH) (Nov)A:--
F: --
P: --
China, Mainland Trade Balance (USD) (Nov)A:--
F: --
P: --
China, Mainland Imports YoY (CNH) (Nov)A:--
F: --
P: --
China, Mainland Exports (Nov)A:--
F: --
P: --
China, Mainland Imports (CNH) (Nov)A:--
F: --
P: --
China, Mainland Trade Balance (CNH) (Nov)A:--
F: --
P: --
China, Mainland Imports YoY (USD) (Nov)A:--
F: --
P: --
China, Mainland Exports YoY (USD) (Nov)A:--
F: --
P: --
Germany Industrial Output MoM (SA) (Oct)--
F: --
P: --
Euro Zone Sentix Investor Confidence Index (Dec)--
F: --
P: --
Canada Leading Index MoM (Nov)--
F: --
P: --
Canada National Economic Confidence Index--
F: --
P: --
U.S. Dallas Fed PCE Price Index YoY (Sept)--
F: --
P: --
China, Mainland Trade Balance (USD) (Nov)--
F: --
P: --
U.S. 3-Year Note Auction Yield--
F: --
P: --
U.K. BRC Overall Retail Sales YoY (Nov)--
F: --
P: --
U.K. BRC Like-For-Like Retail Sales YoY (Nov)--
F: --
P: --
Australia Overnight (Borrowing) Key Rate--
F: --
P: --
RBA Rate Statement
RBA Press Conference
Germany Exports MoM (SA) (Oct)--
F: --
P: --
U.S. NFIB Small Business Optimism Index (SA) (Nov)--
F: --
P: --
Mexico Core CPI YoY (Nov)--
F: --
P: --
Mexico 12-Month Inflation (CPI) (Nov)--
F: --
P: --
Mexico PPI YoY (Nov)--
F: --
P: --
Mexico CPI YoY (Nov)--
F: --
P: --
U.S. Weekly Redbook Index YoY--
F: --
P: --
U.S. JOLTS Job Openings (SA) (Oct)--
F: --
P: --
China, Mainland M2 Money Supply YoY (Nov)--
F: --
P: --
China, Mainland M0 Money Supply YoY (Nov)--
F: --
P: --
China, Mainland M1 Money Supply YoY (Nov)--
F: --
P: --
U.S. EIA Short-Term Crude Production Forecast For The Next Year (Dec)--
F: --
P: --
U.S. EIA Short-Term Crude Production Forecast For The Year (Dec)--
F: --
P: --
U.S. EIA Natural Gas Production Forecast For The Next Year (Dec)--
F: --
P: --
EIA Monthly Short-Term Energy Outlook
U.S. 10-Year Note Auction Avg. Yield--
F: --
P: --
U.S. API Weekly Cushing Crude Oil Stocks--
F: --
P: --
U.S. API Weekly Crude Oil Stocks--
F: --
P: --
U.S. API Weekly Refined Oil Stocks--
F: --
P: --


No matching data
Latest Views
Latest Views
Trending Topics
Top Columnists
Latest Update
White Label
Data API
Web Plug-ins
Affiliate Program
View All

No data
Learn how to read stock market charts and graphs with this beginner-friendly guide. Understand key chart types, patterns, and indicators to make smarter trading decisions.
Learning how to read stock market charts and graphs helps investors identify trends, analyze price action, and make informed decisions.
Stock charts display how a stock’s price changes over time. Each chart type presents data differently, helping investors spot momentum, volatility, and turning points.
Connects closing prices across time, offering a clean view of overall direction. Ideal for beginners learning how to read charts in the stock market.
Shows open, high, low, and close for each period. The vertical bar reflects the full range, while left/right ticks mark open/close. Useful for gauging volatility and intraperiod sentiment.
Visualizes the same OHLC data with colored bodies and wicks, revealing market psychology. Great for recognizing momentum, reversals, and continuation signals (how to read candle chart in stock market).
Ignores time and focuses on price movement only, filtering noise and highlighting breakouts and long-term trend structure.
Understanding key indicators is essential when learning how to read stock market charts and graphs. These indicators help investors evaluate trend strength, momentum, and potential reversals in the market.
The moving average smooths price data over a specific period, showing the average value of a stock’s price. It helps identify the overall trend direction — if prices stay above the MA, the market is bullish; below means bearish.
RSI measures price momentum on a scale of 0 to 100, helping identify overbought or oversold conditions. A reading above 70 often means overbought, while below 30 indicates oversold. When analyzing how to read a stock market chart, RSI offers insight into market psychology and timing.
The MACD indicator tracks the relationship between two exponential moving averages to show momentum shifts. When the MACD line crosses above the signal line, it’s a bullish signal; when below, it’s bearish.
Volume measures how many shares are traded during a given period. When price moves with rising volume, it confirms the strength of that move. This is critical in how to read charts in stock market analysis since it validates breakouts or reversals.
Bollinger Bands use a moving average with upper and lower bands based on standard deviations. When prices touch the upper band, assets may be overbought; when near the lower band, oversold. It’s a visual way to measure volatility and extremes in how to read candle chart in stock market analysis.
This tool helps identify potential support and resistance levels by dividing a major price move into key ratios (23.6%, 38.2%, 61.8%). Traders use it to predict pullbacks and continuation points.
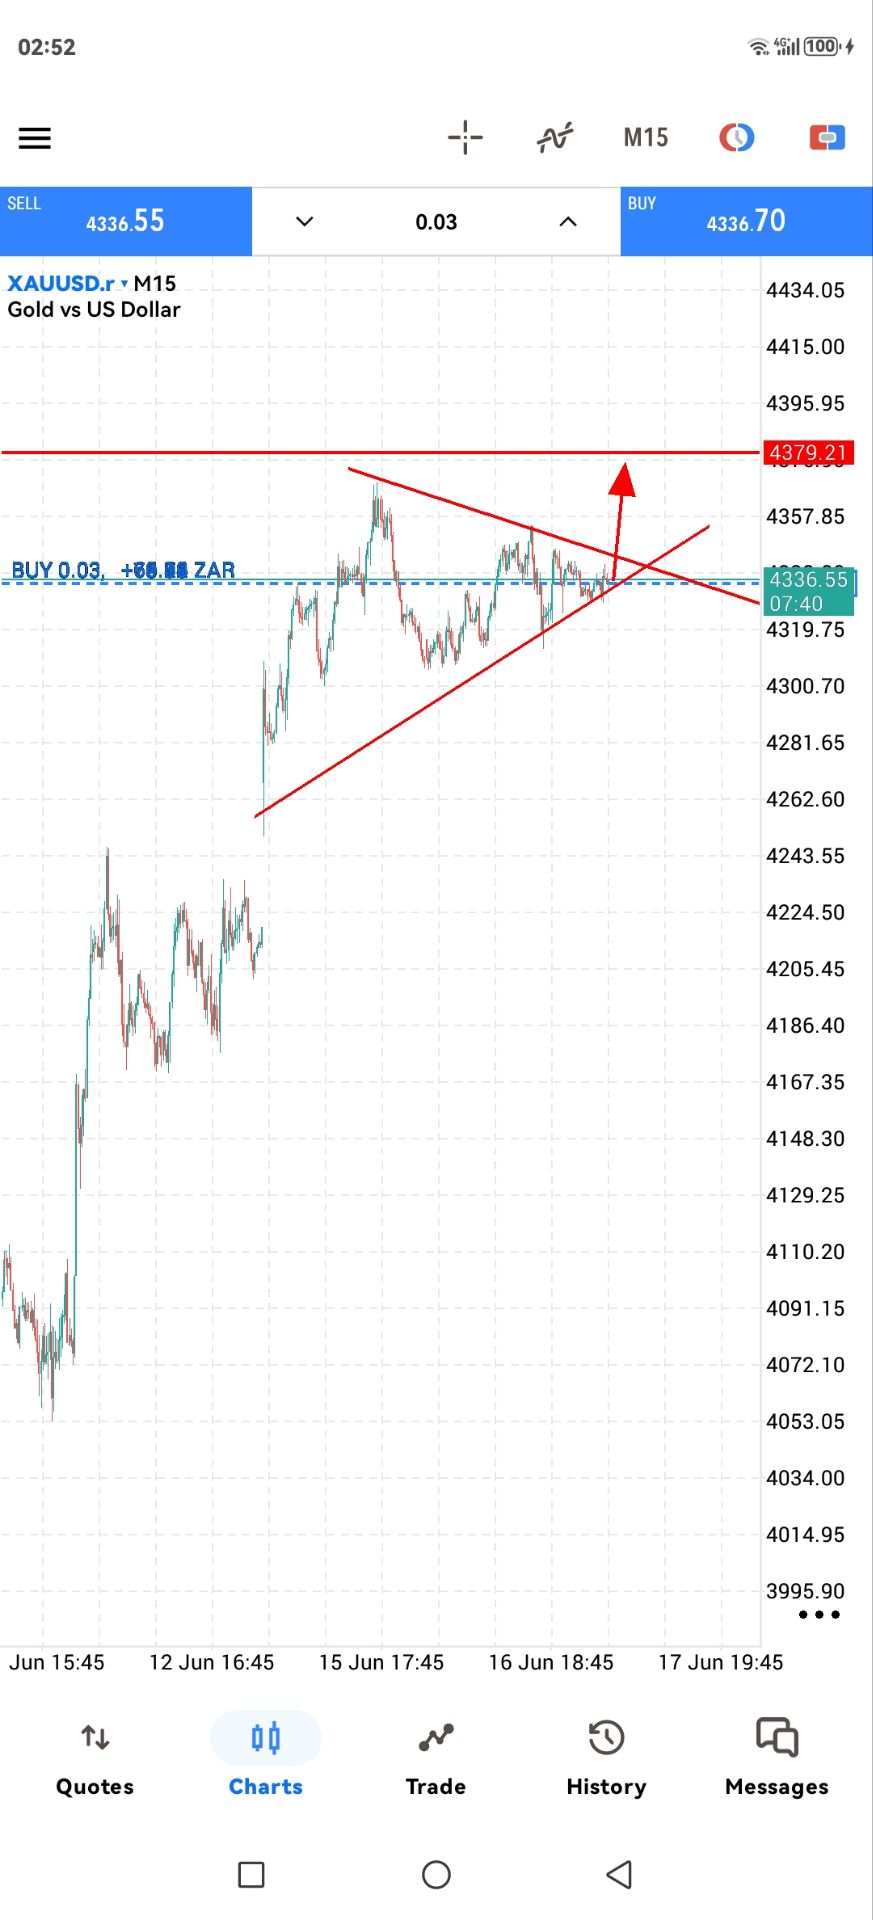
Drawing trendlines helps visualize the market direction. Parallel trendlines form price channels that signal the boundaries of price movement. They’re often combined with indicators for confirmation.
Learning how to read stock market charts and graphs helps investors interpret price trends, market sentiment, and entry or exit signals. Whether you use a line chart, bar chart, or candlestick chart, understanding each format allows you to visualize the balance between buyers and sellers.
A line chart is the simplest way to view price movements over time. It connects the closing prices of each trading period with a continuous line, giving a clear picture of the overall trend.

Line charts are ideal for investors who want to see the “big picture” of a stock’s performance without short-term noise. When learning how to read a stock market chart, this is often the first step toward understanding broader trends.
A bar chart (also called an OHLC chart) shows more detail by including the open, high, low, and close prices within each period. Each vertical bar represents the trading range, while small ticks on either side show opening and closing prices.

When the close is higher than the open, it reflects bullish momentum; when it’s lower, bearish momentum. Bar charts are useful for seeing volatility and range strength — key for those studying how to read charts in stock market for active trading.
Candlestick charts are the most popular and powerful visualization for traders. Each “candle” represents one trading session and includes four data points: open, high, low, and close — similar to bar charts but more visual.

When learning how to read candle chart in stock market, focus on body size and wick length — long bodies show strong moves, while long wicks signal market indecision or reversals.
Common patterns include:
Reading charts isn’t just about recognizing shapes — it’s about context. Combine technical indicators with visual patterns to confirm trends and improve accuracy.
Understanding how to integrate these tools is the key to mastering how to read stock market charts and graphs effectively for real-world investing or trading decisions.
Chart patterns reveal market psychology. Shapes like triangles, double tops, and head-and-shoulders indicate trend continuation or reversal. Understanding them helps predict price behavior.
Beginners can start with simple patterns such as trendlines, support and resistance zones, or candlestick formations like hammers and dojis—they are easy to spot and reliable.
Long-term investors can review weekly or daily charts, while active traders may monitor hourly charts for faster signals and short-term trends.
Mastering how to read stock market charts and graphs helps investors spot opportunities, manage risk, and make smarter, data-driven trading decisions.
(Oct 16): The US dollar headed for a third straight daily loss against the euro while edging up versus the yen on Thursday, as concerns over US-China tensions and dovish remarks from Federal Reserve officials continued to weigh on sentiment.
Analysts say political headwinds have weighed on the yen but expect support to come from looming Fed rate cuts, the end of US quantitative tightening, and a potential rise in market volatility, which usually supports safe-haven assets.
US Treasury yields hovered near multi-week lows, with the benchmark 10-year just above 4%, pressuring the dollar as investors also weighed a prolonged US government shutdown.
The Fed’s Beige Book released Thursday offered little support to US rates, pointing to emerging signs of economic weakness, including rising layoffs and reduced spending among middle- and lower-income households. Fed Governor Stephen Miran said on Wednesday cutting rates is now more important.
The dollar index, which measures the greenback against six other currencies, was down 0.05% at 98.63, and was on track for a weekly decline of around 0.3%.
Investors were scrutinising China’s latest expansion of rare earth export controls, a move sharply criticised by senior US officials on Wednesday, who warned that it could disrupt global supply chains.
"The question for financial markets is whether China's proposed export controls on rare earths are merely part of a bargaining ploy to achieve greater concessions from the US," said Chris Turner, global head of markets at ING.
Amid the tit-for-tat action, US President Donald Trump still expects to meet Chinese President Xi Jinping in South Korea this month, US Treasury Secretary Scott Bessent said.
"An extension, rather than a grand bargain that settles all trade issues, is probably the most realistic second-best outcome compared to the alternative of escalation of retaliation," said Joseph Capurso, head of foreign exchange at Commonwealth Bank of Australia.
The Australian dollar was flat at US$0.6511 after data showed unemployment hit a near four-year high in September, adding to the case for interest rate cuts.
The Aussie, often considered a proxy for risk appetite, has been volatile this week due to the trade tension as traditional havens gained.
China's yuan firmed to a two-week high against the US dollar on Thursday after the central bank set its strongest daily midpoint in a year.
The euro touched a one-week high and was up 0.10% at US$1.1656 as traders braced for yet another episode in the French political drama, with Prime Minister Sebastien Lecornu likely to survive two no-confidence votes in parliament.
France's political crisis has barely affected euro zone sovereign bond markets as investors see no room for a selloff in French bonds without snap elections.
However, by shelving pension reform until after 2027, France’s prime minister has managed to defuse a sharp escalation in the crisis, though at the cost of complicating efforts to rein in public finances, analysts said.
The yen briefly firmed to a one-week high of 150.51 per dollar but was up 0.05% at 151.11. Japan's weakened Liberal Democratic Party is set to begin policy talks with the right-leaning Innovation Party on Thursday that could help Sanae Takaichi clinch a prime ministerial vote expected next week.
"Regardless of the outcome of the prime ministerial election, it is highly likely that the market will price in some expansionary fiscal policies," said Shinichiro Kadota, head of Japan forex and rates strategy at Barclays Tokyo.
"We remain long on the US dollar versus the yen given the risk of a further rally but with eyes on an eventual intervention risk or Bank of Japan hike if the move extends."
This morning, the USD/CHF exchange rate slipped below 0.7944 for the first time since 1 October, as demand for safe-haven assets intensified — a trend also reflected in yesterday’s record gold price above $4,200.The traditionally stable Swiss franc is strengthening amid rising global uncertainty and risk aversion:
→ In Japan, the upcoming prime ministerial election could significantly impact monetary policy, while France faces ongoing political turmoil.
→ In the United States, the government shutdown continues, and traders are closely watching developments around a potential trade deal with China, possibly to be discussed during an expected meeting between the two countries’ leaders.
As noted in our 25 September analysis, the Swiss franc has appreciated through 2025 amid elevated geopolitical and macroeconomic risks, forming a downward channel on the USD/CHF chart (shown in red).
We also highlighted:
→ the possibility of a trend reversal around the 0.7900 support area;
→ potential breakout targets (shown in blue).
Since then, the bulls have indeed made progress, driving the price up towards point A and:
→ breaking above the red channel’s upper boundary;
→ overcoming the psychological 0.8000 level.
However, that progress has not been sustained. Among the bearish signals:
→ the median line of the blue channel acted as resistance;
→ the brief move above local highs around 0.8072 resembles a bearish liquidity grab.
From the bullish perspective, USD/CHF has now retreated into a zone that could act as support:
→ the upper boundary of the red channel;
→ the lower boundary of the blue channel.
The arrow highlights signs of a bullish engulfing pattern, suggesting that buyers may be using these support zones to stage a rebound within the blue channel. The 0.8000 psychological mark could serve as the first key test of their resolve.
Key points:
China has yet to secure much of its soybean supply for December and January as high premiums for Brazilian cargoes discourage buyers, a development that could prompt Beijing to tap state reserves to meet near-term needs, three trade sources said.China still needs to purchase about 8–9 million metric tons of soybeans for December-January shipment after covering cargoes through November with hefty purchases of Argentine beans in recent weeks, the sources said. Escalating Washington-Beijing trade tensions continue to shut out U.S. supplies.
"China is not buying U.S. beans because of the trade war and Brazilian beans are too expensive," said one oilseed trader at an international trading company which supplies agricultural products to China."China might end up using its own reserves for the year-end and early next year, before the new South American harvest comes in." he said.
Brazilian soybean premiums are holding at $2.8-2.9 per bushel over the November Chicago soybean contract (SX25) compared with U.S. premiums at around $1.7 per bushel.Crush margins have been in negative territory (CNSOY-RZO-MRG) for most of the second half of the year.

Crushers have little motivation to secure December-January soybean cargoes as supplies from Brazil have squeezed their margins, said a Shanghai-based trader.Chinese buyers are hoping that an early and record soybean harvest in Brazil in early 2026 will help ease prices.Brazilian farmers are expected to harvest a record 177.64 million metric tons of soybeans in the 2025/26 season, around 6 million tons more than the previous year, crop agency Conab said.
"We think new crop shipments from Brazil can start at end of January," said a second oilseed trader. Sources declined to be named as they were not authorised to speak to media.
Chinese buyers have also not yet entirely written off U.S. supplies, with oilseed processors likely to make purchases for December-January if there is a trade agreement between the two governments, traders and analysts said."If a deal goes through, Chinese buyers will likely turn to U.S. beans for the two-month window, with prices more attractive than South American offers," said Johnny Xiang, founder of Beijing-based AgRadar Consulting.Soybeans are expected to feature on the agenda for a potential meeting between U.S. President Donald Trump and Chinese President Xi Jinping in South Korea. Beijing has, however, yet to publicly confirm the talks.
On Tuesday, Trump accused China of "purposefully" avoiding U.S. soybean purchases, calling it an "economically hostile act" that has "caused difficulties" for American soybean farmers.Since the first Trump administration, China has diversified its soybean imports. In 2024, China bought roughly 20% of its soybeans from the U.S., down from 41% in 2016, customs data shows.
White Label
Data API
Web Plug-ins
Poster Maker
Affiliate Program
The risk of loss in trading financial instruments such as stocks, FX, commodities, futures, bonds, ETFs and crypto can be substantial. You may sustain a total loss of the funds that you deposit with your broker. Therefore, you should carefully consider whether such trading is suitable for you in light of your circumstances and financial resources.
No decision to invest should be made without thoroughly conducting due diligence by yourself or consulting with your financial advisors. Our web content might not suit you since we don't know your financial conditions and investment needs. Our financial information might have latency or contain inaccuracy, so you should be fully responsible for any of your trading and investment decisions. The company will not be responsible for your capital loss.
Without getting permission from the website, you are not allowed to copy the website's graphics, texts, or trademarks. Intellectual property rights in the content or data incorporated into this website belong to its providers and exchange merchants.
Not Logged In
Log in to access more features

FastBull Membership
Not yet
Purchase
Log In
Sign Up