• Trade
  • Markets
  • Copy
  • Contests
  • News
  • 24/7
  • Calendar
  • Q&A
  • Chats
Trending
Screeners
SYMBOL
LAST
BID
ASK
HIGH
LOW
NET CHG.
%CHG.
SPREAD
SPX
S&P 500 Index
6814.30
6814.30
6814.30
6861.30
6801.50
-13.11
-0.19%
--
DJI
Dow Jones Industrial Average
48352.75
48352.75
48352.75
48679.14
48285.67
-105.29
-0.22%
--
IXIC
NASDAQ Composite Index
23090.59
23090.59
23090.59
23345.56
23012.00
-104.57
-0.45%
--
USDX
US Dollar Index
97.950
98.030
97.950
98.070
97.740
0.000
0.00%
--
EURUSD
Euro / US Dollar
1.17451
1.17459
1.17451
1.17686
1.17262
+0.00057
+ 0.05%
--
GBPUSD
Pound Sterling / US Dollar
1.33674
1.33683
1.33674
1.34014
1.33546
-0.00033
-0.02%
--
XAUUSD
Gold / US Dollar
4304.42
4304.83
4304.42
4350.16
4285.08
+5.03
+ 0.12%
--
WTI
Light Sweet Crude Oil
56.469
56.499
56.469
57.601
56.233
-0.764
-1.33%
--

Community Accounts

Signal Accounts
--
Profit Accounts
--
Loss Accounts
--
View More

Become a signal provider

Sell trading signals to earn additional income

View More

Guide to Copy Trading

Get started with ease and confidence

View More

Signal Accounts for Members

All Signal Accounts

Best Return
  • Best Return
  • Best P/L
  • Best MDD
Past 1W
  • Past 1W
  • Past 1M
  • Past 1Y

All Contests

  • All
  • Trump Updates
  • Recommend
  • Stocks
  • Cryptocurrencies
  • Central Banks
  • Featured News
Top News Only
Share

Attempts By Ukrainian Troops To Advance From The South-West To Outskirts Of Kupiansk Are Being Thwarted

Share

Russian Troops Control All Of Kupiansk - IFX Cites Russian Military

Share

On Monday (December 15), The South Korean Won Ultimately Rose 0.60% Against The US Dollar, Closing At 1468.91 Won. The Won Was On An Upward Trend Throughout The Day, Rising Significantly At 17:00 Beijing Time And Reaching A Daily High Of 1463.04 Won At 17:36

Share

Health Ministry: Israeli Forces Kill Palestinian Teen In West Bank

Share

New York Federal Reserve President Williams: Over Time, The Size Of Reserves Could Grow From $2.9 Trillion

Share

New York Fed President Williams: AI Valuations Are High, But There Is A Real Driving Factor

Share

New York Federal Reserve President Williams: The Job Market Is In Very Good Shape

Share

New York Fed President Williams: 'Very Supportive' Of USA Central Bank's Decision To Cut Interest Rates Last Week

Share

New York Fed President Williams: 'Too Early To Say' What Central Bank Should Do At January Meeting

Share

New York Fed President Williams: Strong Markets Part Of Reason Why Economy Will Grow Robustly In 2026

Share

New York Fed President Williams: What Constitutes Ample Reserves Will Change Over Time

Share

New York Fed President Williams: Market Valuations 'Elevated,' But There Are Reasons For Pricing

Share

New York Fed President Williams: Ample Reserves System Working Very Well

Share

New York Fed President Williams: Some Signs That Parts Of Underlying Economy Not As Strong As GDP Data Suggests

Share

New York Fed President Williams: Expects Coming Job Data Will Show Gradual Cooling

Share

Ukraine President Zelenskiy: Monitoring Of Ceasefire Should Be Part Of Security Guarantees

Share

Ukraine President Zelenskiy: Ukraine Needs Clear Understanding On Security Guarantees Before Taking Any Decisions Regarding Frontlines

Share

U.S. Commerce Secretary Rutnick Praised Korea Zinc Co. Ltd., Stating That The United States Will Have Priority Access To The Company's Products In 2026

Share

Ukraine President Zelenskiy: USA Passed On Russian Demands

Share

Zelenskiy Says: Don't Think USA Was Demanding Anything On Territories

TIME
ACT
FCST
PREV
Japan Tankan Small Manufacturing Outlook Index (Q4)

A:--

F: --

P: --

Japan Tankan Large Non-Manufacturing Outlook Index (Q4)

A:--

F: --

P: --

Japan Tankan Large Manufacturing Outlook Index (Q4)

A:--

F: --

P: --

Japan Tankan Small Manufacturing Diffusion Index (Q4)

A:--

F: --

P: --

Japan Tankan Large-Enterprise Capital Expenditure YoY (Q4)

A:--

F: --

P: --

U.K. Rightmove House Price Index YoY (Dec)

A:--

F: --

P: --

China, Mainland Industrial Output YoY (YTD) (Nov)

A:--

F: --

P: --

China, Mainland Urban Area Unemployment Rate (Nov)

A:--

F: --

P: --

Saudi Arabia CPI YoY (Nov)

A:--

F: --

P: --

Euro Zone Industrial Output YoY (Oct)

A:--

F: --

P: --

Euro Zone Industrial Output MoM (Oct)

A:--

F: --

P: --

Canada Existing Home Sales MoM (Nov)

A:--

F: --

P: --

Canada National Economic Confidence Index

A:--

F: --

P: --

Canada New Housing Starts (Nov)

A:--

F: --

P: --
U.S. NY Fed Manufacturing Employment Index (Dec)

A:--

F: --

P: --

U.S. NY Fed Manufacturing Index (Dec)

A:--

F: --

P: --

Canada Core CPI YoY (Nov)

A:--

F: --

P: --

Canada Manufacturing Unfilled Orders MoM (Oct)

A:--

F: --

P: --

U.S. NY Fed Manufacturing Prices Received Index (Dec)

A:--

F: --

P: --

U.S. NY Fed Manufacturing New Orders Index (Dec)

A:--

F: --

P: --

Canada Manufacturing New Orders MoM (Oct)

A:--

F: --

P: --

Canada Core CPI MoM (Nov)

A:--

F: --

P: --

Canada Trimmed CPI YoY (SA) (Nov)

A:--

F: --

P: --

Canada Manufacturing Inventory MoM (Oct)

A:--

F: --

P: --

Canada CPI YoY (Nov)

A:--

F: --

P: --

Canada CPI MoM (Nov)

A:--

F: --

P: --

Canada CPI YoY (SA) (Nov)

A:--

F: --

P: --

Canada Core CPI MoM (SA) (Nov)

A:--

F: --

P: --

Canada CPI MoM (SA) (Nov)

A:--

F: --

P: --

Federal Reserve Board Governor Milan delivered a speech
U.S. NAHB Housing Market Index (Dec)

A:--

F: --

P: --

Australia Composite PMI Prelim (Dec)

--

F: --

P: --

Australia Services PMI Prelim (Dec)

--

F: --

P: --

Australia Manufacturing PMI Prelim (Dec)

--

F: --

P: --

Japan Manufacturing PMI Prelim (SA) (Dec)

--

F: --

P: --

U.K. 3-Month ILO Employment Change (Oct)

--

F: --

P: --

U.K. Unemployment Claimant Count (Nov)

--

F: --

P: --

U.K. Unemployment Rate (Nov)

--

F: --

P: --

U.K. 3-Month ILO Unemployment Rate (Oct)

--

F: --

P: --

U.K. Average Weekly Earnings (3-Month Average, Including Bonuses) YoY (Oct)

--

F: --

P: --

U.K. Average Weekly Earnings (3-Month Average, Excluding Bonuses) YoY (Oct)

--

F: --

P: --

France Services PMI Prelim (Dec)

--

F: --

P: --

France Composite PMI Prelim (SA) (Dec)

--

F: --

P: --

France Manufacturing PMI Prelim (Dec)

--

F: --

P: --

Germany Services PMI Prelim (SA) (Dec)

--

F: --

P: --

Germany Manufacturing PMI Prelim (SA) (Dec)

--

F: --

P: --

Germany Composite PMI Prelim (SA) (Dec)

--

F: --

P: --

Euro Zone Composite PMI Prelim (SA) (Dec)

--

F: --

P: --

Euro Zone Services PMI Prelim (SA) (Dec)

--

F: --

P: --

Euro Zone Manufacturing PMI Prelim (SA) (Dec)

--

F: --

P: --

U.K. Services PMI Prelim (Dec)

--

F: --

P: --

U.K. Manufacturing PMI Prelim (Dec)

--

F: --

P: --

U.K. Composite PMI Prelim (Dec)

--

F: --

P: --

Euro Zone ZEW Economic Sentiment Index (Dec)

--

F: --

P: --

Germany ZEW Current Conditions Index (Dec)

--

F: --

P: --

Germany ZEW Economic Sentiment Index (Dec)

--

F: --

P: --

Euro Zone Trade Balance (Not SA) (Oct)

--

F: --

P: --

Euro Zone ZEW Current Conditions Index (Dec)

--

F: --

P: --

Euro Zone Trade Balance (SA) (Oct)

--

F: --

P: --

Euro Zone Total Reserve Assets (Nov)

--

F: --

P: --

U.K. Inflation Rate Expectations

--

F: --

P: --

Q&A with Experts
    • All
    • Chatrooms
    • Groups
    • Friends
    Connecting
    .
    .
    .
    Type here...
    Add Symbol or Code

      No matching data

      All
      Trump Updates
      Recommend
      Stocks
      Cryptocurrencies
      Central Banks
      Featured News
      • All
      • Russia-Ukraine Conflict
      • Middle East Flashpoint
      • All
      • Russia-Ukraine Conflict
      • Middle East Flashpoint
      Search
      Products

      Charts Free Forever

      Chats Q&A with Experts
      Screeners Economic Calendar Data Tools
      Membership Features
      Data Warehouse Market Trends Institutional Data Policy Rates Macro

      Market Trends

      Market Sentiment Order Book Forex Correlations

      Top Indicators

      Charts Free Forever
      Markets

      News

      News Analysis 24/7 Columns Education
      From Institutions From Analysts
      Topics Columnists

      Latest Views

      Latest Views

      Trending Topics

      Top Columnists

      Latest Update

      Signals

      Copy Rankings Latest Signals Become a signal provider AI Rating
      Contests
      Brokers

      Overview Brokers Assessment Rankings Regulators News Claims
      Broker listing Forex Brokers Comparison Tool Live Spread Comparison Scam
      Q&A Complaint Scam Alert Videos Tips to Detect Scam
      More

      Business
      Events
      Careers About Us Advertising Help Center

      White Label

      Data API

      Web Plug-ins

      Affiliate Program

      Awards Institution Evaluation IB Seminar Salon Event Exhibition
      Vietnam Thailand Singapore Dubai
      Fans Party Investment Sharing Session
      FastBull Summit BrokersView Expo
      Recent Searches
        Top Searches
          Markets
          News
          Analysis
          User
          24/7
          Economic Calendar
          Education
          Data
          • Names
          • Latest
          • Prev

          View All

          No data

          Scan to Download

          Faster Charts, Chat Faster!

          Download App
          English
          • English
          • Español
          • العربية
          • Bahasa Indonesia
          • Bahasa Melayu
          • Tiếng Việt
          • ภาษาไทย
          • Français
          • Italiano
          • Türkçe
          • Русский язык
          • 简中
          • 繁中
          Open Account
          Search
          Products
          Charts Free Forever
          Markets
          News
          Signals

          Copy Rankings Latest Signals Become a signal provider AI Rating
          Contests
          Brokers

          Overview Brokers Assessment Rankings Regulators News Claims
          Broker listing Forex Brokers Comparison Tool Live Spread Comparison Scam
          Q&A Complaint Scam Alert Videos Tips to Detect Scam
          More

          Business
          Events
          Careers About Us Advertising Help Center

          White Label

          Data API

          Web Plug-ins

          Affiliate Program

          Awards Institution Evaluation IB Seminar Salon Event Exhibition
          Vietnam Thailand Singapore Dubai
          Fans Party Investment Sharing Session
          FastBull Summit BrokersView Expo

          Gold Remains Close To USD 3,330 Amid Geopolitical Tensions And Jackson Hole Expectations

          Samantha Luan

          Economic

          Commodity

          Forex

          Political

          Summary:

          On Tuesday, the price of gold stabilised around USD 3,330 per troy ounce. Investors are assessing US-led peace efforts and awaiting the outcome of the Federal Reserve’s annual Jackson Hole symposium.

          On Tuesday, the price of gold stabilised around USD 3,330 per troy ounce. Investors are assessing US-led peace efforts and awaiting the outcome of the Federal Reserve’s annual Jackson Hole symposium.Following Monday’s meeting at the White House, US President Donald Trump confirmed that he had discussed the situation with Russia and was now working on arranging direct talks with three presidents.

          These developments sparked hopes of a possible peace deal, although market participants remain cautious and do not expect a quick resolution.Traders are also focusing on the upcoming speech by Fed Chairman Jerome Powell in Wyoming. The market is waiting for signals regarding a potential resumption of interest rate cuts in September.The baseline scenario still anticipates one rate cut at the September meeting, followed by another small easing by year-end, likely limited to 25 basis points.

          Technical analysis of XAUUSD

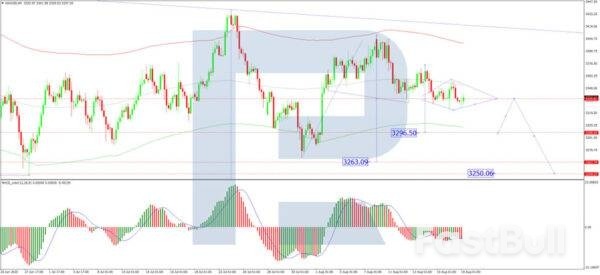
          On the H4 chart of XAUUSD, the market continues to develop a wide consolidation range around the 3,333 level. The price has extended the range upwards to 3,357 and downwards to 3,322. Today, a breakout below this range towards 3,296 is possible. Afterwards, a correction to 3,333 may occur, followed by a decline to 3,263. The formation of a downward wave towards 3,250 is practically under consideration. This scenario is technically supported by the MACD indicator, whose signal line is below zero and pointing strictly downwards, confirming bearish momentum.

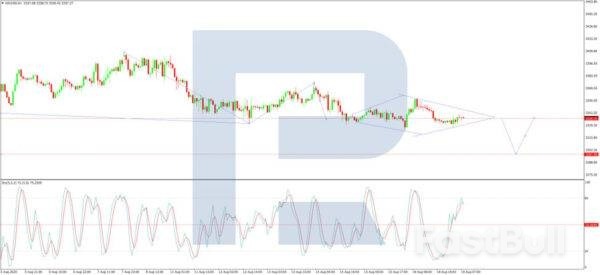
          On the H1 chart, XAUUSD completed a downward impulse to 3,333 and is forming a consolidation range around this level. The third wave of decline is unfolding, targeting 3,297, with a likely continuation of the trend to 3,260. The Stochastic oscillator confirms this setup: its signal line is near the 80 level and preparing to drop towards 20, indicating growing downside pressure.

          Summary

          Gold is holding above USD 3,330 as geopolitical tensions and Jackson Hole expectations dominate sentiment. Technical indicators support the development of a downward wave with key targets at 3,296, 3,263, and potentially 3,250, while short-term consolidation remains around the 3,333 level.

          Source: ACTIONFOREX

          To stay updated on all economic events of today, please check out our Economic calendar
          Risk Warnings and Disclaimers
          You understand and acknowledge that there is a high degree of risk involved in trading. Following any strategies or investment methods may lead to potential losses. The content on the site is provided by our contributors and analysts for information purposes only. You are solely responsible for determining whether any trading assets, securities, strategy, or any other product is suitable for investing based on your own investment objectives and financial situation.
          Add to Favorites
          Share

          Cautious BoJ Stance Restrains USDJPY Decline

          Winkelmann

          Economic

          Political

          Forex

          The USDJPY rate is moderately rising amid a mix of external pressure and Japan’s domestic economic signals. The current quote is 147.71. Find out more in our analysis for 19 August 2025.

          USDJPY forecast: key trading points

          ● BoJ Governor Kazuo Ueda maintains a cautious stance, noting that core inflation remains below the 2% target
          ● Q2 2025 data showed Japan’s economy grew stronger than expected
          ● USDJPY forecast for 19 August 2025: 145.90

          Fundamental analysis

          The USDJPY rate is rising for the second consecutive session but remains within the range it has been stuck in for twelve trading days. Additional pressure on the yen came from Japanese officials’ attempts to smooth reactions to US Treasury Secretary Scott Bessent’s comments. He stated that the Bank of Japan lags behind in its policy, and markets interpreted this as a signal for possible tightening.

          Meanwhile, BoJ Governor Kazuo Ueda sticks to a cautious line, noting that core inflation still stands below the 2% target. This stance allows the regulator to refrain from raising interest rates, adding pressure on the yen.At the same time, Friday’s data showed that Japan’s economy grew stronger than expected in Q2 2025. Growth was mainly driven by net exports despite the negative impact of US tariffs. These results strengthen the case for tighter monetary policy.

          USDJPY technical analysis

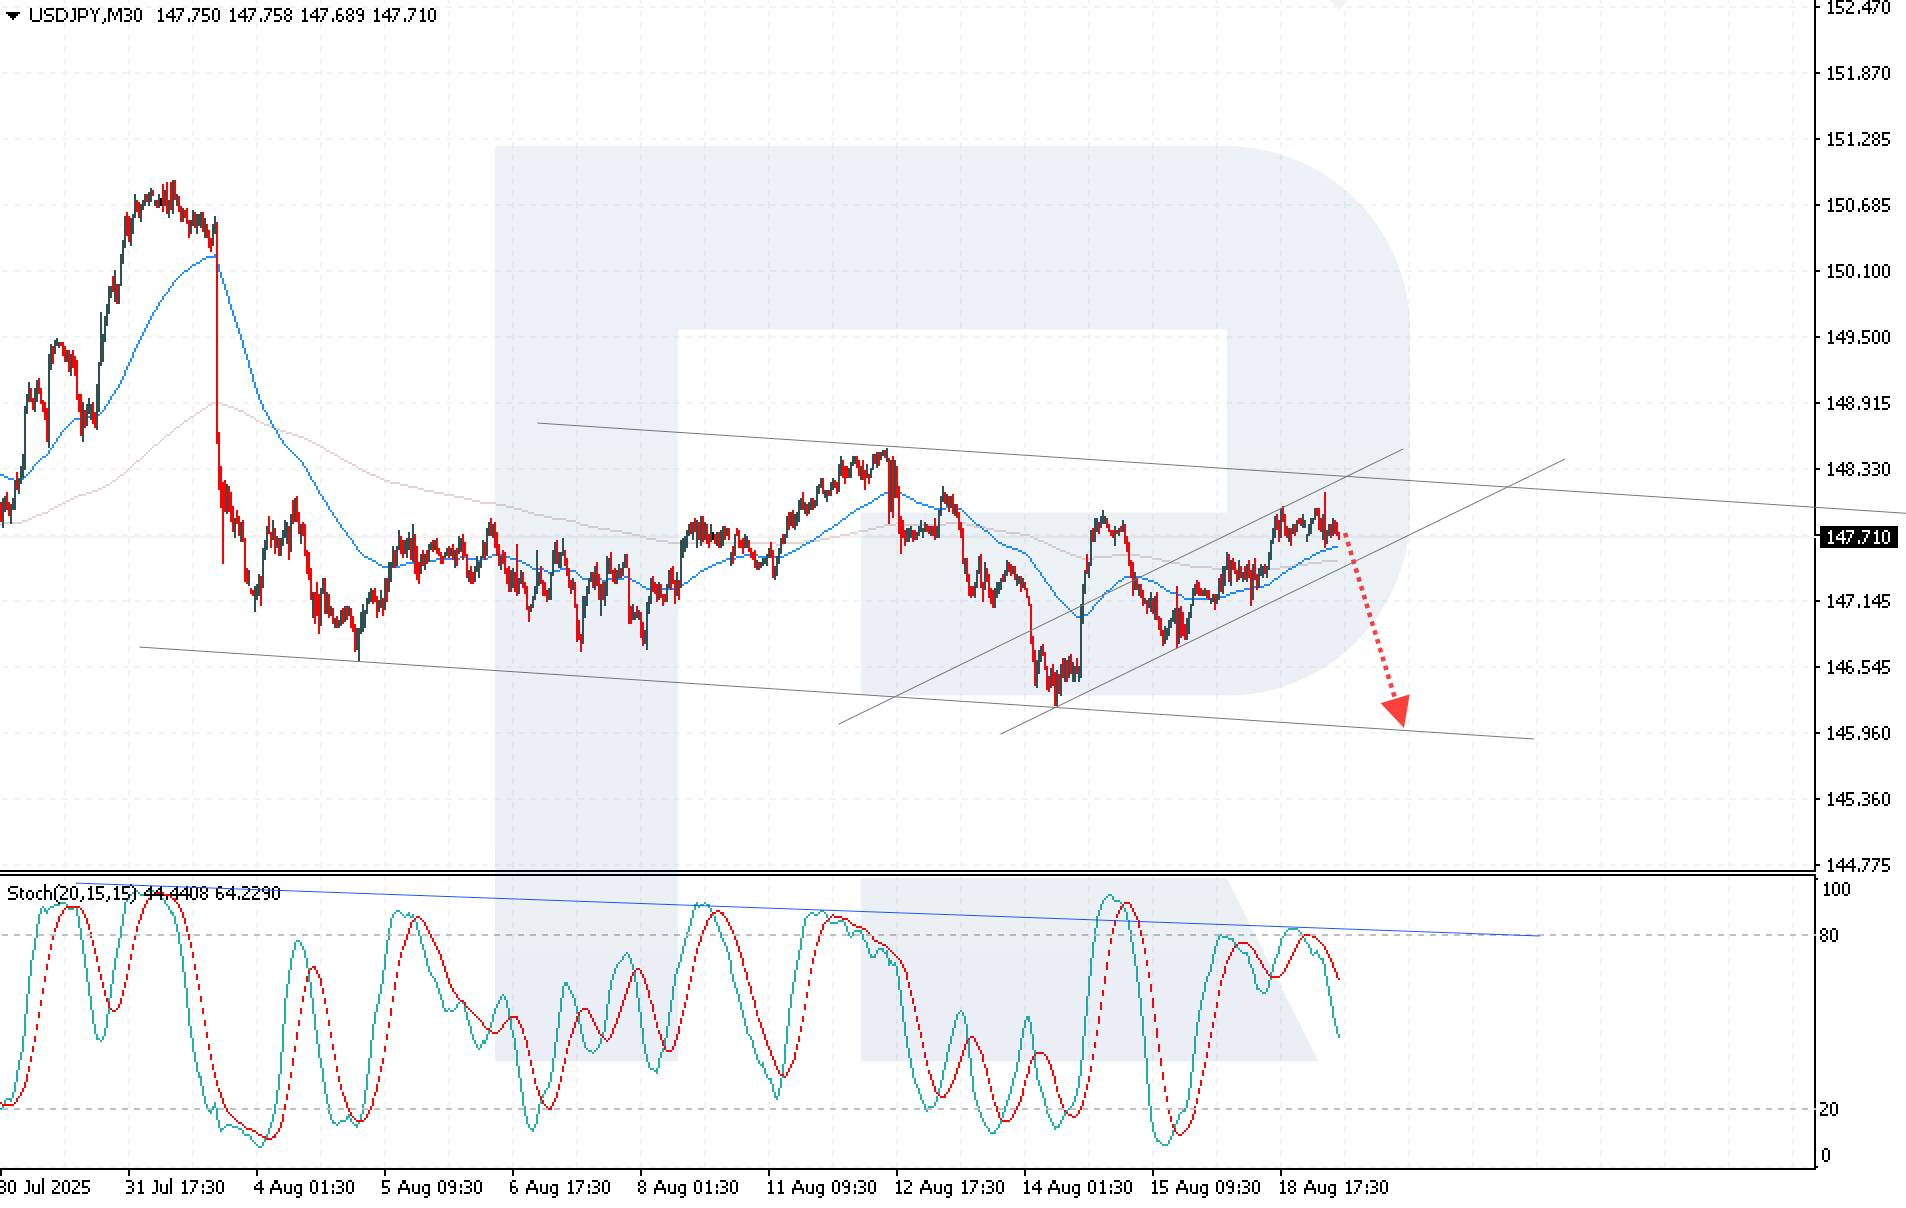
          The USDJPY rate is trading within an upward correction channel and testing the key resistance level at 147.85. The price has consolidated above the EMA-65, indicating buyers’ activity, but several attempts to break above the resistance have failed.The USDJPY forecast for today suggests a decline with a test of 145.90. The Stochastic Oscillator confirms the bearish scenario, with its signal lines reversing downwards from overbought territory, indicating growing selling pressure.

          Consolidation below 147.15 would further confirm the downside scenario.

          Summary

          The USDJPY rate remains within the range, with pair growth supported by external pressure, while the BoJ’s cautious stance restrains sharp yen strengthening. USDJPY technical analysis points to a possible decline of the pair towards 145.90 if it consolidates below 147.15.

          Source: RoboForex

          To stay updated on all economic events of today, please check out our Economic calendar
          Risk Warnings and Disclaimers
          You understand and acknowledge that there is a high degree of risk involved in trading. Following any strategies or investment methods may lead to potential losses. The content on the site is provided by our contributors and analysts for information purposes only. You are solely responsible for determining whether any trading assets, securities, strategy, or any other product is suitable for investing based on your own investment objectives and financial situation.
          Add to Favorites
          Share

          Bank of America Warns Megacap Dominance May Be Nearing Its End

          Gerik

          Economic

          A Decade of Megacap Leadership

          Over the last ten years, U.S. equity markets have been defined by the dominance of the largest companies. According to Bank of America’s research, the top 50 stocks in the S&P 500 have outperformed the broader index by 73 percentage points since 2015. This concentration mirrors the late 1990s, when megacaps outpaced the broader market before the dot-com bubble collapse shifted leadership toward smaller companies and value stocks in the early 2000s. The parallel suggests that today’s environment may be approaching a similar inflection point.
          BofA’s “regime indicator,” which classifies markets into four stages Recovery, Mid Cycle, Late Cycle, and Downturn indicates a movement from the Downturn phase to the Recovery phase. Historically, megacaps outperform in downturns thanks to their resilience and earnings power. However, recovery phases tend to broaden market leadership as rate cuts, rising inflation, and improving growth prospects encourage flows into cyclical, small-cap, and value stocks.
          Savita Subramanian, head of U.S. equity and quantitative strategy at BofA, emphasized that Federal Reserve easing has typically coincided with megacaps lagging, while sectors tied more closely to domestic economic growth gain traction. The causal relationship here is clear: monetary easing reduces pressure on credit-sensitive firms and encourages investors to move beyond defensives and secular growth names.

          The Role of Artificial Intelligence and Market Concentration

          The latest bull market, which began in October 2022, has been heavily skewed toward large-cap technology stocks riding the AI boom. Companies like Nvidia, Microsoft, Apple, Amazon, Alphabet, Meta, and Palantir have all outperformed significantly due to their central roles in AI infrastructure and applications. Nvidia in particular has nearly doubled in value since April 2025, cementing its position as the world’s largest company.
          Yet this concentration has come at a cost. DataTrek Research noted that the top 20 stocks in the S&P 500 gained an average of 40.6% from the April market bottom, while the index overall rose only 27.9%. This means the remaining 480 companies have collectively dragged on index performance, highlighting the fragility of growth that is narrowly concentrated in a handful of names. This correlation between AI enthusiasm and megacap outperformance may weaken if investor sentiment rotates toward broader participation.

          Signs of Rotation Emerging

          Recent performance data indicates that a shift may already be underway. The small-cap Russell 2000, long lagging since its 2021 peak, gained 6% in August 2025, outperforming the S&P 500’s 3.5% over the same period. While a single month does not guarantee a structural trend change, it signals that investors may be preparing for a rotation toward areas of the market more sensitive to economic recovery.
          If this pattern holds, the causal factors will likely include both monetary policy shifts and relative valuation dynamics. As megacaps become increasingly expensive relative to smaller peers, investors may seek opportunities in undervalued segments poised to benefit from recovery.
          Bank of America’s analysis points to an important juncture for equity markets. If the Fed proceeds with rate cuts and the economy shifts into recovery mode, the megacap era that defined the last decade may give way to a more balanced market. While AI-driven growth has fueled unprecedented gains for the largest firms, history suggests that no cycle of concentration lasts indefinitely. The coming quarters could reveal whether U.S. markets are set to broaden once again, offering renewed potential for small-cap and value investors.

          Source: Yahoo Finance

          To stay updated on all economic events of today, please check out our Economic calendar
          Risk Warnings and Disclaimers
          You understand and acknowledge that there is a high degree of risk involved in trading. Following any strategies or investment methods may lead to potential losses. The content on the site is provided by our contributors and analysts for information purposes only. You are solely responsible for determining whether any trading assets, securities, strategy, or any other product is suitable for investing based on your own investment objectives and financial situation.
          Add to Favorites
          Share

          Trump Administration Weighs 10% Stake In Intel Via Chip Act Grants

          Daniel Carter

          Economic

          Political

          As part of a potential deal, the government is also considering converting some or all of Intel's grants from the 2022 U.S. CHIPS and Science Act into equity in the company, the report said, citing a White House official and other people familiar with the matter.
          At the embattled chipmaker's current market value, a 10% stake would be worth roughly $10.4 billion. Meanwhile, Intel has been awarded about $10.9 billion in Chips Act grants, including $7.9 billion for commercial manufacturing and $3 billion for national security projects.
          The report noted, however, that it remains unclear if the idea has gained traction broadly within the administration or whether officials have broached the possibility with affected companies.
          It added that the exact size of the stake remains in flux, and it remains unclear whether the White House will actually proceed with the plan. Intel and the White House did not immediately respond to CNBC's queries regarding the report.
          Intel, once a dominant force in the U.S. chip industry, has fallen behind global competitors in advanced chip manufacturing. Reviving the former U.S. chip champion has become a national priority in Washington, with reports about a potential government stake in the company first circulating last week.
          The company has been the largest recipient of the 2022 Chips Act, passed with bipartisan support under the Biden administration, as part of efforts by Washington to revitalize U.S. leadership in semiconductor manufacturing.
          The bill allocated $39 billion in grants for American semiconductor manufacturing projects, with funding committed to many of the world's chipmakers such as TSMC and Samsung, as well as American chip companies such as Nvidia, Micron and GlobalFoundries.
          U.S. President Donald Trump, though supporting the general goals of the Chips Act, has been a vocal critic of the bill and even called for its repeal earlier this year. While republican lawmakers in Washington have been reluctant to act on that call, U.S. Commerce Secretary Howard Lutnick said in June that the administration was renegotiating some of the bill's grants.
          If Intel's Chip Act funds were to be converted into a potential government stake in the company, it could decrease the total amount of capital infused into the company as part of any deal by Washington.
          However, it would serve as the latest example of the Trump administration's interest in building government-backed national champions in strategic industries.
          Intel has struggled to gain an advantage in the artificial intelligence boom and has yet to capture a significant customer for its manufacturing business despite spending heavily on it.
          Some analysts have argued that government intervention is essential for the struggling chipmaker and for the sake of U.S. national security. Others contend that Intel's problems are deeper than funding, and it is not clear how the government can help with that.
          Analysts have also noted that Trump may be able to sway companies to buy Intel chips or assist indirectly, through tariffs and regulation.
          On Tuesday, it was announced that SoftBank was investing $2 billion in Intel. According to LSEG, the investment is worth about 2% of Intel, making SoftBank the fifth-biggest shareholder. Masayoshi Son, Chairman & CEO of SoftBank Group, said: "This strategic investment reflects our belief that advanced semiconductor manufacturing and supply will further expand in the United States, with Intel playing a critical role."
          Intel investors had initially welcomed news of the government investment, which resulted in a share rally of nearly 9% on Aug. 14. Shares of Intel fell over 3% on Monday on the Bloomberg report, but rebounded by more than 5% in overnight trading on the trading platform Robinhood following news of a Softbank investment.
          Intel CEO Lip-Bu Tan, who was appointed in March 2025, met with Trump at the White House last week, after the U.S. president had called for his ousting due to his past ties to China.
          After the meeting, Trump had changed his tune on the Intel chief, saying he had "an amazing story." It's unclear if a potential government stake in the company had been discussed at the time.

          Source: CNBC

          To stay updated on all economic events of today, please check out our Economic calendar
          Risk Warnings and Disclaimers
          You understand and acknowledge that there is a high degree of risk involved in trading. Following any strategies or investment methods may lead to potential losses. The content on the site is provided by our contributors and analysts for information purposes only. You are solely responsible for determining whether any trading assets, securities, strategy, or any other product is suitable for investing based on your own investment objectives and financial situation.
          Add to Favorites
          Share

          China Holds Lending Rates Steady as Focus Shifts to Targeted Structural Support

          Gerik

          Economic

          Stability Over Stimulus: PBOC Maintains Course

          The People's Bank of China (PBOC) is widely anticipated to keep both its one-year and five-year Loan Prime Rates (LPRs) unchanged this August, reflecting a cautious monetary stance despite emerging signs of decelerating growth. This expectation, drawn from a Reuters survey of 23 analysts, marks the third month of rate stability following a 10-basis-point reduction in May.
          Maintaining the status quo on rates comes as China’s economy shows mixed signals. While new yuan loans contracted in July the first such contraction in two decades the broader credit environment has improved, prompting policymakers to resist immediate loosening. The causal link between cautious lending expansion and the choice to hold rates suggests that policymakers are prioritizing financial stability and inflation control over short-term stimulus.

          Structural Policies Gain Prominence

          Rather than turning to aggressive monetary tools such as rate or reserve requirement ratio (RRR) cuts, the PBOC is expected to expand its use of structural instruments that target specific areas of the economy. This reflects a deliberate shift in policy philosophy. Citi analysts highlighted that instead of “bazooka-style” stimulus, Beijing is likely to deploy measured tools to stimulate consumption, innovation, small enterprise activity, and trade.
          This approach is both reactive and anticipatory. It reacts to economic fragilities such as weakening demand and sluggish lending while also aligning with Beijing’s longer-term strategic goals, particularly in advancing technology and reducing financial risk.
          The PBOC’s own quarterly report reinforces this direction, emphasizing moderately loose policy but urging the “good use” of structural tools to support microeconomic goals. This implies a causal relationship between economic complexity and the central bank's pivot: traditional levers may no longer be as effective in a fragmented and sectorally divergent growth landscape.

          Anti-Involution Drive Adds Policy Complement

          Another pillar of Beijing’s evolving macroeconomic toolkit is its campaign against industrial “involution” a term referring to destructive over-competition and excess capacity. This initiative aims to correct distortions in sectors like solar energy and steel, where chronic oversupply fuels deflationary pressures.
          If implemented successfully, this campaign could serve as a complementary instrument to monetary policy, reducing systemic drag on prices and aligning output more closely with sustainable demand. The anticipated deflation-combating effect is not directly monetary, but it could indirectly ease the burden on central bank intervention by addressing structural inefficiencies.
          The PBOC’s decision to leave the LPR unchanged in August signals a calculated pause rather than inaction. Despite loan contractions and an uncertain recovery path, the central bank is choosing to rely on precision-targeted structural policies instead of broad monetary easing. This approach reflects a deeper strategy: realigning China’s growth model through innovation, efficient credit distribution, and industrial recalibration, rather than stimulating aggregate demand indiscriminately. The success of this policy stance will depend not just on macroeconomic indicators but on the responsiveness of sectoral actors and the discipline of local governments in adhering to reform mandates.

          Source: Reuters

          To stay updated on all economic events of today, please check out our Economic calendar
          Risk Warnings and Disclaimers
          You understand and acknowledge that there is a high degree of risk involved in trading. Following any strategies or investment methods may lead to potential losses. The content on the site is provided by our contributors and analysts for information purposes only. You are solely responsible for determining whether any trading assets, securities, strategy, or any other product is suitable for investing based on your own investment objectives and financial situation.
          Add to Favorites
          Share

          China’s Polysilicon Gamble: Overcapacity Reform Faces Harsh Reality in Solar Industry

          Gerik

          Economic

          Commodity

          Polysilicon Becomes Beijing’s Test Case

          China’s effort to address overcapacity in its industrial sectors begins with the polysilicon industry, which lies at the core of the global solar supply chain. This sector, having expanded aggressively over the past five years, has created vast excess capacity, with utilization rates expected to drop to just 35–40% in 2025, down from 57% in 2024 according to Bernreuter Research. The sheer scale of this contraction signals a serious mismatch between production and actual global demand.
          In response, Chinese regulators have backed an industry-led plan: a 50 billion yuan ($7 billion) fund to acquire and shut inefficient producers, while forming a cartel to stabilize prices. This strategy is designed to engineer higher prices, revive profitability among surviving firms, and consolidate the downstream solar module sector, which currently produces twice the volume global markets demand.
          Yet despite its strategic appeal, the reform initiative faces resistance from all sides, challenging its viability from both a coordination and implementation perspective.

          Cartel Coordination and Local Government Pushback

          The proposed cartel is fraught with coordination challenges. GCL Technology Holdings, a major player, has confirmed the plan is nearing completion but offered no transparency regarding membership or enforcement mechanisms. The lack of clarity raises concerns over how agreement can be enforced among competing firms with diverging incentives.
          Even if a consensus were reached, the deeper issue lies in the conflict between national industrial policy and local government interests. Local authorities, having poured resources into the solar industry through subsidies, land, and tax breaks, are unlikely to willingly dismantle key contributors to regional GDP and employment. As noted by The Conference Board’s Max Zenglein, no region wants to be the first to let go of its prized industrial base.
          The continuation of new capacity additions such as a 140,000-ton polysilicon plant in Qinghai and a 3 billion yuan solar module factory in Xinjiang even after the central government’s February call to halt expansion, underscores this disconnect. These moves are not random but represent a causal tension between local protectionism and Beijing’s overcapacity agenda, which risks undermining its credibility if unenforced.

          Historical Failures and Structural Inertia

          China’s history of failed industry self-regulation deepens skepticism. A price floor for solar modules proposed in 2024 collapsed under competitive pressure. This indicates a pattern of short-term price wars overriding long-term strategic discipline, and such behavior threatens to repeat even if the cartel takes shape.
          Moreover, the cyclical nature of cartel economics poses inherent instability. Should prices rise successfully, firms may be tempted to boost output and exploit the upswing, repeating the same cycle of oversupply. Analysts from Gavekal Dragonomics note that if the relatively straightforward polysilicon sector with fewer players and simplified supply chains cannot sustain reform, broader overcapacity measures in more complex sectors like EVs or shipbuilding may prove impossible.

          Economic and Political Risks of Retrenchment

          From a macroeconomic perspective, the inability to rein in production threatens to exacerbate deflationary pressures in China’s economy. Continued price collapses in the solar sector contribute to a pattern of inefficient capital allocation and shrinking profit margins, fueling global trade tensions particularly with Western nations accusing China of dumping solar products at subsidized prices.
          However, pushing reform too aggressively also carries risk. Analysts like Alicia Garcia-Herrero from Natixis suggest that forcing uncompetitive firms out could create a wave of defaults, testing Beijing’s willingness to accept large-scale industrial contraction in a sector it considers strategically important. This tension between structural correction and economic stability underscores the political cost of reform.

          A Structural Litmus Test With Global Implications

          China’s attempt to fix the polysilicon sector through a coordinated buyout and cartelization strategy represents more than just an industrial tweak it is a litmus test of the country’s capacity to reverse years of state-driven overbuilding. With industry cooperation uncertain, local governments resisting consolidation, and past reform attempts falling short, success is far from assured.
          Should this attempt fail, it would reinforce global perceptions that China’s industrial policy is locked in a cycle of expansion, inefficiency, and export-driven excess. The outcome of the polysilicon intervention will not only determine the fate of solar manufacturing but signal whether Beijing can impose discipline across its sprawling industrial landscape without triggering domestic economic fallout.

          Source: Reuters

          To stay updated on all economic events of today, please check out our Economic calendar
          Risk Warnings and Disclaimers
          You understand and acknowledge that there is a high degree of risk involved in trading. Following any strategies or investment methods may lead to potential losses. The content on the site is provided by our contributors and analysts for information purposes only. You are solely responsible for determining whether any trading assets, securities, strategy, or any other product is suitable for investing based on your own investment objectives and financial situation.
          Add to Favorites
          Share

          American Capital Reshapes European Soccer as Revenues Soar and Global Expansion Looms

          Gerik

          Economic

          Unprecedented Financial Growth Lures U.S. Investors

          The financial transformation of European soccer has reached new heights, drawing substantial American investment. From the 1996–1997 season to the 2023–2024 season, total revenues in Europe’s top five soccer leagues skyrocketed from €2.5 billion to €20.4 billion a staggering 750% increase. This long-term revenue surge, verified by Deloitte, is a primary causal factor behind the influx of U.S. capital, as investors are drawn to the reliable returns and global marketability of top-tier football clubs.
          This sharp appreciation in value is exemplified by Manchester United. Originally acquired by the Glazer family in 2005 for £790 million, the club's valuation surged to £5 billion in 2024 following a minority stake sale to Jim Ratcliffe. This reflects a broader causal relationship: the scarcity of domestic (U.S.) professional teams for acquisition particularly in the NFL and NBA has pushed investors toward European alternatives, which remain more accessible and poised for further growth.

          Widespread American Influence in Club Ownership

          Ownership data from PitchBook illustrates this transformation. A majority of English Premier League clubs including four of the traditional “Big Six” (Chelsea, Liverpool, Manchester United, and Arsenal) are now partially or fully owned by American investors. Across Europe, over 36 clubs in the top five leagues have received capital infusions from private equity, venture capital, or private debt firms. This reflects a causative trend, not merely a correlation: rising valuations and global fan engagement are actively motivating financial institutions to treat soccer as a growth asset class.
          According to Kieran Maguire of the University of Liverpool, this shift is enabled by the unprecedented accumulation of private wealth in the United States, coupled with the scarcity of elite sports franchises available for acquisition in domestic markets. For wealthy investors seeking prestige assets, European soccer clubs offer both visibility and potential returns.

          Private Equity Embraces Multi-Club Ownership Model

          A particularly noteworthy development is the emergence of the multi-club ownership model, in which one investment group owns stakes in multiple teams across countries. This approach allows for brand synergies, player development integration, and expanded marketing potential. Analyst Nicolas Moura from PitchBook explains that many U.S. investors are intentionally creating portfolios of football clubs to amplify commercial leverage.
          However, this model is now facing regulatory scrutiny. The European football governing body UEFA has started enforcing ownership separation rules. A notable example occurred when Crystal Palace, part-owned by American John Textor (who also owns France’s Lyon), was barred from participating in the UEFA Europa League. This indicates a direct causal link between the expansion of multi-club ownership and regulatory enforcement, which could constrain future investment structures.

          Revenue Growth Plateaus, New Avenues Explored

          While historical growth has been meteoric, Deloitte projects that revenue expansion may plateau in the 2025–2026 season due to stagnating broadcast rights values. This forecast has prompted clubs to aggressively pursue new commercial opportunities. A 6% rise in commercial revenues in the 2023–2024 season underscores the increasing reliance on sponsorship deals and diversified event hosting within stadiums.
          In response, U.S. private equity investors are increasingly investing in stadium infrastructure to create new revenue channels beyond media rights. By revamping stands or stadiums entirely, investors aim to increase matchday income and host non-soccer events, positioning clubs as entertainment venues rather than purely sporting organizations.

          International Expansion of Domestic Matches

          The pursuit of international fan engagement is entering a new phase. Spain’s La Liga will host its first regular season match abroad in 2025, as Barcelona faces Villareal in Miami. Italy’s Serie A is also set to follow, with formal plans approved for a game in Australia. Although such actions have previously been prohibited by FIFA rules, global governing bodies are now reconsidering their stance, likely driven by financial incentives.
          Despite Premier League CEO Richard Masters asserting that the English league remains reluctant to adopt international regular-season games, Professor Maguire predicts that financial pressures will eventually drive the league toward global expansion. If so, this would represent a causative shift, wherein declining domestic revenue growth pushes leagues toward monetizing global audiences more directly.
          The influx of U.S. investment is fundamentally altering the landscape of European soccer. What began as a financial opportunity has now expanded into a systemic transformation involving multi-club strategies, stadium reinventions, and overseas match planning. While the initial draw was financial driven by explosive revenue growth and limited U.S. sports ownership availability the consequences are structural, introducing new regulatory challenges and commercial dynamics. As clubs seek to sustain revenue amidst media rights stagnation, the path forward will likely be defined by internationalization and further professionalization of club operations, fueled by American capital and strategic intent.

          Source: CNBC

          To stay updated on all economic events of today, please check out our Economic calendar
          Risk Warnings and Disclaimers
          You understand and acknowledge that there is a high degree of risk involved in trading. Following any strategies or investment methods may lead to potential losses. The content on the site is provided by our contributors and analysts for information purposes only. You are solely responsible for determining whether any trading assets, securities, strategy, or any other product is suitable for investing based on your own investment objectives and financial situation.
          Add to Favorites
          Share
          FastBull
          Copyright © 2025 FastBull Ltd

          728 RM B 7/F GEE LOK IND BLDG NO 34 HUNG TO RD KWUN TONG KLN HONG KONG

          TelegramInstagramTwitterfacebooklinkedin
          App Store Google Play Google Play
          Products
          Charts

          Chats

          Q&A with Experts
          Screeners
          Economic Calendar
          Data
          Tools
          Membership
          Features
          Function
          Markets
          Copy Trading
          Latest Signals
          Contests
          News
          Analysis
          24/7
          Columns
          Education
          Company
          Careers
          About Us
          Contact Us
          Advertising
          Help Center
          Feedback
          User Agreement
          Privacy Policy
          Business

          White Label

          Data API

          Web Plug-ins

          Poster Maker

          Affiliate Program

          Risk Disclosure

          The risk of loss in trading financial instruments such as stocks, FX, commodities, futures, bonds, ETFs and crypto can be substantial. You may sustain a total loss of the funds that you deposit with your broker. Therefore, you should carefully consider whether such trading is suitable for you in light of your circumstances and financial resources.

          No decision to invest should be made without thoroughly conducting due diligence by yourself or consulting with your financial advisors. Our web content might not suit you since we don't know your financial conditions and investment needs. Our financial information might have latency or contain inaccuracy, so you should be fully responsible for any of your trading and investment decisions. The company will not be responsible for your capital loss.

          Without getting permission from the website, you are not allowed to copy the website's graphics, texts, or trademarks. Intellectual property rights in the content or data incorporated into this website belong to its providers and exchange merchants.

          Not Logged In

          Log in to access more features

          FastBull Membership

          Not yet

          Purchase

          Become a signal provider
          Help Center
          Customer Service
          Dark Mode
          Price Up/Down Colors

          Log In

          Sign Up

          Position
          Layout
          Fullscreen
          Default to Chart
          The chart page opens by default when you visit fastbull.com