• Trade
  • Markets
  • Copy
  • Contests
  • News
  • 24/7
  • Calendar
  • Q&A
  • Chats
Trending
Screeners
SYMBOL
LAST
BID
ASK
HIGH
LOW
NET CHG.
%CHG.
SPREAD
SPX
S&P 500 Index
6873.62
6873.62
6873.62
6895.79
6858.32
+16.50
+ 0.24%
--
DJI
Dow Jones Industrial Average
48003.03
48003.03
48003.03
48133.54
47871.51
+152.10
+ 0.32%
--
IXIC
NASDAQ Composite Index
23571.02
23571.02
23571.02
23680.03
23506.00
+65.89
+ 0.28%
--
USDX
US Dollar Index
98.910
98.990
98.910
99.060
98.740
-0.070
-0.07%
--
EURUSD
Euro / US Dollar
1.16447
1.16454
1.16447
1.16715
1.16277
+0.00002
0.00%
--
GBPUSD
Pound Sterling / US Dollar
1.33357
1.33365
1.33357
1.33622
1.33159
+0.00086
+ 0.06%
--
XAUUSD
Gold / US Dollar
4215.69
4216.10
4215.69
4259.16
4194.54
+8.52
+ 0.20%
--
WTI
Light Sweet Crude Oil
59.935
59.965
59.935
60.236
59.187
+0.552
+ 0.93%
--

Community Accounts

Signal Accounts
--
Profit Accounts
--
Loss Accounts
--
View More

Become a signal provider

Sell trading signals to earn additional income

View More

Guide to Copy Trading

Get started with ease and confidence

View More

Signal Accounts for Members

All Signal Accounts

Best Return
  • Best Return
  • Best P/L
  • Best MDD
Past 1W
  • Past 1W
  • Past 1M
  • Past 1Y

All Contests

  • All
  • Trump Updates
  • Recommend
  • Stocks
  • Cryptocurrencies
  • Central Banks
  • Featured News
Top News Only
Share

New York Fed Accepts $1.485 Billion Of $1.485 Billion Submitted To Reverse Repo Facility On Dec 05

Share

Oil Price Analysis Firm Platts Will Ignore Fuel Products Produced From Russian Oil

Share

Baker Hughes - US Drillers Add Oil And Natgas Rigs For Fourth Time In Five Weeks

Share

Baker Hughes - USA Oil Rig Count Rose 6 At 413

Share

Baker Hughes - US Natgas Rig Count Fell 1 At 129

Share

Baker Hughes - Gulf Of Mexico Rig Count Up 1, North Dakota Rigs Unchanged, Pennsylvania Unchanged, Texas Unchanged In Week To Dec 5

Share

The Total Number Of Drilling Rigs In The United States For The Week Ending December 5 Was 549, Compared To 544 In The Previous Week

Share

Canadian Prime Minister Mark Carney And Mexican President Jaime Sinbaum Discussed The Recent Bilateral Framework

Share

Barclays Is Exploring The Acquisition Of Evelyn Partners

Share

Democratic Members Of The Senate Banking Committee Are Pressuring President Trump's Republican Camp To Have Federal Housing Finance Agency (FhFA) Commissioner Bill Pulte Appear Before A Hearing By The End Of January 2026

Share

Trump Says He Will Talk Trade With Leaders Of Mexico, Canada At World Cup Draw

Share

US Envoy Kushner Asked To Meet France's Sarkozy In Jail

Share

Anthropic Executive Amodei Met With President Trump’s Administration Officials On Thursday And Also Met With A Bipartisan Group In The Senate

Share

Chechen Leader Kadyrov Says Grozny Was Attacked By Ukrainian Drone

Share

Cnn Brasil: Brazil Ex-President Bolsonaro Signals Support For Senator Flavio Bolsonaro As Presidential Candidate Next Year

Share

French Energy Minister: Request For State Aid Approval For EDF's Six Nuclear Reactor Projects Has Been Sent To Brussels

Share

Congo Orders Cobalt Exporters To Pre-Pay 10% Royalty Within 48 Hours Under New Export Rules, Government Circular Seen By Reuters Shows

Share

US Court Says Trump Can Remove Democrats From Two Federal Labor Boards

Share

In The Past 24 Hours, The Marketvector Digital Asset 100 Small Cap Index Fell 6.62%, Temporarily Reporting 4066.13 Points. The Overall Trend Continued To Decline, And The Decline Accelerated At 00:00 Beijing Time

Share

MSCI Nordic Countries Index Rose 0.5% To 358.24 Points, A New Closing High Since November 13, With A Cumulative Gain Of Over 0.66% This Week. Among The Ten Sectors, The Nordic Industrials Sector Saw The Largest Increase. Neste Oyj Rose 5.4%, Leading The Pack Among Nordic Stocks

TIME
ACT
FCST
PREV
France Current Account (Not SA) (Oct)

A:--

F: --

P: --

France Trade Balance (SA) (Oct)

A:--

F: --

P: --

Italy Retail Sales MoM (SA) (Oct)

A:--

F: --

P: --

Euro Zone Employment YoY (SA) (Q3)

A:--

F: --

P: --

Euro Zone GDP Final YoY (Q3)

A:--

F: --

P: --

Euro Zone GDP Final QoQ (Q3)

A:--

F: --

P: --

Euro Zone Employment Final QoQ (SA) (Q3)

A:--

F: --

P: --

Euro Zone Employment Final (SA) (Q3)

A:--

F: --

P: --
Brazil PPI MoM (Oct)

A:--

F: --

P: --

Mexico Consumer Confidence Index (Nov)

A:--

F: --

P: --

Canada Unemployment Rate (SA) (Nov)

A:--

F: --

P: --

Canada Labor Force Participation Rate (SA) (Nov)

A:--

F: --

P: --

Canada Employment (SA) (Nov)

A:--

F: --

P: --

Canada Part-Time Employment (SA) (Nov)

A:--

F: --

P: --

Canada Full-time Employment (SA) (Nov)

A:--

F: --

P: --

U.S. Personal Income MoM (Sept)

A:--

F: --

P: --

U.S. PCE Price Index YoY (SA) (Sept)

A:--

F: --

P: --

U.S. PCE Price Index MoM (Sept)

A:--

F: --

P: --

U.S. Personal Outlays MoM (SA) (Sept)

A:--

F: --

P: --

U.S. Core PCE Price Index MoM (Sept)

A:--

F: --

P: --

U.S. Core PCE Price Index YoY (Sept)

A:--

F: --

P: --

U.S. UMich 5-Year-Ahead Inflation Expectations Prelim YoY (Dec)

A:--

F: --

P: --

U.S. Real Personal Consumption Expenditures MoM (Sept)

A:--

F: --

P: --

U.S. 5-10 Year-Ahead Inflation Expectations (Dec)

A:--

F: --

P: --

U.S. UMich Current Economic Conditions Index Prelim (Dec)

A:--

F: --

P: --

U.S. UMich Consumer Sentiment Index Prelim (Dec)

A:--

F: --

P: --

U.S. UMich 1-Year-Ahead Inflation Expectations Prelim (Dec)

A:--

F: --

P: --

U.S. UMich Consumer Expectations Index Prelim (Dec)

A:--

F: --

P: --

U.S. Weekly Total Rig Count

A:--

F: --

P: --

U.S. Weekly Total Oil Rig Count

A:--

F: --

P: --

U.S. Unit Labor Cost Prelim (SA) (Q3)

--

F: --

P: --

U.S. Consumer Credit (SA) (Oct)

--

F: --

P: --

China, Mainland Foreign Exchange Reserves (Nov)

--

F: --

P: --

China, Mainland Exports YoY (USD) (Nov)

--

F: --

P: --

China, Mainland Imports YoY (CNH) (Nov)

--

F: --

P: --

China, Mainland Imports YoY (USD) (Nov)

--

F: --

P: --

China, Mainland Imports (CNH) (Nov)

--

F: --

P: --

China, Mainland Trade Balance (CNH) (Nov)

--

F: --

P: --

China, Mainland Exports (Nov)

--

F: --

P: --

Japan Wages MoM (Oct)

--

F: --

P: --

Japan Trade Balance (Oct)

--

F: --

P: --

Japan Nominal GDP Revised QoQ (Q3)

--

F: --

P: --

Japan Trade Balance (Customs Data) (SA) (Oct)

--

F: --

P: --

Japan GDP Annualized QoQ Revised (Q3)

--

F: --

P: --
China, Mainland Exports YoY (CNH) (Nov)

--

F: --

P: --

China, Mainland Trade Balance (USD) (Nov)

--

F: --

P: --

Germany Industrial Output MoM (SA) (Oct)

--

F: --

P: --

Euro Zone Sentix Investor Confidence Index (Dec)

--

F: --

P: --

Canada Leading Index MoM (Nov)

--

F: --

P: --

Canada National Economic Confidence Index

--

F: --

P: --

U.S. Dallas Fed PCE Price Index YoY (Sept)

--

F: --

P: --

U.S. 3-Year Note Auction Yield

--

F: --

P: --

U.K. BRC Overall Retail Sales YoY (Nov)

--

F: --

P: --

U.K. BRC Like-For-Like Retail Sales YoY (Nov)

--

F: --

P: --

Australia Overnight (Borrowing) Key Rate

--

F: --

P: --

RBA Rate Statement
RBA Press Conference
Germany Exports MoM (SA) (Oct)

--

F: --

P: --

U.S. NFIB Small Business Optimism Index (SA) (Nov)

--

F: --

P: --

Q&A with Experts
    • All
    • Chatrooms
    • Groups
    • Friends
    Connecting
    .
    .
    .
    Type here...
    Add Symbol or Code

      No matching data

      All
      Trump Updates
      Recommend
      Stocks
      Cryptocurrencies
      Central Banks
      Featured News
      • All
      • Russia-Ukraine Conflict
      • Middle East Flashpoint
      • All
      • Russia-Ukraine Conflict
      • Middle East Flashpoint
      Search
      Products

      Charts Free Forever

      Chats Q&A with Experts
      Screeners Economic Calendar Data Tools
      Membership Features
      Data Warehouse Market Trends Institutional Data Policy Rates Macro

      Market Trends

      Market Sentiment Order Book Forex Correlations

      Top Indicators

      Charts Free Forever
      Markets

      News

      News Analysis 24/7 Columns Education
      From Institutions From Analysts
      Topics Columnists

      Latest Views

      Latest Views

      Trending Topics

      Top Columnists

      Latest Update

      Signals

      Copy Rankings Latest Signals Become a signal provider AI Rating
      Contests
      Brokers

      Overview Brokers Assessment Rankings Regulators News Claims
      Broker listing Forex Brokers Comparison Tool Live Spread Comparison Scam
      Q&A Complaint Scam Alert Videos Tips to Detect Scam
      More

      Business
      Events
      Careers About Us Advertising Help Center

      White Label

      Data API

      Web Plug-ins

      Affiliate Program

      Awards Institution Evaluation IB Seminar Salon Event Exhibition
      Vietnam Thailand Singapore Dubai
      Fans Party Investment Sharing Session
      FastBull Summit BrokersView Expo
      Recent Searches
        Top Searches
          Markets
          News
          Analysis
          User
          24/7
          Economic Calendar
          Education
          Data
          • Names
          • Latest
          • Prev

          View All

          No data

          Scan to Download

          Faster Charts, Chat Faster!

          Download App
          English
          • English
          • Español
          • العربية
          • Bahasa Indonesia
          • Bahasa Melayu
          • Tiếng Việt
          • ภาษาไทย
          • Français
          • Italiano
          • Türkçe
          • Русский язык
          • 简中
          • 繁中
          Open Account
          Search
          Products
          Charts Free Forever
          Markets
          News
          Signals

          Copy Rankings Latest Signals Become a signal provider AI Rating
          Contests
          Brokers

          Overview Brokers Assessment Rankings Regulators News Claims
          Broker listing Forex Brokers Comparison Tool Live Spread Comparison Scam
          Q&A Complaint Scam Alert Videos Tips to Detect Scam
          More

          Business
          Events
          Careers About Us Advertising Help Center

          White Label

          Data API

          Web Plug-ins

          Affiliate Program

          Awards Institution Evaluation IB Seminar Salon Event Exhibition
          Vietnam Thailand Singapore Dubai
          Fans Party Investment Sharing Session
          FastBull Summit BrokersView Expo

          Gold Gains As Fed Rate Cut Bets Build Ahead of Inflation Data

          Michelle

          Forex

          Commodity

          Economic

          Summary:

          Major brokerages expect 25-basis-point Fed rate cut in December; Silver, palladium headed for weekly gain; PCE inflation data for September due at 10 a.m. ET.

          Gold prices rose on Friday as expectations that the Federal Reserve will cut interest rates next week gained traction, with investors awaiting U.S. inflation data that could clarify the central bank's next move.

          Spot goldrose 0.7% to $4,235.59 per ounce, as of 1416 GMT, and was on track for a 0.1% weekly gain.

          U.S. gold futuresfor February delivery edged 0.6% higher to $4,266.50 per ounce.

          "The odds are there for a rate cut... gold is retesting and reaffirming the $4,200/oz level. Although it has been volatile, the trajectory and momentum has been positive this week," said Alex Ebkarian, COO at Allegiance Gold.

          Lower interest rates generally support gold, which is a non-yielding asset.

          CME's FedWatch tool now shows an 87.2% chance that the U.S. central bank will cut rates next week.

          Traders are waiting for September's Personal Consumption Expenditures (PCE) data later today after it was delayed due to the government shutdown. The release is expected to show a 0.2% monthly rise and 2.9% annual growth.

          This follows Wednesday's labor market data, which showed private payrolls fell in November by the sharpest margin in over 2-1/2 years.

          Several Fed policymakers have adopted a dovish tone recently.

          Morgan Stanley projected a 25-basis-point rate cut by the Fed at its December 9-10 meeting, in line with estimates from J.P. Morgan, Bank of America, and a majority of Reuters-polled economists.

          Meanwhile, physical gold demand in India and China eased this week as buyers wait for a correction in spot prices.

          Silverrose 2.2% to $58.34 an ounce, up 3.5% for the week, after touching a record $58.98 on Wednesday.

          The white metal has rallied 101% this year, fueled by supply deficits and its designation on the U.S. critical minerals list.

          Platinumfell 0.4% to $1,640.23 and was set for a weekly loss, while palladiumgained 1.2% to $1,465.29 and was poised to end the week higher.

          Source: TradingView

          To stay updated on all economic events of today, please check out our Economic calendar
          Risk Warnings and Disclaimers
          You understand and acknowledge that there is a high degree of risk involved in trading. Following any strategies or investment methods may lead to potential losses. The content on the site is provided by our contributors and analysts for information purposes only. You are solely responsible for determining whether any trading assets, securities, strategy, or any other product is suitable for investing based on your own investment objectives and financial situation.
          Add to Favorites
          Share

          Nvidia partner Foxconn reports 26% revenue spike as AI boom continues

          Adam

          Economic

          Foxconn, a key Nvidia partner in its artificial intelligence buildout, saw its revenue spike 26% year-on-year in November, as demand for servers continued to ramp up amid the AI boom.
          The Taiwanese company, also known as Hon Hai, is the world’s largest contract electronics manufacturer and makes the servers that hold chips in data centers, as well as assembling Apple’s iPhone.
          Foxconn on Friday reported “strong growth” year-on-year for its cloud and networking products, pointing to “momentum for AI server racks,” in its monthly revenue report. It reported revenue of NT$844.3 billion ($27 billion) for November.
          A longstanding partner to many of the world’s largest tech companies including Nvidia and Apple, Foxconn has become a key player in the rollout of AI infrastructure in recent times.
          It was announced in May that the company would provide infrastructure to a major AI factory in Taiwan, in collaboration with Nvidia and the Taiwanese government. Two months later Foxconn announced it was taking a stake in data center construction company TECO Electric & Machinery Co.
          OpenAI said last month that it would collaborate with the Taiwanese company on design work and U.S. manufacturing readiness for next generation AI infrastructure hardware.
          Foxconn’s month-on-month revenue was down around 6%, with the company pointing to its smart consumer electronics segment slightly declining.
          “AI server rack shipments continue to ramp up, and ICT products are in peak season in the second half of the year,” the monthly report said in its business outlook for the fourth quarter.
          The company said in November that growth in its AI server business had seen its third-quarter profits jump 17% year-on-year.
          Foxconn’s share price has jumped 26% since the start of 2025, following a 76% uptick over the previous 12 months.

          Source: cnbc

          To stay updated on all economic events of today, please check out our Economic calendar
          Risk Warnings and Disclaimers
          You understand and acknowledge that there is a high degree of risk involved in trading. Following any strategies or investment methods may lead to potential losses. The content on the site is provided by our contributors and analysts for information purposes only. You are solely responsible for determining whether any trading assets, securities, strategy, or any other product is suitable for investing based on your own investment objectives and financial situation.
          Add to Favorites
          Share

          USD/JPY Finally Finds Some Support

          Adam

          Forex

          In thinning December markets, the Japanese yen has finally found some support. A speech earlier this week by Bank of Japan Governor Kazuo Ueda seemed to firm up views that the Bank is ready to hike on 19 December. We’re mildly bearish on USD/JPY in 2026, but it will be a slow grind

          USD: Waiting for the Seasonality to Kick In

          FX markets are relatively quiet. US interest rate volatility embodied in the MOVE index has dropped back to the lows of the year. Certainly, the stability of the US Treasury market has been one of the big surprises of 2025. As we move nearer to year-end in FX, we see the commodity currencies doing pretty well – or more precisely, the commodity currencies backed by metals. That was one of our key calls for 2026, where we favoured Chile’s peso and the South African rand on the metals story. This theme should be a multi-quarter one.
          For the big dollar, it remains slightly offered on the view that the Fed will cut rates next week and that the arrival of Kevin Hassett as Fed Chair will somehow make the Fed more dovish. Were Hassett confirmed, we would look at the dollar through the lens of US real interest rates – in other words, if the Fed took rates too low relative to inflation expectations. Looking at 2-year US real interest rates derived from the two-year inflation swap, real rates actually rose 25bp between September and November, largely on a 50bp decline in inflation expectations. The scenario from a Hassett pick would surely be lower real rates as inflation expectations pick up. This should deliver a weaker dollar.
          For the short term, however, there seems to be a consensus view that the dollar will weaken into year-end on seasonal flows. That is our view too, and why we have year-end targets at 1.18 and 152 for EUR/USD and USD/JPY, respectively. For today, the focus will be on the delayed core PCE inflation data and the latest consumer sentiment readings. Neither looks set to be a big market mover and more attention will be given to the 1800CET World Cup draw in Washington and whether President Trump is awarded FIFA’s newly minted Peace Prize.
          The longer DXY can trade under 99.00, the more likely it is a drop to the 97.80/98.00 area.

          EUR: Staying Supported

          We’ll probably be discussing this quite a lot over the coming weeks and months, but the cost for eurozone bond investors to FX hedge their US investments is tumbling. Using three-month forwards, the cost to hedge US risk back into the euro has now dropped to 1.82% per annum from 2.45% back in July. That is a big deal for a bond investor trying to pick up, say, an extra 150bp by investing in US markets. These US hedging costs are expected to drop further as the Fed cuts rates. And these dollar sales from the eurozone buy-side should be a key factor driving EUR/USD higher in 2026.
          For today, the eurozone calendar is light. This afternoon, we have a speech from ECB Chief Economist Philip Lane. The subject is global imbalances. Expect to hear more about the international role of the euro and further strong encouragement for politicians to push through reforms, such that the euro can take advantage of the move to a multipolar world.
          Back to the short term, and we have a slight bias that EUR/USD trades to 1.1700/1730 and continues to find support in the 1.1630/40 area.
          In the CEE space, the Polish central bank’s news conference left open the door for further rate cuts. After the close today, we could see Fitch revising its outlook for Hungarian sovereign debt to negative from stable. That’s not good news for Hungary, but probably not bad enough news to dislodge carry trade hunters from their investments in the forint.

          JPY: BoJ Finally Provides Some Support

          October’s spike in USD/JPY above 150 came as a shock to many (including ourselves). And by mid-November, most had concluded there was little that could turn USD/JPY around apart from heavy official intervention at 160. Additionally, we’ve been asked several times whether the yen is losing its safe-haven status. We’ve replied that the benign risk environment means the yen has not seriously been tested on that score.
          However, it now seems that the prospect of Bank of Japan hikes is finally supporting the yen. A 25bp hike is virtually priced for the 19 December meeting and the 1m JPY OIS rate, priced two years’ forward, has moved to 1.47% from 1.14% in the last month alone. The view here seems to be that the new Japanese government, despite its reflationary credentials, does not want to embrace a weak yen and will allow BoJ rate hikes. We made this point in our FX outlook – namely that a weaker yen would only add to the cost-of-living crisis that caused so many problems for the LDP in the first place.
          We’ve got a modest 152 target for USD/JPY by year-end. And also a modest 148 forecast for year-end 2026.

          GBP: Short Squeeze Continues

          Sterling continues to do well. We doubt this represents a major reassessment of UK sovereign risk, although we note that the 10-year Gilt swap spread has held onto its modest narrowing and is now at 48bp. This stood at 58bp in late September. We prefer to see the current sterling rally as a short squeeze.
          We are a little bearish on the dollar and have a year-end GBP/USD target at 1.34. But we also favour some sterling underperformance against the euro as the Bank of England restarts its easing cycle this December. That should mean EUR/GBP does not spend too much time in the low 0.87s and should be back near 0.88 or above by year-end.

          Source: investing

          Risk Warnings and Disclaimers
          You understand and acknowledge that there is a high degree of risk involved in trading. Following any strategies or investment methods may lead to potential losses. The content on the site is provided by our contributors and analysts for information purposes only. You are solely responsible for determining whether any trading assets, securities, strategy, or any other product is suitable for investing based on your own investment objectives and financial situation.
          Add to Favorites
          Share

          Musk's $140 Million Fine Shows The EU Is Losing Its Nerve

          Glendon

          Political

          Economic

          Vice President JD Vance is a master of dramatic soundbites. Rumors are swirling that the European Commission will fine X hundreds of millions of dollars for "not engaging in censorship," he tweeted on Thursday. Europe, in other words, was trying to force X's owner Elon Musk to smother the free speech of his users.

          Vance was wrong on both counts. Europe's regulatory fine against Elon Musk's X has turned out to be a more modest €120 million ($140 million). It also has nothing to do with censorship. X isn't being told what content to remove. It's simply required to be transparent about verification, advertising and provide access to third-party researchers, none of which the company has done.

          X's descent into a racist, politically radical hellscape fueled by porn in recent years is the predictable outcome of chronic opacity and deliberate obfuscation. X misled users by monetizing its blue checkmarks so anyone could become "verified." It blocked independent researchers from accessing public data and charged prohibitive fees for limited Application Programming Interface access, making it nearly impossible to study misinformation patterns, according to the Commission's findings. And the company declined to maintain a searchable, reliable advertising database too, obscuring who was paying what to influence public discourse.

          The fine represents 6% of X's $2.3 billion in projected advertising revenue for 2025. That's perfectly manageable for the world's richest person and X has 90 days to implement changes that fix the issue or it could face additional fines, Bloomberg News reported. But the penalty could have been much bigger. The Commission had originally considered calculating a fine based on Musk's entire private company portfolio, or what the Commission called the Musk Group. That would have included SpaceX's projected income of $15.5 billion for this year, along with money from xAI, Boring Co. and X. To have abandoned a higher number after a two-year investigationsuggests the EU is pulling its punches.

          The reason is almost certainly geopolitical pressure and the threat of trade retaliation. US Commerce Secretary Howard Lutnick recently told Brussels it must loosen digital laws in exchange for lower steel tariffs. The quid pro quo was explicit.

          The Commission would deny it's going soft on Big Tech. After all, it's mulling a probe into Meta Platforms Inc. over WhatsApp's artificial intelligence features, and is rolling out the world's most sweeping legislation on AI.

          But the latter legislation has been delayed, and the Commission has been similarly timid with antitrust fines this year against against Apple Inc. of €500 million and Meta of €200 million, which were tiny fractions of their revenue and well below the 10% permitted under the region's new antitrust legislation.

          X was the European Union's first probe under its other new law addressing harmful online content, known as the Digital Services Act (DSA). The law is careful about threading the needle on free speech by pushing companies to conduct more transparent risk assessments on their recommendation algorithms, to ensure they're not promoting violence, hate speech or content about eating disorders and self-harm.

          Now Europe's handling of this initial case sets the template for its enforcement against TikTok, Meta and others — and its weak response to Musk threatens to undermine the entire regulatory framework.

          Critically, Musk's case shows why consolidated power in the hands of a few tech billionaires can be so perilous. He not only controls a major social platform but also critical infrastructure that could steer the war in Ukraine (Starlink), advanced artificial intelligence (xAI) and space technology (Space X), all while having served as an advisor to the US president, a tenure that was fleeting and explosive but still retains a legacy judging by Vance's latest comments.

          Far from turning X into a town square for free speech, Musk has made it a vehicle for his personal political agenda while neglecting to build the necessary checks and balances to make such a platform safe and trustworthy. False, ideologically extreme posts go viral on X, poisoning public discourse and warping democratic decisions. It sets a precedent that could embolden other billionaire-owned platforms to prioritize ideology over the public interest. European regulators faced the exact scenario they've been striving to prevent, and they blinked.

          Source: Bloomberg Europe

          To stay updated on all economic events of today, please check out our Economic calendar
          Risk Warnings and Disclaimers
          You understand and acknowledge that there is a high degree of risk involved in trading. Following any strategies or investment methods may lead to potential losses. The content on the site is provided by our contributors and analysts for information purposes only. You are solely responsible for determining whether any trading assets, securities, strategy, or any other product is suitable for investing based on your own investment objectives and financial situation.
          Add to Favorites
          Share

          Is Europe Risk-Averse? Here Are the Countries Investing the Most

          Warren Takunda

          Economic

          Managing money effectively is key to financial security, although the best way to secure strong returns on your cash isn't always clear. In general, Europeans invest in fewer stocks than their American counterparts — instead choosing to save money in bank accounts.
          Across the EU, habits around investment nonetheless differ widely, partially influenced by market offerings and different cultural perceptions around money.
          Trade body the Association for Financial Markets in Europe (AFME) uses a 'Household Market Investment Indicator’ to measure how much of household savings are channelled into capital markets instruments.
          It looks at the value of financial instruments held by Europeans as a share of national output. The instruments included in the calculation are equity shares (stocks), investment fund shares (like ETFs), bonds, life insurance reserves, and pension fund holdings. It excludes cash, deposits, and unlisted equity .
          “These options (market-based instruments) generally offer higher long-term returns than traditional bank accounts, which often lose value after inflation,” a spokesperson at AFME told Euronews Business.

          Denmark and Sweden lead

          According to AFME’s Capital Markets Union report, household financial assets in the EU were almost equal in size to the bloc's GDP in the first half of 2025, coming to 94% of the total value.
          The report comes as the EU is debating how to best structure its capital markets to allow investment to flow into critical sectors across the bloc.
          Among EU countries, the ratio ranges from 16% in Romania to 194% in Denmark and Sweden. The Netherlands follows at 164%.
          These three countries stand well above the rest, as Italy, in fourth place, has a ratio of 119%.
          At the bottom of the ranking, savings in market instruments as a percentage of GDP is 16% in Romania. Next is Lithuania at 18% and Bulgaria at 20%.
          The ratio is 122% in the UK, which is no longer an EU country.Is Europe Risk-Averse? Here Are the Countries Investing the Most_1
          Countries that record high investment levels "typically combine three elements", said the AFME spokesperson. "These are well-developed pension schemes (e.g. NL, US, and the Nordics), tax benefits for investing, and simple, user-friendly investment accounts.”
          The AFME highlighted Sweden’s Investment Savings Account (ISK) as a strong example of how policy can encourage citizens to invest. These accounts make it easy and tax-efficient to invest in things like stocks, ETFs, and funds, said the group.
          The spokesperson noted that countries that lack these features often see lower engagement with capital markets and citizens often stick to low-yield savings accounts.

          Capital markets savings per person

          Rather than ratios alone, AFME figures also show the scale of investments. In the first half of 2025, household financial assets per person in the EU averaged €42,069.
          Among EU members, it varies from €2,880 in Romania to €150,034 in Denmark.
          Capital markets savings per person also exceed €100,000 in the Netherlands and Sweden.
          Luxembourg ranks fourth at €76,937, demonstrating how far ahead the top three countries are.Is Europe Risk-Averse? Here Are the Countries Investing the Most_2
          Nine EU countries, making up one in three in the bloc, have less than €10,000 in capital markets savings per person. Besides Romania, these countries are Bulgaria, Poland, Lithuania, Greece, Latvia, Estonia, Slovakia and Slovenia.
          This figure is €75,463 in the UK, the highest among Europe’s top five economies.

          Source: Euronews

          To stay updated on all economic events of today, please check out our Economic calendar
          Risk Warnings and Disclaimers
          You understand and acknowledge that there is a high degree of risk involved in trading. Following any strategies or investment methods may lead to potential losses. The content on the site is provided by our contributors and analysts for information purposes only. You are solely responsible for determining whether any trading assets, securities, strategy, or any other product is suitable for investing based on your own investment objectives and financial situation.
          Add to Favorites
          Share

          In Japan, Prime Minister Takaichi Tries To Avoid A 'Truss Shock'

          Justin

          Bond

          Economic

          Key points:

          · Takaichi softens tone on BOJ, borrowing
          · Long-end yields hitting record highs
          · Some investors go short on yen, bet against JGBs

          As Prime Minister Sanae Takaichi was finalising her $137 billion spending plan last month, which in recent weeks has put Japan into a standoff with investors over the outlook for government finances, a bond chart was brought to her attention.

          Finance Minister Satsuki Katayama pulled up the chart on her tablet at a November 17 meeting in Takaichi's official residence. It showed selling, which drives up long-term borrowing rates.

          The prime minister's expression turned serious, according to a person familiar with the encounter.

          "The finance minister was becoming more vigilant," the person said. "The prime minister also seemed quite concerned about the weak yen and bond-price declines."

          The person asked not to be identified because they were not authorised to speak with the media. But the concern they described was well-placed, because Takaichi is facing a challenge from the markets that she needs to fund her agenda.

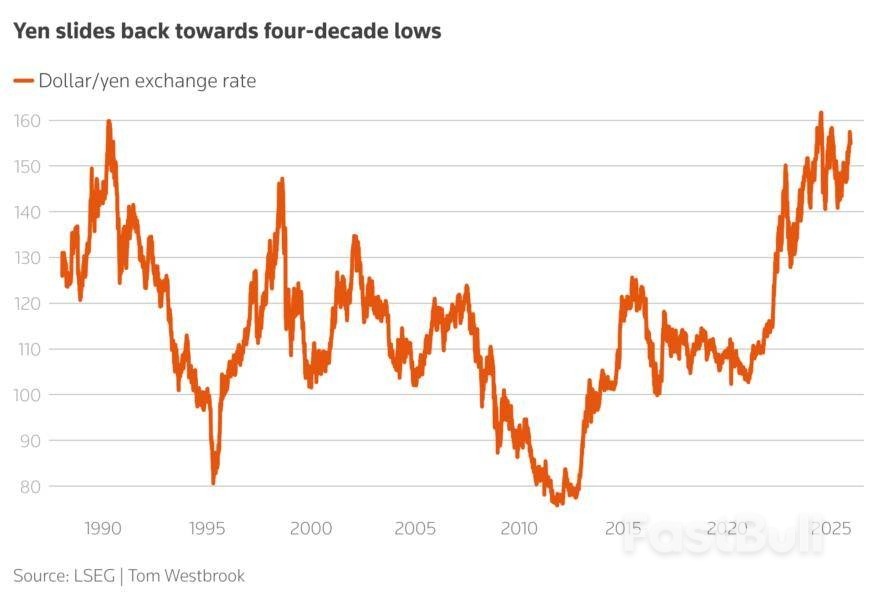
          At stake was not only her massive stimulus package, which will be paid for largely through borrowing, but the direction of the ailing yen- in real terms near record lows - and longer-term investor faith in Japanese assets.

          Takaichi's meeting with Katayama and other top officials marked the beginning of a shift in rhetoric aimed at soothing investor concerns, though it is too early to say whether it can steady the market in a durable way and keep bond vigilantes out of Japan.

          Japan's benchmark 10-year yield rose to its highest point since 2007 on Friday and has climbed 25.5 basis points in four weeks, the sharpest rise in nearly three years and one that has begun to send ripples through global markets.

          The situation is all the more delicate because of Japan's heavy debt - its debt-to-GDP ratio is by far the highest of any developed country - and how its bond market is in transition as buying from both the central bank and insurers dries up.

          Addressing the risks, Takaichi told Parliament last week that there was no possibility of a "Truss shock," downplaying parallels with the 2022 selloff in gilts and the pound that sank British Prime Minister Liz Truss' plan for unfunded tax cuts.

          She has also softened her previous resistance to monetary policy tightening and promised to limit extra borrowing. In addition, she has unveiled other initiatives including what some analysts have called the Japanese version of DOGE to cut wasteful government spending.

          On Friday, Katayama said the government was monitoring markets and would ensure the sustainability of Japan's public finances and maintain investor confidence.

          Takaichi's office did not respond to a Reuters request for comment on her November 17 meeting.

          "Takaichi's plan is to expand the growth potential of Japan ... but if that growth doesn't materialise, then the only thing remaining is the huge amount of government debt," said Toshinobu Chiba, a Tokyo-based fund manager at Simplex Asset Management.

          "And that's the problem."

          Thomson ReutersJapan yields soar as market braces for hikes and fiscal pressure

          WHO'S GOING TO BUY THESE BONDS?

          Takaichi, who came to power after her predecessor quit, has a reputation as a disciple of Shinzo Abe's "Abenomics," the massive monetary and fiscal stimulus programme aimed at rescuing Japan from stagflation that kicked off more than a decade ago.

          What surprised investors was how little of that was jettisoned when she took office, despite inflation running at 3% and the national debt exceeding 1.3 quadrillion yen ($8.5 trillion).

          Takaichi appointed a dovish coterie of economic advisors and told Parliament last month she would water down Japan's fiscal target to allow for multi-year spending on key growth areas.

          And when an early draft of the stimulus plan was crafted by the finance ministry, she quickly turned it down because it was too modest in size, according to the Nikkei newspaper.

          "What you have is, I would say, a very loose policy mix overall and basically a monetary boom," said Ian Samson, a multi-asset portfolio manager at Fidelity International.

          "I'm personally short yen because I think that's the path of least resistance."

          Extra bond sales will also test an already fragile market, where demand - especially for long-dated paper - has traditionally been uneven from foreign investors and has been drying up for years from domestic banks and insurers.

          After accounting for redemptions and decreased purchases by the Bank of Japan, net supply in the market will jump by nearly 11 trillion yen in 2026 from 58 trillion in 2025, according to Bank of America estimates.

          "The problem is ... who's going to buy these bonds?" said Sally Greig, head of global bonds at Scottish long-only manager Baillie Gifford. "We've still got more supply to absorb and Japan's not the only one spending money."

          Thomson ReutersYen slides back towards long-term lows

          SHORT YEN

          Some dealers said there had even been a small increase in short interest in bonds, particularly over the past week, though positions were small.

          "The dynamics in the JGB market are more indicative of a lack of buying interest, rather than outright selling," said Daiki Hayashi, head of Japan market sales and marketing at J.P. Morgan in Tokyo.

          Bets against the yen, however, may start to pick up, despite Takaichi's preference for a stronger currency and a recent escalation of intervention warnings, traders say.

          "There would definitely be interest to look at shorting the yen if we can move to between 153 and 154 (per dollar)," said Patrick Law, head of APAC fixed-income, currencies and commodities trading at Bank of America in Hong Kong.

          The yentraded at 155 per dollar on Friday and has slid some 5% versus the dollar since Takaichi was appointed as leader of Japan's ruling party in early October.

          To be sure, positioning in the market is not clear because data has been delayed by the U.S. government shutdown, and there remain a number of forecasts for a stronger yen.

          Morgan Stanley, for example, expects the yen to hit 140 per dollar in the first half of 2026 and chief Asia and emerging-market equity strategist Jonathan Garner said yields were rising as part of a healthy reflation of the economy.

          And that still makes for a difficult moment to step into the bond market.

          "Investors, including pensions and banks, still have a big capacity to buy more JGBs," said J.P. Morgan's Hayashi, particularly around the details of the government's bond-issuance plan. "What they need is greater transparency."

          "Until this is clarified, I think it will likely remain difficult for investors to buy JGBs aggressively."

          Source: TradingView

          To stay updated on all economic events of today, please check out our Economic calendar
          Risk Warnings and Disclaimers
          You understand and acknowledge that there is a high degree of risk involved in trading. Following any strategies or investment methods may lead to potential losses. The content on the site is provided by our contributors and analysts for information purposes only. You are solely responsible for determining whether any trading assets, securities, strategy, or any other product is suitable for investing based on your own investment objectives and financial situation.
          Add to Favorites
          Share

          Natural Gas and Oil Forecast: Rising Channels and Geopolitical Tensions Shape Prices

          Adam

          Commodity

          Market Overview

          Crude oil climbed to a two-week high as geopolitical tensions tightened global supply expectations. Disruptions to key export routes pushed Russian product shipments down to 1.7 million bpd, a three-year low, while tanker storage surged 12 percent to 124.6 million barrels, signaling constrained flow.
          Saudi Arabia’s price cut for Asian buyers underscored softer demand, tempering gains. Meanwhile, OPEC+ maintained its plan to pause output increases amid forecasts for a Russian product surplus next year.
          US crude inventories remain 3 percent below seasonal norms, and rig counts dropped to a four-year low, adding further uncertainty to oil and natural gas forecasts.

          Natural Gas Price Forecast

          Natural Gas and Oil Forecast: Rising Channels and Geopolitical Tensions Shape Prices_1Natural Gas (NG) Price Chart

          Natural Gas (NG) is trading around $5.08, respecting a rising channel that has guided price action since late November. The upper boundary near $5.11 is acting as immediate resistance, with recent candles showing hesitation through small upper wicks.
          Support sits at the mid-channel line near $4.95, followed by stronger structure at $4.80. The 50-EMA is rising and holding beneath price, confirming a steady uptrend, while the 200-EMA provides deeper support near $4.69.
          RSI remains just below 60, indicating controlled bullish momentum without overbought conditions. A breakout above $5.11 may open $5.26 and $5.40, while a drop below $4.95 risks a move toward $4.80 and the lower channel line.

          WTI Oil Price Forecast

          Natural Gas and Oil Forecast: Rising Channels and Geopolitical Tensions Shape Prices_2WTI Price Chart

          WTI Crude Oil (USOIL) is trading around $59.55, moving inside a rising channel with clear support at $59.20 and resistance near $60.01. Recent 2H candles show rejection wicks at the upper boundary, signaling supply near $60. Price is repeatedly holding the mid-channel trendline, keeping the short-term structure intact.
          The 50-EMA and 200-EMA remain flat, showing a balanced market. RSI is hovering around 50, indicating neutral momentum but no overextended conditions.
          A dip toward $59.20 could attract buyers if the lower trendline holds. A break below that level exposes $58.40. A close above $60.01 would confirm strength and open the path toward $60.80 and $61.46.

          Brent Oil Price Forecast

          Natural Gas and Oil Forecast: Rising Channels and Geopolitical Tensions Shape Prices_3Brent Price Chart

          Brent Oil (UKOIL) is trading near $63.20, sitting inside a tightening symmetrical triangle formed by descending resistance from $63.61 and rising support from the $61.85–$62.50 region. Recent 2H candles show hesitation at the triangle’s upper boundary, with small rejection wicks signaling supply around $63.60.
          The 50-EMA is flattening while price fluctuates around the 200-EMA, showing indecision ahead of a breakout. RSI holds near 50, reflecting balanced momentum.
          A move below $63.00 exposes the lower trendline at $62.80, while a breakdown opens $62.53 and $61.85. A clean close above $63.61 would invalidate the triangle and allow upside toward $64.40 and $65.07. The pattern remains neutral until price leaves the apex.

          Source: fxempire

          Risk Warnings and Disclaimers
          You understand and acknowledge that there is a high degree of risk involved in trading. Following any strategies or investment methods may lead to potential losses. The content on the site is provided by our contributors and analysts for information purposes only. You are solely responsible for determining whether any trading assets, securities, strategy, or any other product is suitable for investing based on your own investment objectives and financial situation.
          Add to Favorites
          Share
          FastBull
          Copyright © 2025 FastBull Ltd

          728 RM B 7/F GEE LOK IND BLDG NO 34 HUNG TO RD KWUN TONG KLN HONG KONG

          TelegramInstagramTwitterfacebooklinkedin
          App Store Google Play Google Play
          Products
          Charts

          Chats

          Q&A with Experts
          Screeners
          Economic Calendar
          Data
          Tools
          Membership
          Features
          Function
          Markets
          Copy Trading
          Latest Signals
          Contests
          News
          Analysis
          24/7
          Columns
          Education
          Company
          Careers
          About Us
          Contact Us
          Advertising
          Help Center
          Feedback
          User Agreement
          Privacy Policy
          Business

          White Label

          Data API

          Web Plug-ins

          Poster Maker

          Affiliate Program

          Risk Disclosure

          The risk of loss in trading financial instruments such as stocks, FX, commodities, futures, bonds, ETFs and crypto can be substantial. You may sustain a total loss of the funds that you deposit with your broker. Therefore, you should carefully consider whether such trading is suitable for you in light of your circumstances and financial resources.

          No decision to invest should be made without thoroughly conducting due diligence by yourself or consulting with your financial advisors. Our web content might not suit you since we don't know your financial conditions and investment needs. Our financial information might have latency or contain inaccuracy, so you should be fully responsible for any of your trading and investment decisions. The company will not be responsible for your capital loss.

          Without getting permission from the website, you are not allowed to copy the website's graphics, texts, or trademarks. Intellectual property rights in the content or data incorporated into this website belong to its providers and exchange merchants.

          Not Logged In

          Log in to access more features

          FastBull Membership

          Not yet

          Purchase

          Become a signal provider
          Help Center
          Customer Service
          Dark Mode
          Price Up/Down Colors

          Log In

          Sign Up

          Position
          Layout
          Fullscreen
          Default to Chart
          The chart page opens by default when you visit fastbull.com