• Trade
  • Markets
  • Copy
  • Contests
  • News
  • 24/7
  • Calendar
  • Q&A
  • Chats
Trending
Screeners
SYMBOL
LAST
BID
ASK
HIGH
LOW
NET CHG.
%CHG.
SPREAD
SPX
S&P 500 Index
6848.60
6848.60
6848.60
6861.30
6843.84
+21.19
+ 0.31%
--
DJI
Dow Jones Industrial Average
48615.65
48615.65
48615.65
48679.14
48557.21
+157.61
+ 0.33%
--
IXIC
NASDAQ Composite Index
23251.24
23251.24
23251.24
23345.56
23240.37
+56.08
+ 0.24%
--
USDX
US Dollar Index
97.820
97.900
97.820
98.070
97.810
-0.130
-0.13%
--
EURUSD
Euro / US Dollar
1.17570
1.17578
1.17570
1.17596
1.17262
+0.00176
+ 0.15%
--
GBPUSD
Pound Sterling / US Dollar
1.33955
1.33964
1.33955
1.33970
1.33546
+0.00248
+ 0.19%
--
XAUUSD
Gold / US Dollar
4332.84
4333.18
4332.84
4350.16
4294.68
+33.45
+ 0.78%
--
WTI
Light Sweet Crude Oil
56.876
56.906
56.876
57.601
56.789
-0.357
-0.62%
--

Community Accounts

Signal Accounts
--
Profit Accounts
--
Loss Accounts
--
View More

Become a signal provider

Sell trading signals to earn additional income

View More

Guide to Copy Trading

Get started with ease and confidence

View More

Signal Accounts for Members

All Signal Accounts

Best Return
  • Best Return
  • Best P/L
  • Best MDD
Past 1W
  • Past 1W
  • Past 1M
  • Past 1Y

All Contests

  • All
  • Trump Updates
  • Recommend
  • Stocks
  • Cryptocurrencies
  • Central Banks
  • Featured News
Top News Only
Share

The Nasdaq Golden Dragon China Index Fell 0.9% In Early Trading

Share

The S&P 500 Opened 32.78 Points Higher, Or 0.48%, At 6860.19; The Dow Jones Industrial Average Opened 136.31 Points Higher, Or 0.28%, At 48594.36; And The Nasdaq Composite Opened 134.87 Points Higher, Or 0.58%, At 23330.04

Share

Miran: Goods Inflation Could Be Settling In At A Higher Level Than Was Normal Before The Pandemic, But That Will Be More Than Offset By Housing Disinflation

Share

Miran, Who Dissented In Favor Of A Larger Cut At Last Fed Meeting, Repeats Keeping Policy Too Tight Will Lead To Job Losses

Share

Miran: Does Not Think Higher Goods Inflation Is Mostly From Tariffs, But Acknowledges Does Not Have A Full Explanation For It

Share

Toronto Stock Index .GSPTSE Rises 67.16 Points, Or 0.21 Percent, To 31594.55 At Open

Share

Miran: Excluding Housing And Non-Market Based Items, Core Pce Inflation May Be Below 2.3%, “Within Noise” Of The Fed's 2% Target

Share

Polish State Assets Minister Balczun Says Jsw Needs Over USD 830 Million Financing To Keep Liquidity For A Year

Share

Miran: Prices Are “Once Again Stable” And Monetary Policy Should Reflect That

Share

Fed's Miran: Current Excess Inflation Is Not Reflective Of Underlying Supply And Demand In The Economy

Share

Portugal Treasury Puts 2026 Net Financing Needs At 13 Billion Euros, Up From 10.8 Billion In 2025

Share

Portugal Treasury Expects 2026 Net Financing Needs At 29.4 Billion Euros, Up From 25.8 Billion In 2025

Share

Bank Of America Says With Indonesia's Smelter Now Ramping Up, It Expects Aluminium Supply Growth To Accelerate To 2.6% Year On Year In 2026

Share

Bank Of America Expects A Deficit In Aluminium Next Year And Sees Prices Pushing Above $3000/T

Share

Fed Data - USA Effective Federal Funds Rate At 3.64 Percent On 12 December On $102 Billion In Trades Versus 3.64 Percent On $99 Billion On 11 December

Share

Brazil's Petrobras Says No Impact Seen On Oil, Petroleum Products Output As Workers Start Planned Strike

Share

Statement: US Travel Group Warns New Proposed Trump Administration Requirements For Foreign Tourists To Provide Social Media Histories Could Mean Millions Of People Opting Not To Visit

Share

Blackrock: Kerry White Will Become Head Of Citi Investment Management At Citi Wealth

Share

Blackrock: Rob Jasminski, Head Of Citi Investment Management, Has Joined With Team

Share

Blackrock: Effective Dec 15, Citi Investment Management Employees Will Join Blackrock

TIME
ACT
FCST
PREV
Japan Tankan Small Manufacturing Outlook Index (Q4)

A:--

F: --

P: --

Japan Tankan Large Non-Manufacturing Outlook Index (Q4)

A:--

F: --

P: --

Japan Tankan Large Manufacturing Outlook Index (Q4)

A:--

F: --

P: --

Japan Tankan Small Manufacturing Diffusion Index (Q4)

A:--

F: --

P: --

Japan Tankan Large Manufacturing Diffusion Index (Q4)

A:--

F: --

P: --

Japan Tankan Large-Enterprise Capital Expenditure YoY (Q4)

A:--

F: --

P: --

U.K. Rightmove House Price Index YoY (Dec)

A:--

F: --

P: --

China, Mainland Industrial Output YoY (YTD) (Nov)

A:--

F: --

P: --

China, Mainland Urban Area Unemployment Rate (Nov)

A:--

F: --

P: --

Saudi Arabia CPI YoY (Nov)

A:--

F: --

P: --

Euro Zone Industrial Output YoY (Oct)

A:--

F: --

P: --

Euro Zone Industrial Output MoM (Oct)

A:--

F: --

P: --

Canada Existing Home Sales MoM (Nov)

A:--

F: --

P: --

Canada National Economic Confidence Index

A:--

F: --

P: --

Canada New Housing Starts (Nov)

A:--

F: --

P: --
U.S. NY Fed Manufacturing Employment Index (Dec)

A:--

F: --

P: --

U.S. NY Fed Manufacturing Index (Dec)

A:--

F: --

P: --

Canada Core CPI YoY (Nov)

A:--

F: --

P: --

Canada Manufacturing Unfilled Orders MoM (Oct)

A:--

F: --

P: --

U.S. NY Fed Manufacturing Prices Received Index (Dec)

A:--

F: --

P: --

U.S. NY Fed Manufacturing New Orders Index (Dec)

A:--

F: --

P: --

Canada Manufacturing New Orders MoM (Oct)

A:--

F: --

P: --

Canada Core CPI MoM (Nov)

A:--

F: --

P: --

Canada Trimmed CPI YoY (SA) (Nov)

A:--

F: --

P: --

Canada Manufacturing Inventory MoM (Oct)

A:--

F: --

P: --

Canada CPI YoY (Nov)

A:--

F: --

P: --

Canada CPI MoM (Nov)

A:--

F: --

P: --

Canada CPI YoY (SA) (Nov)

A:--

F: --

P: --

Canada Core CPI MoM (SA) (Nov)

A:--

F: --

P: --

Canada CPI MoM (SA) (Nov)

A:--

F: --

P: --

Federal Reserve Board Governor Milan delivered a speech
U.S. NAHB Housing Market Index (Dec)

--

F: --

P: --

Australia Composite PMI Prelim (Dec)

--

F: --

P: --

Australia Services PMI Prelim (Dec)

--

F: --

P: --

Australia Manufacturing PMI Prelim (Dec)

--

F: --

P: --

Japan Manufacturing PMI Prelim (SA) (Dec)

--

F: --

P: --

U.K. 3-Month ILO Employment Change (Oct)

--

F: --

P: --

U.K. Unemployment Claimant Count (Nov)

--

F: --

P: --

U.K. Unemployment Rate (Nov)

--

F: --

P: --

U.K. 3-Month ILO Unemployment Rate (Oct)

--

F: --

P: --

U.K. Average Weekly Earnings (3-Month Average, Including Bonuses) YoY (Oct)

--

F: --

P: --

U.K. Average Weekly Earnings (3-Month Average, Excluding Bonuses) YoY (Oct)

--

F: --

P: --

France Services PMI Prelim (Dec)

--

F: --

P: --

France Composite PMI Prelim (SA) (Dec)

--

F: --

P: --

France Manufacturing PMI Prelim (Dec)

--

F: --

P: --

Germany Services PMI Prelim (SA) (Dec)

--

F: --

P: --

Germany Manufacturing PMI Prelim (SA) (Dec)

--

F: --

P: --

Germany Composite PMI Prelim (SA) (Dec)

--

F: --

P: --

Euro Zone Composite PMI Prelim (SA) (Dec)

--

F: --

P: --

Euro Zone Services PMI Prelim (SA) (Dec)

--

F: --

P: --

Euro Zone Manufacturing PMI Prelim (SA) (Dec)

--

F: --

P: --

U.K. Services PMI Prelim (Dec)

--

F: --

P: --

U.K. Manufacturing PMI Prelim (Dec)

--

F: --

P: --

U.K. Composite PMI Prelim (Dec)

--

F: --

P: --

Euro Zone ZEW Economic Sentiment Index (Dec)

--

F: --

P: --

Germany ZEW Current Conditions Index (Dec)

--

F: --

P: --

Germany ZEW Economic Sentiment Index (Dec)

--

F: --

P: --

Euro Zone Trade Balance (Not SA) (Oct)

--

F: --

P: --

Euro Zone ZEW Current Conditions Index (Dec)

--

F: --

P: --

Euro Zone Trade Balance (SA) (Oct)

--

F: --

P: --

U.S. Retail Sales MoM (Excl. Automobile) (SA) (Oct)

--

F: --

P: --

Q&A with Experts
    • All
    • Chatrooms
    • Groups
    • Friends
    Connecting
    .
    .
    .
    Type here...
    Add Symbol or Code

      No matching data

      All
      Trump Updates
      Recommend
      Stocks
      Cryptocurrencies
      Central Banks
      Featured News
      • All
      • Russia-Ukraine Conflict
      • Middle East Flashpoint
      • All
      • Russia-Ukraine Conflict
      • Middle East Flashpoint
      Search
      Products

      Charts Free Forever

      Chats Q&A with Experts
      Screeners Economic Calendar Data Tools
      Membership Features
      Data Warehouse Market Trends Institutional Data Policy Rates Macro

      Market Trends

      Market Sentiment Order Book Forex Correlations

      Top Indicators

      Charts Free Forever
      Markets

      News

      News Analysis 24/7 Columns Education
      From Institutions From Analysts
      Topics Columnists

      Latest Views

      Latest Views

      Trending Topics

      Top Columnists

      Latest Update

      Signals

      Copy Rankings Latest Signals Become a signal provider AI Rating
      Contests
      Brokers

      Overview Brokers Assessment Rankings Regulators News Claims
      Broker listing Forex Brokers Comparison Tool Live Spread Comparison Scam
      Q&A Complaint Scam Alert Videos Tips to Detect Scam
      More

      Business
      Events
      Careers About Us Advertising Help Center

      White Label

      Data API

      Web Plug-ins

      Affiliate Program

      Awards Institution Evaluation IB Seminar Salon Event Exhibition
      Vietnam Thailand Singapore Dubai
      Fans Party Investment Sharing Session
      FastBull Summit BrokersView Expo
      Recent Searches
        Top Searches
          Markets
          News
          Analysis
          User
          24/7
          Economic Calendar
          Education
          Data
          • Names
          • Latest
          • Prev

          View All

          No data

          Scan to Download

          Faster Charts, Chat Faster!

          Download App
          English
          • English
          • Español
          • العربية
          • Bahasa Indonesia
          • Bahasa Melayu
          • Tiếng Việt
          • ภาษาไทย
          • Français
          • Italiano
          • Türkçe
          • Русский язык
          • 简中
          • 繁中
          Open Account
          Search
          Products
          Charts Free Forever
          Markets
          News
          Signals

          Copy Rankings Latest Signals Become a signal provider AI Rating
          Contests
          Brokers

          Overview Brokers Assessment Rankings Regulators News Claims
          Broker listing Forex Brokers Comparison Tool Live Spread Comparison Scam
          Q&A Complaint Scam Alert Videos Tips to Detect Scam
          More

          Business
          Events
          Careers About Us Advertising Help Center

          White Label

          Data API

          Web Plug-ins

          Affiliate Program

          Awards Institution Evaluation IB Seminar Salon Event Exhibition
          Vietnam Thailand Singapore Dubai
          Fans Party Investment Sharing Session
          FastBull Summit BrokersView Expo

          Global Stocks Are Signaling a Rare Bullish Opportunity

          Adam

          Stocks

          Summary:

          Global equities just broke key resistance to all-time highs. Supportive rate cuts, weak US dollar, and cheaper valuations align for a rare bullish setup—though recession or shocks remain key risks.

          Global Equities are breaking out, and there are three key drivers of further upside.
          But most investors are still skeptical.
          They’ve also been on a much more volatile and ranging path vs the near-exponential run in US stocks. But as noted, there is good reason to believe that things are different this time (in a good way), and I’ve got the charts to prove it…
          Here’s why you should be bullish on Global Equities:
          Technicals: global ex-US equities have broken out through a major long-term overhead resistance level to new all-time highs (i.e., the MSCI World Ex USA All Countries World Index, excluding USA). And they did it with strong (and improving) breadth.
          Monetary: while the Fed is a whole different issue, globally we’ve seen a widespread rush to rate cuts (which typically points to an acceleration in global growth and upside in stocks), the US dollar has also entered into a bear market, which helps global ex-US equities on multiple fronts (FX translation effects for US$ denominated investors, easier financial conditions, bullish self-reinforcing flows dynamics).
          Valuations: as noted last week, just about every country in the world is trading at least 20% cheaper than the USA (and in many cases the relative value discount is much more significant than that) —and absolute valuations are also attractive (all 3 major country groups are cheap/fair vs history: ample room to run).
          In my experience, when you achieve alignment across technicals, monetary factors, and valuations, you have something special, and you want to treat it with appropriate conviction (in this case, strong bullish).
          For completeness, I will say that no investment thesis is ever infallible (“failure is always an option”). In my almost 10 years of running Topdown Charts, I’ve seen plenty of great ideas get completely ruined by unforeseen forces (and mediocre ones get carried by upside surprises too, for that matter).
          The key risks to this idea would be that despite the monetary tailwinds in play the global economy somehow falls into recession (recessions are bull market killers —the main fundamental driver of bear markets historically has been economic recessions), or some sort of external and unforeseeable shock (e.g. geopolitics, financial crisis, etc), or maybe a surge in inflation and interest rates (which is entirely possible).
          You might be able to see 2 of those risks coming via early warning indicators, but the unknown unknowns will always haunt us from the shadows and the only thing you can do about those is to practice smart diversification and prudent risk management.
          Other than that, though, I would emphasize again: it looks genuinely good here for global equities, and in a way that we haven’t seen in years.
          And at the end of the day, when it looks like a bull, walks like a bull, and talks like a bull, it probably is.
          Global Stocks Are Signaling a Rare Bullish Opportunity_1

          Source: investing

          Risk Warnings and Disclaimers
          You understand and acknowledge that there is a high degree of risk involved in trading. Following any strategies or investment methods may lead to potential losses. The content on the site is provided by our contributors and analysts for information purposes only. You are solely responsible for determining whether any trading assets, securities, strategy, or any other product is suitable for investing based on your own investment objectives and financial situation.
          Add to Favorites
          Share

          Trump’s Sanctions Unintentionally Unite The BRICS

          Thomas

          Economic

          By seeking to isolate his rivals, Donald Trump could well get the opposite effect. Under the pressure of his trade sanctions, the countries of the BRICS bloc, long divided, are beginning an unprecedented strategic rapprochement. As tensions rise, China, India, Russia and their partners seem more willing than ever to cooperate economically and diplomatically.

          In brief

          • Donald Trump imposes severe trade sanctions on BRICS countries, with record tariffs reaching up to 145% for China.
          • These measures create common ground among BRICS members, who respond with a coordinated strategy to reduce their dependence on the dollar.
          • China, India and Russia are preparing to hold an unprecedented trilateral summit in six years, amid rising tensions with the United States.
          • Despite persistent disagreements, especially between India and China, BRICS is developing pragmatic cooperation in trade and strategic resources.

          Tariff pressure that unites BRICS

          Since his return to the White House, Donald Trump has chosen to confront the BRICS head-on through an aggressive trade policy, marked by unprecedented tariff increases. The figures speak for themselves and illustrate a resolutely punitive strategy:

          • China was threatened with a 145% tariff if no compromise was found with Washington;
          • India is hit by a 50% tariff, half of which is specifically related to the purchase of discounted Russian oil;
          • Brazil is also subject to 50% customs duties on certain exports;
          • South Africa suffers a 30% charge, despite its limited direct trade exposure to the United States;
          • Egypt, a new entrant to the BRICS bloc, could see its taxes increase simply due to its participation in the group.

          Ajay Srivastava, a former senior Indian trade official, points out that these sanctions only fuel a common front: “they give them a common incentive to reduce their dependence on the United States, even if their agendas differ”.

          Faced with this external pressure, BRICS alliance countries are responding convergently. The group’s central banks have increased their gold purchases, and bilateral trade agreements in national currencies (yuan, rupee, ruble) are multiplying. This momentum, once sporadic, now takes the form of a deliberate strategy to reduce dependence on the US dollar.

          Pragmatic cooperation despite internal tensions

          As trade tensions with the United States intensify, leaders of the main BRICS members are preparing to display their unity at the Shanghai Cooperation Organization (SCO) summit, to be held in Tianjin, China.

          For the first time in six years, a trilateral summit between China, India and Russia is planned. The Kremlin is pushing in this direction, hoping to “strengthen the core of the BRICS alliance” and ease historic tensions between New Delhi and Beijing. This is a deliberate attempt to consolidate the group’s hard core in the face of Western pressure.

          This initiative is accompanied by bilateral détente signals. Beijing and New Delhi, long at odds over their 3,500-kilometer border, have reopened direct flights, facilitated visa access and engaged in discussions on rare earth supply, a sector in which China holds over 85% of the world’s processing capacity.

          During an official visit, Chinese Foreign Minister Wang Yi confirmed that China is committed to increasing deliveries to India, essential for its defense industries and energy transition.

          Nevertheless, mistrust persists, notably due to Beijing’s closeness to Islamabad and the controversial Chinese dam project on the Tibetan plateau, which worries New Delhi. This geopolitical complexity limits the scope of a true rapprochement, especially as India continues to rely heavily on the American market, with $77.5 billion in exports to the US in 2024, against much smaller volumes to China or Russia.

          However, beyond tensions, a pragmatic logic seems to emerge. BRICS is no longer a mere ideological platform. The bloc becomes a variable geometry cooperation space, focused on trade, finance and supply chains. Thus, projects for settlement in local currencies, “Buy BRICS” campaigns, and ambitions to reform global governance (notably via the WTO) attest to this. While the BRICS single currency project is on hold, alternatives to the dollar are taking shape.

          Source: CryptoSlate

          To stay updated on all economic events of today, please check out our Economic calendar
          Risk Warnings and Disclaimers
          You understand and acknowledge that there is a high degree of risk involved in trading. Following any strategies or investment methods may lead to potential losses. The content on the site is provided by our contributors and analysts for information purposes only. You are solely responsible for determining whether any trading assets, securities, strategy, or any other product is suitable for investing based on your own investment objectives and financial situation.
          Add to Favorites
          Share

          China Is Pouring Exports Into Africa Faster Than Anywhere Else

          Winkelmann

          Economic

          Forex

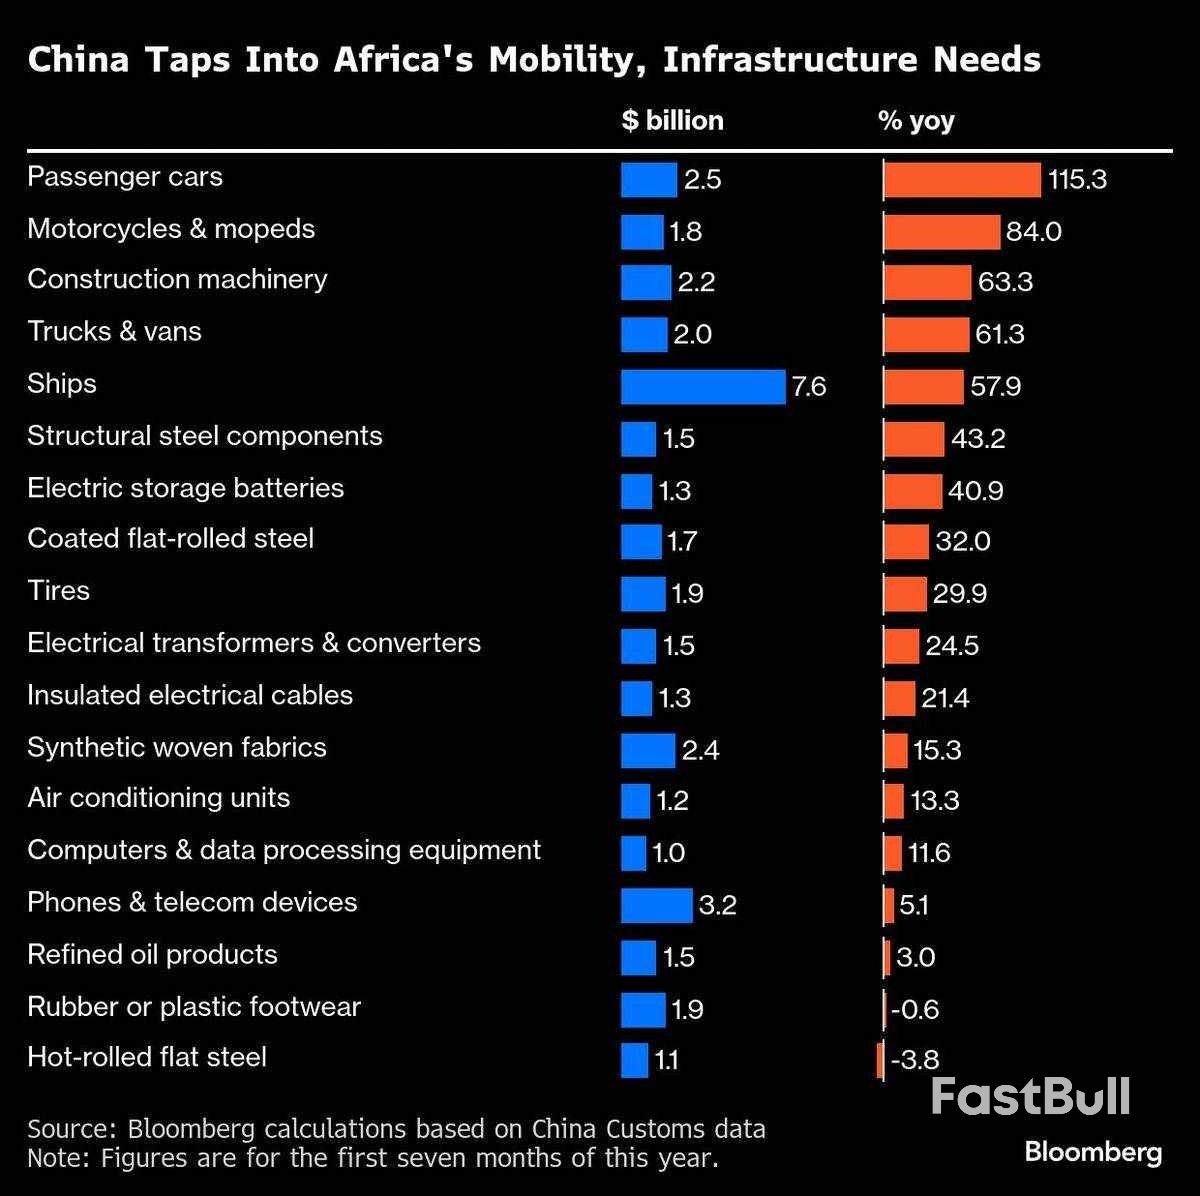
          Africa has become a new hotspot for Chinese exports as Donald Trump’s tariffs redraw trade for the world’s biggest manufacturing nation.With a 25% on-year jump to US$122 billion (RM514.78 billion), growth in sales to the continent of 1.5 billion people has far outpaced other major markets this year while orders from the US slumped. China’s exports to Africa so far in 2025 are more than in the whole of 2020 and on track to exceed US$200 billion for the first time.

          Although the trading relationship shows no sign of becoming less lopsided, with China running a far wider surplus with Africa than last year, Beijing is cracking open its domestic market while seizing on the chance to meet the continent’s infrastructure needs.“Chinese exporters have done a genuinely impressive job of diversifying into emerging markets in recent years, including in Africa,” said Christopher Beddor, deputy China research director at Gavekal Dragonomics. “The weaker yuan this year has probably also made Chinese exports more competitive in African countries.”

          The trade war has supercharged a boom that was years in the making, spearheaded by President Xi Jinping’s Belt and Road Initiative unveiled in 2013. And as Chinese companies snapped up contracts to build everything from railways to industrial parks across the continent, the demand for the machinery and materials to complete these projects followed this year.

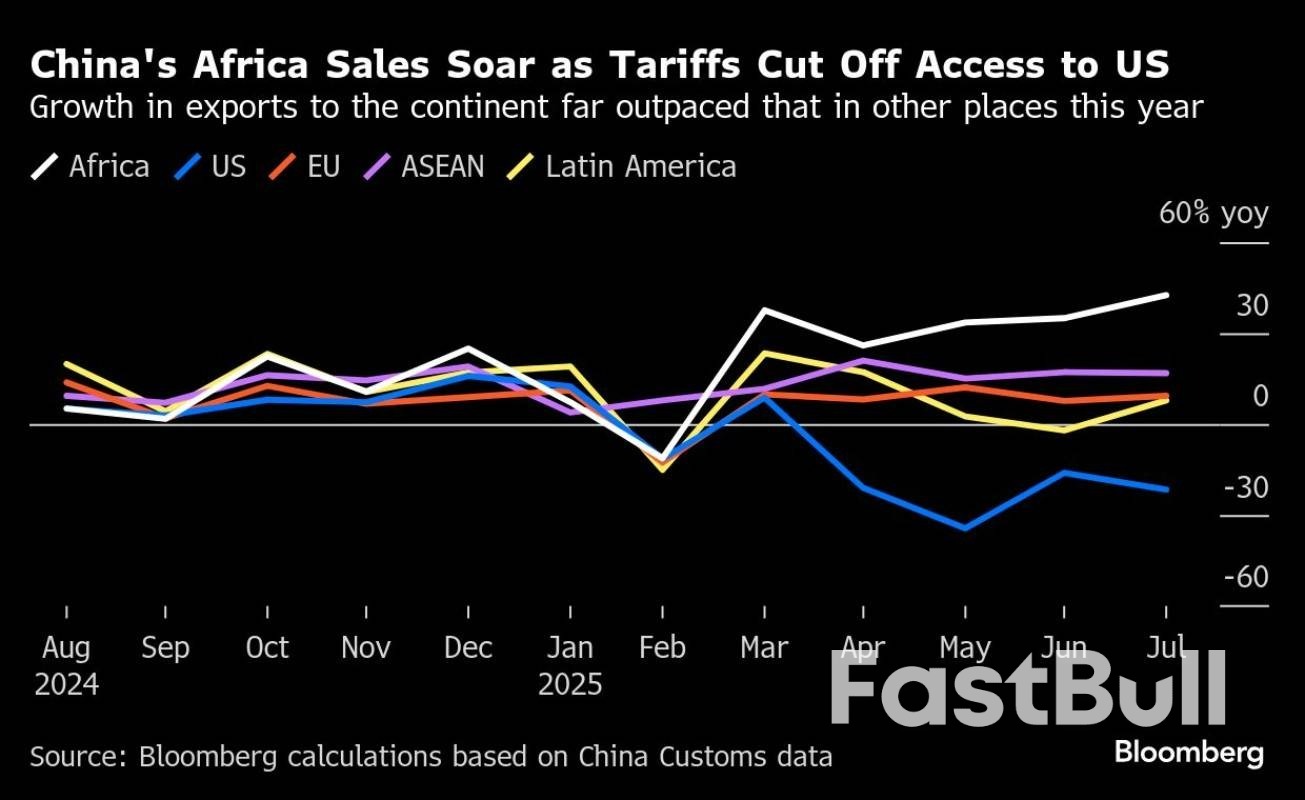
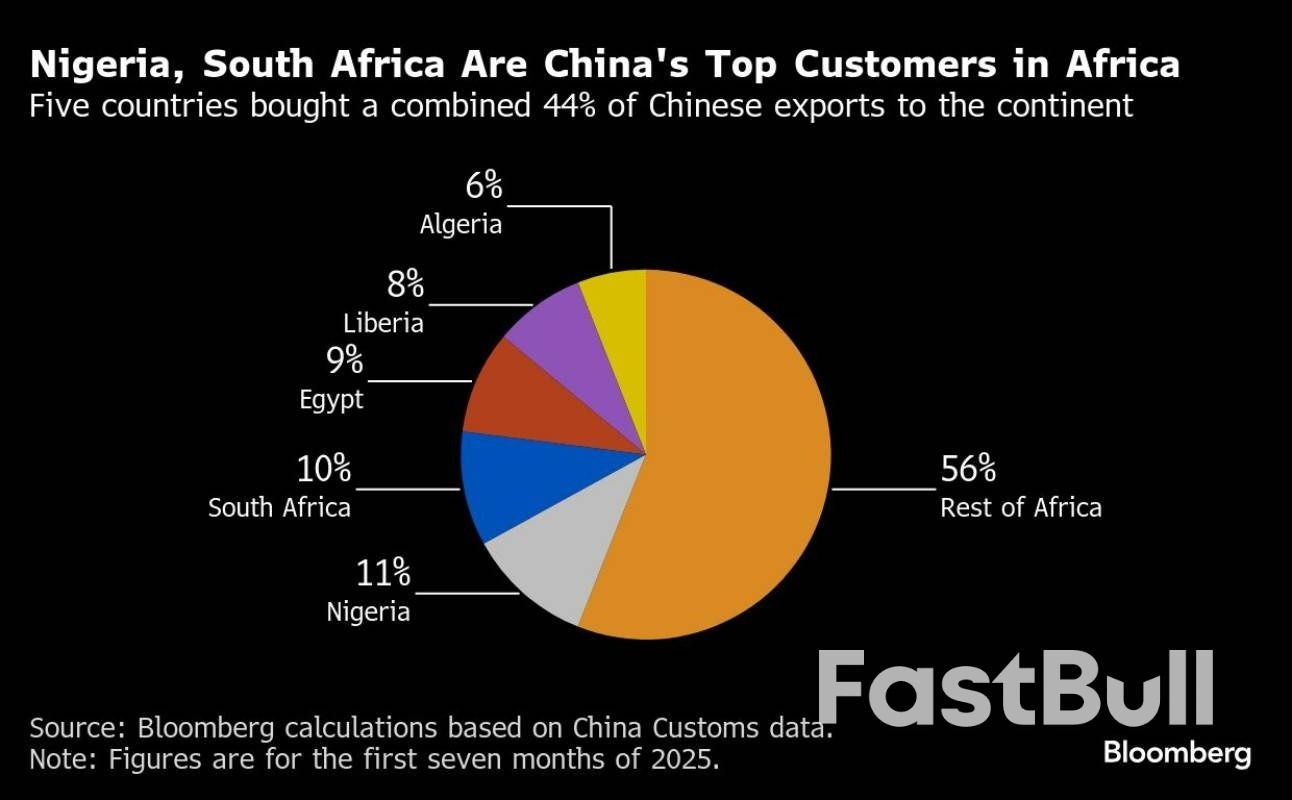
          Nigeria, South Africa and Egypt are the biggest African buyers of Chinese products. Construction machinery was among China’s fastest growing exports to Africa in the first seven months, surging 63% year on year.Shipments of passenger cars more than doubled from a year earlier and some steel products expanded in high double digits. At the same time, Africa’s share of China’s total exports remains modest at about 6%, roughly half the level for the US.

          Some goods destined for the US are possibly being diverted through Africa, according to Gavekal’s Beddor, a tactic known as transshipment.Rising protectionism in Washington has given extra incentive for Africa to buy from Beijing. A number of goods from more than 30 nations on the continent that had duty-free access to American markets granted under the African Growth and Opportunity Act are now being subjected to a range of tariffs by the Trump administration.

          In a counterpoint to Trump, Xi said in June that China is removing levies on imports from all African nations with which it has diplomatic ties.During the same month, the government in Beijing allowed imports of agricultural products from Ethiopia, Congo, Gambia, and Malawi, bringing to 19 the number of African countries with access to China’s market.

          In Africa, China could bring know-how and its vast industrial machine to a continent struggling with costly logistics and held back by its patchy infrastructure, with less than half of the population having reliable electricity access.In the first half of 2025 alone, Africa inked US$30.5 billion in construction contracts with China, according to a July report from Griffith University in Australia and the Green Finance & Development Center, founded at Shanghai-based Fudan University. That’s five times the amount during the same period last year and the most among all regions included in Xi’s infrastructure initiative.

          “Energy resources remain unevenly distributed in Africa, with some nations heavily reliant on imports” like oil, said Zhou Mi, a senior researcher at the Chinese Academy of International Trade and Economic Cooperation, a think tank under the Ministry of Commerce.“Alternatives offered by China, such as solar and wind power as well as electric cars, can help African countries overcome energy bottlenecks, prompting them to increase imports from the country in pursuit of energy independence and economic development,” he said.

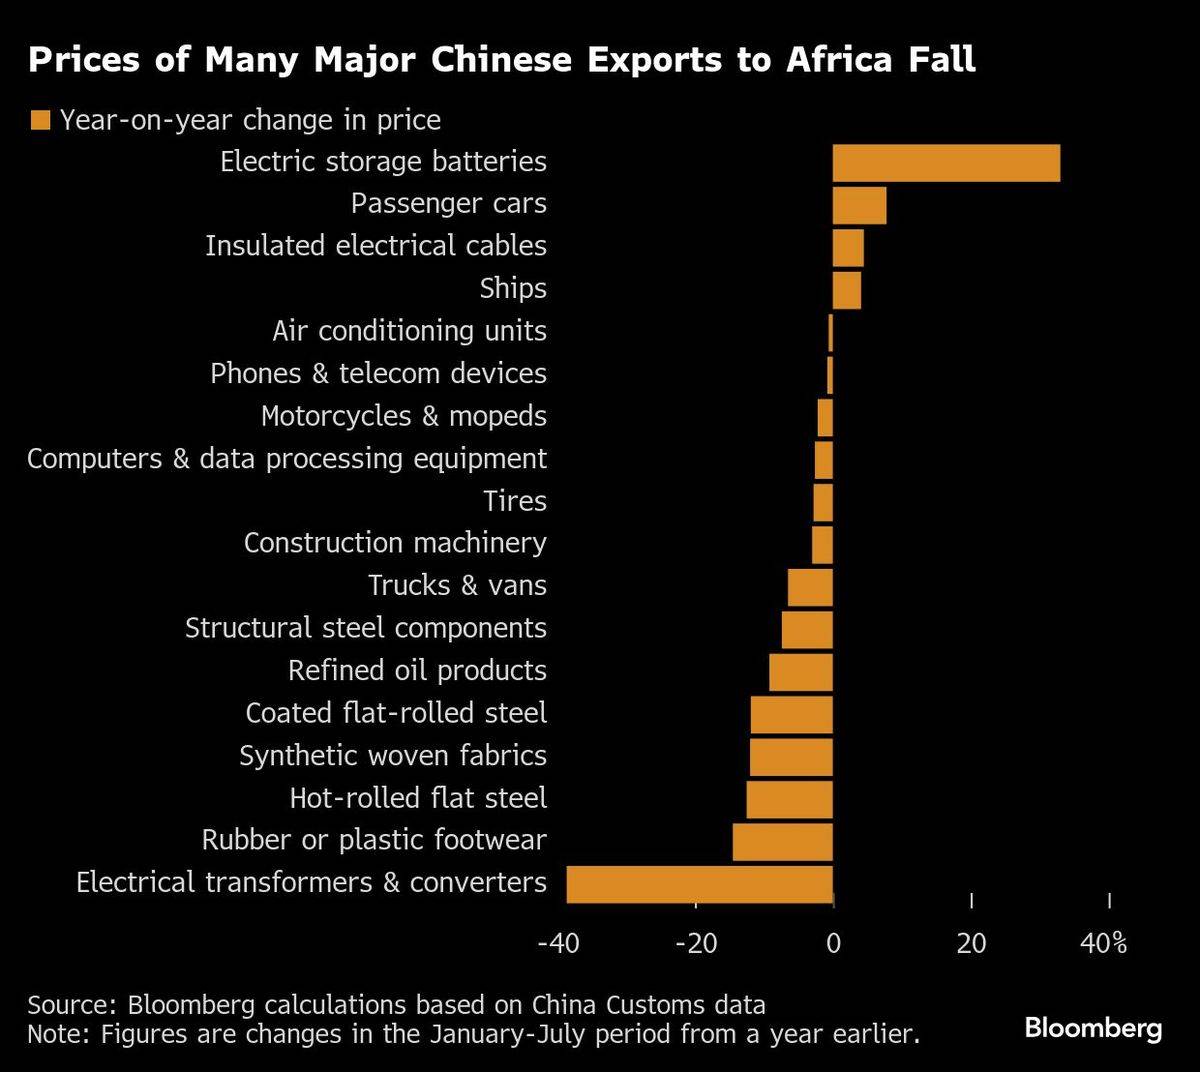
          Affordability is another factor working in China’s favour. Despite higher demand, prices for 14 out of the 18 major Chinese goods shipped to Africa actually fell on a yearly basis in the January-July period, with transformers and converters posting the deepest decline of 39%.

          China is also bringing financial muscle to the continent with the world’s fastest-growing population, often in the form of backing from state-owned banks. Only in recent months, China Development Bank released a €245 million (US$286 million or RM1.2 billion) first tranche of funding for a railway project in Nigeria and extended a loan for infrastructure construction in Egypt.

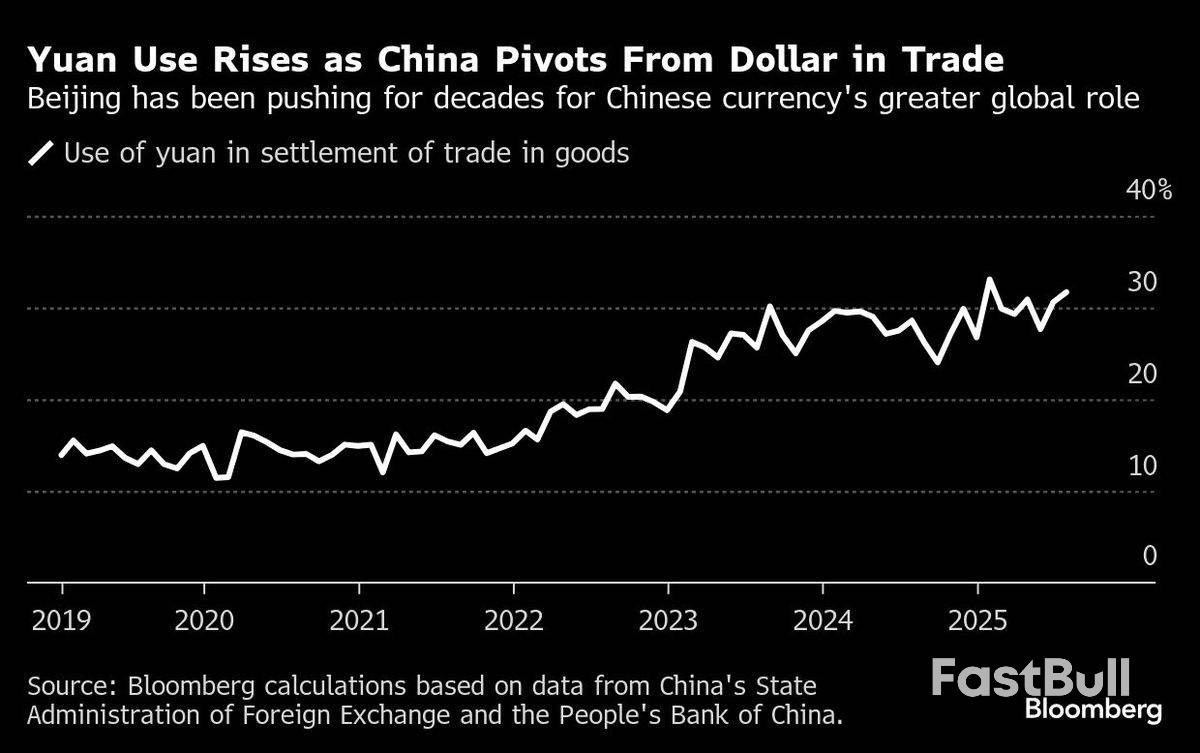
          Although most of the commodities imported from Africa to China are priced in dollars, the expanding trade footprint will probably help the yuan make inroads in corporate and government balance sheets.Nigeria, South Africa and Egypt are among the four countries on the continent that already have bilateral currency swaps with the central bank in Beijing — a list that includes Mauritius. Kenya has announced it’s in talks to convert some dollar-denominated loans to yuan to help ease the strain of debt.

          “China obviously benefits from greater use of its currency in the financial system – so that’s the incentive to offer preferential terms if they swap currency debt,” said David Omojomolo, Africa economist at Capital Economics. “I do expect heavily exposed countries to China in terms of debt like Angola will perhaps follow Kenya’s lead on this yuan swap if it’s pulled off.”

          Chinese goods barred or resisted elsewhere are meanwhile receiving little pushback in Africa. Exports of steel and iron components — used to build bridges, towers and scaffolding — climbed 43%.Sales of batteries spiked 41%, and transformers and converters, including inverters that adapt electricity from solar panels and wind systems to power home appliances and industrial equipment, soared nearly 25%.

          For now, China has yet to encounter the kind of backlash seen from countries around the world that fear the flood of cheaper goods. But it’s a risk in a region already worried about falling further into debt to China, especially if the exports begin to crowd out local producers.But Beijing will tread carefully since the continent is critical as a source of key commodities and a growth market for its companies. What’s more, it’s become a central arena for China’s aspirations on the world stage.

          “Africa is where China takes its firms and brands global — they get experience, create markets, and win brand recognition,” said Lauren Johnston, a China-Africa expert of New South Economics, a consultancy in Melbourne. “It is important for China’s global development leadership push.”

          Source: Theedgemarkets

          To stay updated on all economic events of today, please check out our Economic calendar
          Risk Warnings and Disclaimers
          You understand and acknowledge that there is a high degree of risk involved in trading. Following any strategies or investment methods may lead to potential losses. The content on the site is provided by our contributors and analysts for information purposes only. You are solely responsible for determining whether any trading assets, securities, strategy, or any other product is suitable for investing based on your own investment objectives and financial situation.
          Add to Favorites
          Share

          Why the stock market wasn't moved by Trump's boldest move yet on the Fed

          Adam

          Economic

          It's a curious thing that the most aggressive move yet to influence the world's most important central bank resulted not in a raucous reaction in the market but a whimper.
          Stocks on Tuesday barely budged. The 10-year (^TNX) meandered down a hair. And longer-dated US bond prices rose only slightly, even as concerns mounted that Trump's moves against the Federal Reserve's independence could stoke inflation and instability.
          The reaction was nothing like the post-"Liberation Day" sell-off. Back then, the bond market strong-armed the president into backing away from his most punishing tariff policies.
          But this time, as the president attempts to fire a Federal Reserve governor, Wall Street appears largely unbothered. What changed?
          Part of the answer has to do with timing. Right now, in the short term, the interests of the three main players — the Fed, the president, and the market — are all very much aligned.
          While Trump appears to be wielding allegations of mortgage fraud as a pretext to oust Lisa Cook, he's already publicly stated his policy aims for the Fed: He's demanding lower interest rates. That's what the bulk of investors want too. Fed Chair Powell signaled at Jackson Hole that he and his colleagues are ready to start cutting in as little as three weeks' time, which makes the practical considerations for getting rid of Cook more abstract.
          As economists Stephen Brown and Thomas Ryan from Capital Economics put it in a note on Tuesday, "It remains unclear whether Trump’s letter firing Cook, posted on social media [Monday], will have any practical effect on policy setting in the near term."
          A fact that "perhaps explains the muted market reaction," they added.
          But even when markets tolerate a legally dubious but aligned maneuver, what happens in the longer run should the Fed see itself remade as a political entity?
          "If the president were successful, the outcome would be momentous," Michael Feroli of JPMorgan wrote in a note on Tuesday. Feroli added that if Cook is eventually removed, other officials not sufficiently in line with the president's agenda could also face the ax.
          "This would add to upside inflation risks," Feroli said. And all else equal, higher inflation suggests higher interest rates, the opposite of what the White House is looking for.
          Trump's picks to fill new vacancies on the Fed board could also exert significant power.
          Joined by the two most recent rate cut dissenters, for instance, a Trump-aligned bloc of governors could attempt to remove any of the 12 Federal Reserve Bank presidents, remaking an independent institution into another part of the executive branch. That's an outcome that some market observers say is far-fetched. But so is attempting to throw out a Fed governor, and here we are.
          As Michael Farr, chief market strategist at Hightower Advisors, said Tuesday, "even the perception of the Federal Reserve being under the influence of the Treasury weakens credibility, which is probably the most important tool the Fed has to service the economy."
          If Powell is viewed as a nonpartisan leader worth listening to, perhaps another outcome of a politicized Fed is that central bank chairs will no longer have any real juice as influential policymakers. And future decisions on rate setting will always be colored by political expedience.
          The point of keeping rates higher for longer was to prevent the Fed from having to raise rates again, later on, in a more economically painful way. That's a source of disagreement and worth debating. And while it might be tempting to see the markets "agreeing" with Trump, it only looks that way.
          Higher stock prices in the near term are nice. But higher long-term interest rates, a big risk that a politicized Fed would invite, are certainly far from a desired outcome.

          Source: finance.yahoo

          To stay updated on all economic events of today, please check out our Economic calendar
          Risk Warnings and Disclaimers
          You understand and acknowledge that there is a high degree of risk involved in trading. Following any strategies or investment methods may lead to potential losses. The content on the site is provided by our contributors and analysts for information purposes only. You are solely responsible for determining whether any trading assets, securities, strategy, or any other product is suitable for investing based on your own investment objectives and financial situation.
          Add to Favorites
          Share

          What’s A ‘Secondary Tariff’ Like The One Trump Imposed On India?

          James Whitman

          Economic

          In his second term as US president, Donald Trump has used tariffs as a blanket solution to pursue a wide range of goals: increasing domestic manufacturing and foreign market access, boosting federal revenue, and even punishing the government of Brazil for prosecuting his political ally, former President Jair Bolsonaro. Now he’s deployed a tool he calls a “secondary tariff” in an effort to get countries to distance themselves from US adversaries.

          Such a tariff on imports from India took effect on Aug. 27. On top of a 25% levy on goods from India imposed earlier, Trump added an additional 25% tariff to penalize India for buying oil from Russia.

          The idea behind “secondary tariffs” is to use a weapon against one country to penalize or try to influence a different country. The concept is similar to the one behind so-called secondary sanctions.

          The US uses secondary sanctions to multiply the effect of its primary sanctions on countries or entities. Secondary sanctions target commercial activity involving a party under primary sanctions but occurring outside US legal jurisdiction. They are meant to force companies, banks and individuals to make a tough choice: continue doing business with the sanctioned entity or with the US, but not both.

          Unlike primary sanctions, which can be enforced by fines and the seizure of US-held assets, secondary sanctions rely on the centrality of the US financial system to the world economy and the widespread use of the dollar as the global reserve currency to work. A company or individual who violates a secondary sanction could be hit by US export controls or be placed on the Treasury Department’s Specially Designated Nationals and Blocked Persons List, which would prevent Americans from doing business with it.

          The “secondary tariff” Trump imposed on imports from India isn’t aimed at magnifying the impact of a primary tariff, as the name might suggest. US tariffs on energy from Russia are irrelevant given that such imports were banned in 2022 after the country’s full-scale invasion of Ukraine. Instead, the extra 25% tariff on imports from India appears to be aimed at compelling its government to adopt a similar ban, with the larger goal of pushing Russia to stop its war.

          In March, Trump created a mechanism for imposing tariffs on imports from countries that buy oil from Venezuela, whose regime, he said, poses a threat to US national security.

          Ships on the water have identifying transponders that allow third parties to track their location in real time via satellite. That enables analysts in and out of government to, for example, follow oil tankers loading in Russia and unloading in India.

          Source: Bloomberg

          To stay updated on all economic events of today, please check out our Economic calendar
          Risk Warnings and Disclaimers
          You understand and acknowledge that there is a high degree of risk involved in trading. Following any strategies or investment methods may lead to potential losses. The content on the site is provided by our contributors and analysts for information purposes only. You are solely responsible for determining whether any trading assets, securities, strategy, or any other product is suitable for investing based on your own investment objectives and financial situation.
          Add to Favorites
          Share

          Bitcoin and ether retreat as Fed rate cut optimism wanes

          Adam

          Cryptocurrency

          Risk assets stumble as rate cut certainty evaporates

          The cryptocurrency market has endured a sharp correction over the past two trading sessions as traders begin to question the certainty of aggressive Federal Reserve (Fed) rate cut optimism in September ahead of Friday's inflation data release. Bitcoin has retreated 4% falling below the psychologically important $110,000 level, while ether has suffered more pronounced losses of 8%.
          This shift reflects broader concerns about persistent inflation pressures that could force the Fed to maintain a more cautious approach.

          Whale activity and ETF flows signal bitcoin to ether rotation

          Despite the broader market turmoil, sophisticated investors are orchestrating a strategic pivot from bitcoin towards ether. This rotation includes high-profile whale transactions, most notably one bitcoin whale liquidating $2 billion worth of holdings to establish substantial ether positions. The migration reflects rising institutional interests in ether as corporates look to grow their crypto treasury.
          Exchange-traded fund (ETF) flows corroborate this institutional shift. Bitcoin spot ETFs recorded substantial net outflows totalling $1.2 billion between 15-22 August, though yesterday's $219 million inflow suggests bargain hunters emerged following the price decline.
          Ether's ETF story presents a markedly different narrative, with $151 million of net inflows since 15 August. This divergence reinforces whale observations, indicating professional investors are becoming increasingly discriminating in their cryptocurrency allocations.
          Options markets signal divided sentiment
          Derivatives markets offer additional insight into trader psychology, with Deribit options data exposing sharply divided opinions on bitcoin's near-term trajectory. Call options expiring 26 September with $140,000 strikes command similar open interest to $95,000 put options.
          This suggests genuine uncertainty rather than directional conviction, with the $45,000 spread between these levels highlighting expectations for continued extreme volatility. Options traders are clearly preparing for substantial moves in either direction.
          Ether's options landscape appears more constructive, with heavy call option clustering around $4,000 and $4,500 strikes and much lower put interests. The concentration of call interest at these levels may create technical support.
          Figure 1: Divided views on BTC for options expiring on 26 September

          Bitcoin and ether retreat as Fed rate cut optimism wanes_1IG as of 26 August 2025

          Figure 2: Elevated interest in ETH call options at $4000 & $4500 expiring on 26 September

          Bitcoin and ether retreat as Fed rate cut optimism wanes_2IG as of 26 August 2025

          Technical charts reveal bitcoin weakness, ether resilience

          Bitcoin's technical deterioration has accelerated, with the relative strength index (RSI) plunging below the neutral 50 level. This breakdown typically signals building bearish momentum and often precedes more substantial declines.
          The current price action fits Elliott Wave Theory's corrective Wave A pattern, suggesting this selloff may represent just the initial phase of a deeper pullback. The $110,000 psychological support level has provided temporary respite but looks increasingly vulnerable.
          Should this level fail, attention turns to the 38.2% Fibonacci retracement around $105,400, derived from the recent rally peak at $124,496. Any recovery attempts will likely encounter stiff resistance near $117,400, a level that acted as resistance last week.
          Figure 3: Bitcoin (daily) price chart

          Bitcoin and ether retreat as Fed rate cut optimism wanes_3as of 26 August 2025. Past performance is not a reliable indicator of future performance.

          While ether has declined alongside bitcoin, several technical indicators suggest underlying strength persists. The RSI remains above 50, indicating bullish momentum hasn't been extinguished, whilst ether continues trading above all major moving averages.
          The 20-day moving average near current levels represents the first line of defence. A successful hold here could signal the corrective phase has concluded, potentially enabling another assault on fresh record highs.
          However, failure to maintain this support would shift focus towards August's low around $4,060, where longer-term investors might emerge to provide more substantial buying interest. Any recovery attempts will need to clear previous resistance levels to confirm the uptrend remains intact.
          Figure 4: Ether (daily) price chart

          Bitcoin and ether retreat as Fed rate cut optimism wanes_4as of 26 August 2025. Past performance is not a reliable indicator of future performance.

          Key data releases threaten further crypto volatility

          Friday's core PCE release stands as this week's most significant market catalyst, with the potential to dramatically reshape cryptocurrency trajectories. Recent inflation readings have delivered unwelcome surprises, with core Consumer Price Index and Producer Price Index both exceeding forecasts. Producer prices recorded their sharpest monthly increase since March 2022 as businesses adjust pricing to accommodate higher tariff-related costs. This development raises genuine concerns that core PCE could breach the 0.3% monthly consensus estimate.
          Next week's employment data will add another layer of complexity to Fed policy deliberations. JOLTS job openings and non-farm payrolls could dramatically shift expectations for September's Federal Open Market Committee (FOMC) meeting.
          An above-consensus inflation reading combined with robust employment data may derail the Fed's rate cut decision on 17 September, causing risky assets to tumble further. Conversely, softer readings could rapidly restore appetite for equities and cryptocurrencies.

          Source: ig

          Risk Warnings and Disclaimers
          You understand and acknowledge that there is a high degree of risk involved in trading. Following any strategies or investment methods may lead to potential losses. The content on the site is provided by our contributors and analysts for information purposes only. You are solely responsible for determining whether any trading assets, securities, strategy, or any other product is suitable for investing based on your own investment objectives and financial situation.
          Add to Favorites
          Share

          Smart Money Loves Healthcare: But Are They Now Dumb?

          Adam

          Economic

          We have written a few commentaries over the last year describing how retail, not institutional, investors are driving markets higher. To wit, there is ample evidence that with each market dip, retail investors are not selling, instead buying unrelentingly.
          In May, we wrote the following: Typically, institutional investors are right; however, over the last few years, retail has proven to be the smarter money. However, it’s worth considering that if retail investors are still the “dumb money” and professionals the “smart money”, the graph below has significant implications.
          The scatter plot from Goldman Sachs shows the average sector weightings of large-cap mutual funds and hedge funds, i.e., institutional investors, versus how the sectors are weighted in the broad Russell 3000 index. As shown, the “smart money” is most enthusiastic about the healthcare and industrials sectors.
          Healthcare valuations are trading at 20-year lows versus the S&P 500, as investors have shunned some value sectors. Instead, the Magnificent Seven, high-growth technology, crypto-related companies, and power grid infrastructure stocks have garnered the most investment flows. Despite the popularity of technology stocks, both hedge funds and mutual funds are holding less than the market weights in the technology sector.
          More simply, retail is exceedingly enthusiastic about technology and not biting on cheap healthcare valuations. At the same time, as we show, professionals are shunning technology in favor of healthcare. Again, we must ask - Smart Money or Dumb Money: Who Will be Right
          Smart Money Loves Healthcare: But Are They Now Dumb?_1

          Home Prices Weaken Furthering Arguments For A Rate Cut

          The well-followed Case-Shiller 20-city house price index fell for the fourth month in a row. With the latest data, national home prices are up a mere 2.14% on a year-over-year basis. Interestingly, those cities that have been lagging in home price increases, like Chicago and New York, saw gains of 6% and 7%, year over year, respectively.
          Conversely, the "hot" markets like Tampa, Phoenix, Denver, and Dallas are all reporting negative price changes over the last year. As the second graph below shows, price declines are somewhat rare. The only two prior instances were before and during the 2008 Financial Crisis and shortly after the steep run during the pandemic.
          The data is very important for Fed policy for two reasons. First, home prices contribute to shelter prices, which account for about 40% of CPI. Given that CPI still shows shelter prices rising by about 4% annually, while rental prices are flat to falling and home prices are declining, this will exert negative pressure on CPI to counter tariffs.
          Second, housing-related activity contributes about 15% to GDP. Given that housing is weakening inflation and dampening the economy, the recent Case-Shiller home price data should provide further rationale for the Fed to cut rates.
          Smart Money Loves Healthcare: But Are They Now Dumb?_2Smart Money Loves Healthcare: But Are They Now Dumb?_3

          Source: investing

          To stay updated on all economic events of today, please check out our Economic calendar
          Risk Warnings and Disclaimers
          You understand and acknowledge that there is a high degree of risk involved in trading. Following any strategies or investment methods may lead to potential losses. The content on the site is provided by our contributors and analysts for information purposes only. You are solely responsible for determining whether any trading assets, securities, strategy, or any other product is suitable for investing based on your own investment objectives and financial situation.
          Add to Favorites
          Share
          FastBull
          Copyright © 2025 FastBull Ltd

          728 RM B 7/F GEE LOK IND BLDG NO 34 HUNG TO RD KWUN TONG KLN HONG KONG

          TelegramInstagramTwitterfacebooklinkedin
          App Store Google Play Google Play
          Products
          Charts

          Chats

          Q&A with Experts
          Screeners
          Economic Calendar
          Data
          Tools
          Membership
          Features
          Function
          Markets
          Copy Trading
          Latest Signals
          Contests
          News
          Analysis
          24/7
          Columns
          Education
          Company
          Careers
          About Us
          Contact Us
          Advertising
          Help Center
          Feedback
          User Agreement
          Privacy Policy
          Business

          White Label

          Data API

          Web Plug-ins

          Poster Maker

          Affiliate Program

          Risk Disclosure

          The risk of loss in trading financial instruments such as stocks, FX, commodities, futures, bonds, ETFs and crypto can be substantial. You may sustain a total loss of the funds that you deposit with your broker. Therefore, you should carefully consider whether such trading is suitable for you in light of your circumstances and financial resources.

          No decision to invest should be made without thoroughly conducting due diligence by yourself or consulting with your financial advisors. Our web content might not suit you since we don't know your financial conditions and investment needs. Our financial information might have latency or contain inaccuracy, so you should be fully responsible for any of your trading and investment decisions. The company will not be responsible for your capital loss.

          Without getting permission from the website, you are not allowed to copy the website's graphics, texts, or trademarks. Intellectual property rights in the content or data incorporated into this website belong to its providers and exchange merchants.

          Not Logged In

          Log in to access more features

          FastBull Membership

          Not yet

          Purchase

          Become a signal provider
          Help Center
          Customer Service
          Dark Mode
          Price Up/Down Colors

          Log In

          Sign Up

          Position
          Layout
          Fullscreen
          Default to Chart
          The chart page opens by default when you visit fastbull.com