


Markets
News
Analysis
User
24/7
Economic Calendar
Education
Data
- Names
- Latest
- Prev


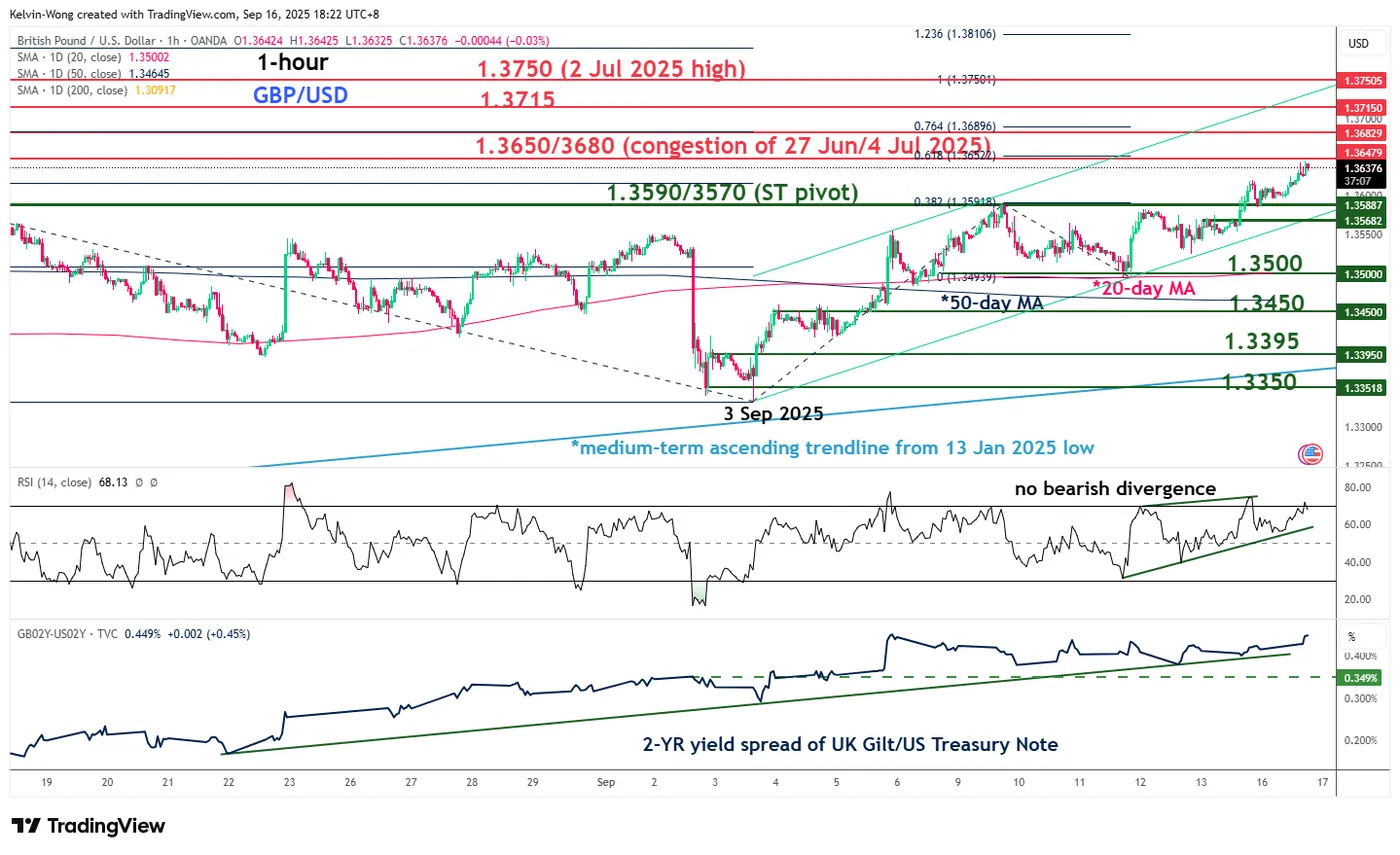
The price actions of the sterling have staged the expected recovery against the US dollar, as the GBP/USD has rallied by 1.2% and almost hit the lower limit of our highlighted resistance zone of 1.3650/1.3680 (printed an intraday high of 1.3645 on Tuesday, 16 September 2025, at the time of writing).
The price actions of the sterling have staged the expected recovery against the US dollar, as the GBP/USD has rallied by 1.2% and almost hit the lower limit of our highlighted resistance zone of 1.3650/1.3680 (printed an intraday high of 1.3645 on Tuesday, 16 September 2025, at the time of writing).
Today’s stellar performance of the GBP/USD (+0.3% has also been reinforced by better-than-expected July’s employment change data for the UK, which came in at 232,000, above the consensus of 222,000, while the unemployment rate remained steady for the third consecutive month at 4.7%, in line with expectations.
Let’s now update the short-term (1 to 3 days) trajectory and key technical elements of the GBP/USD ahead of tomorrow’s FOMC monetary policy decision outcome and the release of the latest Fed economic projections (dot plot).
Preferred trend bias (1-3 days)
A new minor bullish impulsive up move sequence is likely to have kicked off for the GBP/USD from its 3 September 2025 minor bullish reversal low of 1.3333 on the onset of the intraday spike up of the 30-year UK gilt yield over fiscal policy fears.
Maintain bullish bias above a tightened short-term pivotal support of 1.3590/1.3570 on the GBP/USD, with the next intermediate resistances to come in at 1.3715 and 1.3750 (also a Fibonacci extension).
Key elements
Alternative trend bias (1 to 3 days)
A break below 1.3570 key short-term support in GBP/USD will negate the bullish tone for a deeper minor corrective decline to expose the next intermediate supports at 1.3500 (also the 20-day moving average) and 1.3450 (also the 50-day moving average)
728 RM B 7/F GEE LOK IND BLDG NO 34 HUNG TO RD KWUN TONG KLN HONG KONG


The risk of loss in trading financial instruments such as stocks, FX, commodities, futures, bonds, ETFs and crypto can be substantial. You may sustain a total loss of the funds that you deposit with your broker. Therefore, you should carefully consider whether such trading is suitable for you in light of your circumstances and financial resources.
No decision to invest should be made without thoroughly conducting due diligence by yourself or consulting with your financial advisors. Our web content might not suit you since we don't know your financial conditions and investment needs. Our financial information might have latency or contain inaccuracy, so you should be fully responsible for any of your trading and investment decisions. The company will not be responsible for your capital loss.
Without getting permission from the website, you are not allowed to copy the website's graphics, texts, or trademarks. Intellectual property rights in the content or data incorporated into this website belong to its providers and exchange merchants.
Not Logged In
Log in to access more features

FastBull Membership
Not yet
Purchase


Log In
Sign Up


 Clear The $4.5K Skies?_1") ETH chart (Source: TradingView)
ETH chart (Source: TradingView)