• Trade
  • Markets
  • Copy
  • Contests
  • News
  • 24/7
  • Calendar
  • Q&A
  • Chats
Trending
Screeners
SYMBOL
LAST
BID
ASK
HIGH
LOW
NET CHG.
%CHG.
SPREAD
SPX
S&P 500 Index
6827.42
6827.42
6827.42
6899.86
6801.80
-73.58
-1.07%
--
DJI
Dow Jones Industrial Average
48458.04
48458.04
48458.04
48886.86
48334.10
-245.98
-0.51%
--
IXIC
NASDAQ Composite Index
23195.16
23195.16
23195.16
23554.89
23094.51
-398.69
-1.69%
--
USDX
US Dollar Index
97.950
98.030
97.950
98.500
97.950
-0.370
-0.38%
--
EURUSD
Euro / US Dollar
1.17394
1.17409
1.17394
1.17496
1.17192
+0.00011
+ 0.01%
--
GBPUSD
Pound Sterling / US Dollar
1.33707
1.33732
1.33707
1.33997
1.33419
-0.00148
-0.11%
--
XAUUSD
Gold / US Dollar
4299.39
4299.39
4299.39
4353.41
4257.10
+20.10
+ 0.47%
--
WTI
Light Sweet Crude Oil
57.233
57.485
57.233
58.011
56.969
-0.408
-0.71%
--

Community Accounts

Signal Accounts
--
Profit Accounts
--
Loss Accounts
--
View More

Become a signal provider

Sell trading signals to earn additional income

View More

Guide to Copy Trading

Get started with ease and confidence

View More

Signal Accounts for Members

All Signal Accounts

Best Return
  • Best Return
  • Best P/L
  • Best MDD
Past 1W
  • Past 1W
  • Past 1M
  • Past 1Y

All Contests

  • All
  • Trump Updates
  • Recommend
  • Stocks
  • Cryptocurrencies
  • Central Banks
  • Featured News
Top News Only
Share

USA Embassy In Lithuania: Maria Kalesnikava Is Not Going To Vilnius

Share

USA Embassy In Lithuania: Other Prisoners Are Being Sent From Belarus To Ukraine

Share

Ukraine President Zelenskiy: Five Ukrainians Released By Belarus In US-Brokered Deal

Share

USA Vilnius Embassy: USA Stands Ready For "Additional Engagement With Belarus That Advances USA Interests"

Share

USA Vilnius Embassy: Belarus, USA, Other Citizens Among The Prisoners Released Into Lithuania

Share

USA Vilnius Embassy: USA Will Continue Diplomatic Efforts To Free The Remaining Political Prisoners In Belarus

Share

USA Vilnius Embassy: Belarus Releases 123 Prisoners Following Meeting Of President Trump's Envoy Coale And Belarus President Lukashenko

Share

USA Vilnius Embassy: Masatoshi Nakanishi, Aliaksandr Syrytsa Are Among The Prisoners Released By Belarus

Share

USA Vilnius Embassy: Maria Kalesnikava And Viktor Babaryka Are Among The Prisoners Released By Belarus

Share

USA Vilnius Embassy: Nobel Peace Prize Laureate Ales Bialiatski Is Among The Prisoners Released By Belarus

Share

Belarusian Presidential Administration Telegram Channel: Lukashenko Has Pardoned 123 Prisoners As Part Of Deal With US

Share

Two Local Syrian Officials: Joint US-Syrian Military Patrol In Central Syria Came Under Fire From Unknown Assailants

Share

Israeli Military Says It Targeted 'Key Hamas Terrorist' In Gaza City

Share

Rwanda's Actions In Eastern Drc Are A Clear Violation Of Washington Accords Signed By President Trump - Secretary Of State Rubio

Share

Israeli Military Issues Evacuation Warning In Southern Lebanon Village Ahead Of Strike - Spokesperson On X

Share

Belarusian State Media Cites US Envoy Coale As Saying He Discussed Ukraine And Venezuela With Lukashenko

Share

Belarusian State Media Cites US Envoy Coale As Saying That US Removes Sanctions On Belarusian Potassium

Share

Thai Prime Minister: No Ceasefire Agreement With Cambodia

Share

US, Ukraine To Discuss Ceasefire In Berlin Ahead Of European Summit

Share

Incoming Czech Prime Minister Babis: Czech Republic Will Not Take On Guarantees For Ukraine Financing, European Commission Must Find Alternatives

TIME
ACT
FCST
PREV
U.K. Trade Balance Non-EU (SA) (Oct)

A:--

F: --

P: --

U.K. Trade Balance (Oct)

A:--

F: --

P: --

U.K. Services Index MoM

A:--

F: --

P: --

U.K. Construction Output MoM (SA) (Oct)

A:--

F: --

P: --

U.K. Industrial Output YoY (Oct)

A:--

F: --

P: --

U.K. Trade Balance (SA) (Oct)

A:--

F: --

P: --

U.K. Trade Balance EU (SA) (Oct)

A:--

F: --

P: --

U.K. Manufacturing Output YoY (Oct)

A:--

F: --

P: --

U.K. GDP MoM (Oct)

A:--

F: --

P: --

U.K. GDP YoY (SA) (Oct)

A:--

F: --

P: --

U.K. Industrial Output MoM (Oct)

A:--

F: --

P: --

U.K. Construction Output YoY (Oct)

A:--

F: --

P: --

France HICP Final MoM (Nov)

A:--

F: --

P: --

China, Mainland Outstanding Loans Growth YoY (Nov)

A:--

F: --

P: --

China, Mainland M2 Money Supply YoY (Nov)

A:--

F: --

P: --

China, Mainland M0 Money Supply YoY (Nov)

A:--

F: --

P: --

China, Mainland M1 Money Supply YoY (Nov)

A:--

F: --

P: --

India CPI YoY (Nov)

A:--

F: --

P: --

India Deposit Gowth YoY

A:--

F: --

P: --

Brazil Services Growth YoY (Oct)

A:--

F: --

P: --

Mexico Industrial Output YoY (Oct)

A:--

F: --

P: --

Russia Trade Balance (Oct)

A:--

F: --

P: --

Philadelphia Fed President Henry Paulson delivers a speech
Canada Building Permits MoM (SA) (Oct)

A:--

F: --

P: --

Canada Wholesale Sales YoY (Oct)

A:--

F: --

P: --

Canada Wholesale Inventory MoM (Oct)

A:--

F: --

P: --

Canada Wholesale Inventory YoY (Oct)

A:--

F: --

P: --

Canada Wholesale Sales MoM (SA) (Oct)

A:--

F: --

P: --

Germany Current Account (Not SA) (Oct)

A:--

F: --

P: --

U.S. Weekly Total Rig Count

A:--

F: --

P: --

U.S. Weekly Total Oil Rig Count

A:--

F: --

P: --

Japan Tankan Large Non-Manufacturing Diffusion Index (Q4)

--

F: --

P: --

Japan Tankan Small Manufacturing Outlook Index (Q4)

--

F: --

P: --

Japan Tankan Large Non-Manufacturing Outlook Index (Q4)

--

F: --

P: --

Japan Tankan Large Manufacturing Outlook Index (Q4)

--

F: --

P: --

Japan Tankan Small Manufacturing Diffusion Index (Q4)

--

F: --

P: --

Japan Tankan Large Manufacturing Diffusion Index (Q4)

--

F: --

P: --

Japan Tankan Large-Enterprise Capital Expenditure YoY (Q4)

--

F: --

P: --

U.K. Rightmove House Price Index YoY (Dec)

--

F: --

P: --

China, Mainland Industrial Output YoY (YTD) (Nov)

--

F: --

P: --

China, Mainland Urban Area Unemployment Rate (Nov)

--

F: --

P: --

Saudi Arabia CPI YoY (Nov)

--

F: --

P: --

Euro Zone Industrial Output YoY (Oct)

--

F: --

P: --

Euro Zone Industrial Output MoM (Oct)

--

F: --

P: --

Canada Existing Home Sales MoM (Nov)

--

F: --

P: --

Euro Zone Total Reserve Assets (Nov)

--

F: --

P: --

U.K. Inflation Rate Expectations

--

F: --

P: --

Canada National Economic Confidence Index

--

F: --

P: --

Canada New Housing Starts (Nov)

--

F: --

P: --

U.S. NY Fed Manufacturing Employment Index (Dec)

--

F: --

P: --

U.S. NY Fed Manufacturing Index (Dec)

--

F: --

P: --

Canada Core CPI YoY (Nov)

--

F: --

P: --

Canada Manufacturing Unfilled Orders MoM (Oct)

--

F: --

P: --

Canada Manufacturing New Orders MoM (Oct)

--

F: --

P: --

Canada Core CPI MoM (Nov)

--

F: --

P: --

Canada Manufacturing Inventory MoM (Oct)

--

F: --

P: --

Canada CPI YoY (Nov)

--

F: --

P: --

Canada CPI MoM (Nov)

--

F: --

P: --

Canada CPI YoY (SA) (Nov)

--

F: --

P: --

Canada Core CPI MoM (SA) (Nov)

--

F: --

P: --

Q&A with Experts
    • All
    • Chatrooms
    • Groups
    • Friends
    Connecting
    .
    .
    .
    Type here...
    Add Symbol or Code

      No matching data

      All
      Trump Updates
      Recommend
      Stocks
      Cryptocurrencies
      Central Banks
      Featured News
      • All
      • Russia-Ukraine Conflict
      • Middle East Flashpoint
      • All
      • Russia-Ukraine Conflict
      • Middle East Flashpoint
      Search
      Products

      Charts Free Forever

      Chats Q&A with Experts
      Screeners Economic Calendar Data Tools
      Membership Features
      Data Warehouse Market Trends Institutional Data Policy Rates Macro

      Market Trends

      Market Sentiment Order Book Forex Correlations

      Top Indicators

      Charts Free Forever
      Markets

      News

      News Analysis 24/7 Columns Education
      From Institutions From Analysts
      Topics Columnists

      Latest Views

      Latest Views

      Trending Topics

      Top Columnists

      Latest Update

      Signals

      Copy Rankings Latest Signals Become a signal provider AI Rating
      Contests
      Brokers

      Overview Brokers Assessment Rankings Regulators News Claims
      Broker listing Forex Brokers Comparison Tool Live Spread Comparison Scam
      Q&A Complaint Scam Alert Videos Tips to Detect Scam
      More

      Business
      Events
      Careers About Us Advertising Help Center

      White Label

      Data API

      Web Plug-ins

      Affiliate Program

      Awards Institution Evaluation IB Seminar Salon Event Exhibition
      Vietnam Thailand Singapore Dubai
      Fans Party Investment Sharing Session
      FastBull Summit BrokersView Expo
      Recent Searches
        Top Searches
          Markets
          News
          Analysis
          User
          24/7
          Economic Calendar
          Education
          Data
          • Names
          • Latest
          • Prev

          View All

          No data

          Scan to Download

          Faster Charts, Chat Faster!

          Download App
          English
          • English
          • Español
          • العربية
          • Bahasa Indonesia
          • Bahasa Melayu
          • Tiếng Việt
          • ภาษาไทย
          • Français
          • Italiano
          • Türkçe
          • Русский язык
          • 简中
          • 繁中
          Open Account
          Search
          Products
          Charts Free Forever
          Markets
          News
          Signals

          Copy Rankings Latest Signals Become a signal provider AI Rating
          Contests
          Brokers

          Overview Brokers Assessment Rankings Regulators News Claims
          Broker listing Forex Brokers Comparison Tool Live Spread Comparison Scam
          Q&A Complaint Scam Alert Videos Tips to Detect Scam
          More

          Business
          Events
          Careers About Us Advertising Help Center

          White Label

          Data API

          Web Plug-ins

          Affiliate Program

          Awards Institution Evaluation IB Seminar Salon Event Exhibition
          Vietnam Thailand Singapore Dubai
          Fans Party Investment Sharing Session
          FastBull Summit BrokersView Expo

          Fed Seen Cutting Policy Rate By A Full Percentage Point This Year

          Grace Montgomery

          Central Bank

          Summary:

          Federal Reserve policymakers won't take much signal from a decline in first-quarter U.S. GDP, but by June clearer signs of a faltering economy will move central bankers to resume cutting interest rates, ultimately by a full percentage point by the end of the year, traders bet on Wednesday.

          Federal Reserve policymakers won't take much signal from a decline in first-quarter U.S. GDP, but by June clearer signs of a faltering economy will move central bankers to resume cutting interest rates, ultimately by a full percentage point by the end of the year, traders bet on Wednesday.
          The U.S. economy contracted by an annualized 0.3% last quarter, the Commerce Department's Bureau of Economic Analysis said on Wednesday, as American businesses rushed to buy imported goods ahead of President Donald Trump's barrage of tariffs. Consumer spending downshifted to a 1.8% pace from a 4% pace last quarter.The report contained "clear signs that the economy already was fundamentally slowing" last quarter, economists at Pantheon Macro wrote. "A period of stagnation now likely lies ahead if the current set of tariffs is maintained, with recession the most likely outcome if the additional reciprocal tariffs are imposed in full in July.
          Futures contracts that settle to the Fed's policy rate continued to point to a start to Fed rate cuts in June, with a total of four quarter-point reductions likely, bringing the rate to the 3.25%-3.5% range by year-end.
          Fed policymakers meet next week and are nearly universally expected to keep rates in their current 4.25%-4.5% range. Central bankers say they expect the tariffs to boost prices and slow the labor market, a difficult mix because the Fed can't fight both problems at the same time.

          Source: Kitco

          Risk Warnings and Disclaimers
          You understand and acknowledge that there is a high degree of risk involved in trading. Following any strategies or investment methods may lead to potential losses. The content on the site is provided by our contributors and analysts for information purposes only. You are solely responsible for determining whether any trading assets, securities, strategy, or any other product is suitable for investing based on your own investment objectives and financial situation.
          Add to Favorites
          Share

          Pound-to-Dollar Down as Investors Focus on the Positives in a Dire GDP Release

          Warren Takunda

          Economic

          The Dollar strengthened and stock markets fell through the midweek session as investors chewed over a soft U.S. GDP report that showed the economy shrank in the first quarter (-0.2% q/q).
          This was the first decline in three years, which disappointed a market that expected a flat reading to follow Q4 2024's 0.4% q/q reading.
          "Stagflation concerns were bolstered by Wednesday's data showing an unexpected contraction in U.S. GDP during the first quarter along with a surprisingly large jump in core PCE prices," says Paul Spirgel, a Reuters market analyst.
          Disappointment was painted on the S&P 500 stock index, which is trading lower on the day alongside other major U.S. bourses.
          In 2025, the Dollar and U.S. stocks have tended to fall together, which means the USD advance is a surprise and raises questions as to whether the Dollar is regaining its safe-haven status.
          It is too soon to suggest this is the case because it is the final day of the month, and month- and quarter-end flows are likely distorting the market. Investment bank analysts have suggested that USD strength should be expected.
          Dollar strength also suggests the U.S. GDP data was not as bad as the headline decline suggests, given there were some significant distortions caused by importers front-running Trump's tariffs.
          According to economist Atakan Bakiskan at Berenberg Bank, "the main drag on growth came from a sharp widening in the trade deficit, as businesses frontloaded imports to stay ahead of tariffs."
          He says consumption softened only modestly and households increased spending by 1.8% q/q (annualised) after 2.8% growth in 2024, with a stronger tilt towards services, which rose 2.4%, while goods consumption increased by only 0.5%.
          In fact, when adjusted for imports and inventories, which do not reflect underlying economic strength due to the frontloading effect, real GDP in the US rose around 2.3% q/q.
          "Despite mounting downside pressures on growth, the US economy remains solid for now," says Bakiskan.
          The Dollar's advance saw the Pound to Dollar exchange rate retreat further from three year highs at 1.3444. When that high was reached on Tuesday we warned about a strong horizontal resistance level that could deal Sterling a setback.
          This layer of resistance has shown its teeth and Pound-Dollar's retreat extends back to 1.3310 at the time of writing.
          For now, strategists maintain a 'buy the dip' mentality.Pound-to-Dollar Down as Investors Focus on the Positives in a Dire GDP Release_1

          Above: GBPUSD at daily intervals.

          "Sterling fell on Wednesday, retreating further from its April 28 high of 1.3445, but a reversion to gains remains possible for GBP/USD as the dollar selloff tied to tariff concerns appears largely intact — albeit paused — as markets await clarity on U.S. trade policy," says Paul Spirgel, a Reuters market analyst.
          He explains that with tariff risk still elevated, further dollar weakness seems likely. "The recent dollar bounce may be temporary position adjustment as markets await further developments."
          The British Pound has risen 3.20% against the Dollar in April, adding to March's 2.70% gain, boosted by a significant repraisal in the U.S. economy's growth prospects under a punitive tariff regime.
          Policy uncertainty and President Donald Trump's disruptive reordering of the global political order have prompted international investors to reduce exposure to U.S. assets, including the Dollar.
          "There has been a sharp stop of foreign investor inflow into U.S. bond and equity markets over the last two months. Our broad takeaway is that the flow evidence so far points to an, at best, very rapid slowing in US capital inflows and, at worst, continued active disinvestment from US assets. Either interpretation poses a challenge to the USD as a twin deficit currency," says George Saravelos, Global Head of FX Research at Deutsche Bank.
          He warns that a buyers strike of U.S. assets is set to harm the Dollar further. "What matters for the USD is what foreign investors are doing and, so far, based on his analysis the evidence is that they remain on a buyers' strike on US assets."

          Source: Poundsterlinglive

          To stay updated on all economic events of today, please check out our Economic calendar
          Risk Warnings and Disclaimers
          You understand and acknowledge that there is a high degree of risk involved in trading. Following any strategies or investment methods may lead to potential losses. The content on the site is provided by our contributors and analysts for information purposes only. You are solely responsible for determining whether any trading assets, securities, strategy, or any other product is suitable for investing based on your own investment objectives and financial situation.
          Add to Favorites
          Share

          Wall Street Slides After Economy Contracts In First Quarter

          Damon

          Economic

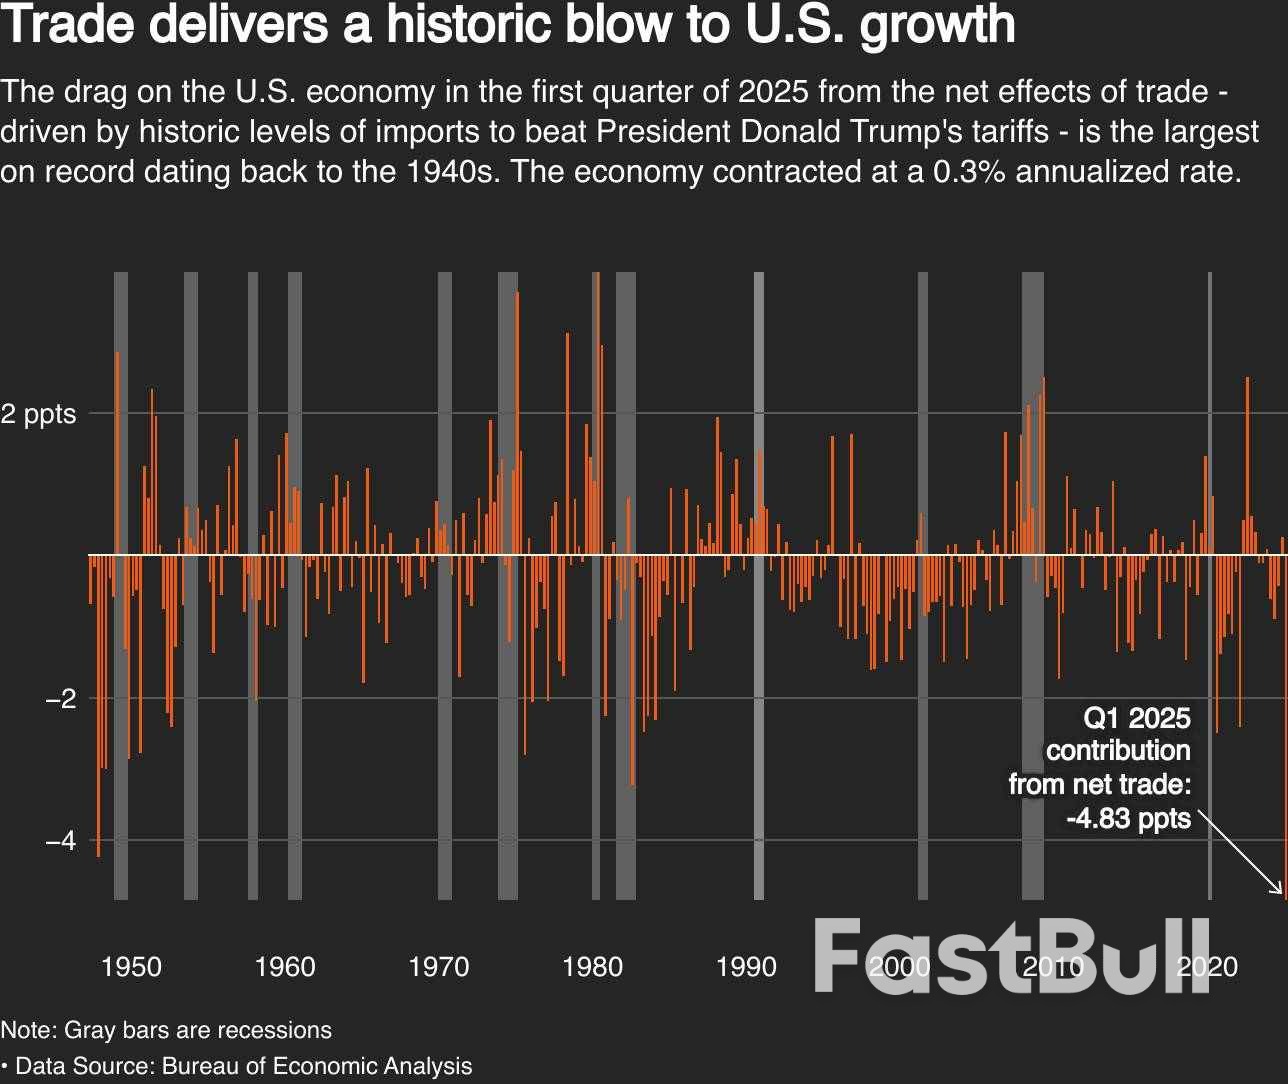
          Wall Street's main indexes dropped on Wednesday after data showed the economy contracted for the first time in three years in the first quarter, deepening concerns around the impact of U.S. tariffs and the global trade war.

          Private payrolls growth also slowed more than expected in April, while the personal consumption expenditure index - the Federal Reserve's preferred inflation gauge - rose slightly more than expected in March on an annual basis.

          Wednesday's reports join a series of data releases over the month that have pointed to an increasingly uncertain outlook for the U.S. economy, as the fallout from the Trump administration's steep tariffs and erratic trade policy take effect.

          "Given the amount of damage that's been done to businesses (and) consumer confidence, we could just be getting started on seeing a continuation of these weaker numbers," said John Luke Tyner, portfolio manager at Aptus Capital Advisors.

          U.S. consumer spending jumped last month as households rushed to buy motor vehicles to avoid higher prices and shortages due to tariffs.

          Shows trade effect on GDP

          Traders are now pricing in a full percentage point interest rate cut by the end of the year from the Fed.

          Caterpillar (CAT.N), opens new tab declined marginally, after gaining premarket following its quarterly results.

          At 10:03 a.m. ET, the Dow Jones Industrial Average (.DJI), opens new tab fell 699.90 points, or 1.73%, to 39,827.72, the S&P 500 (.SPX), opens new tab lost 113.47 points, or 2.04%, to 5,447.36 and the Nasdaq Composite (.IXIC), opens new tab lost 449.75 points, or 2.58%, to 17,011.57.

          All S&P 500 sectors were in the red, with consumer discretionary (.SPLRCD), opens new tab and information technology (.SPLRCT), opens new tab shares down 3.6% and 2.3%, respectively.

          The CBOE Volatility index (.VIX), opens new tab, seen as Wall Street's fear gauge, was up 3.53 points at 27.69, its highest in nearly a week.

          "Magnificent Seven" members Meta Platforms (META.O), opens new tab and Microsoft (MSFT.O), opens new tab fell 2% and 3% ahead of their results, due after markets close, that investors are watching closely for clarity on the outlook for the tech sector and AI-focused investments.

          Fanning concerns about a pullback in investments into AI, Super Micro Computer (SMCI.O), opens new tab cut its third-quarter forecasts due to delays in customer spending, while Snapchat parent Snap (SNAP.N), opens new tab said it would not provide a second-quarter financial forecast.

          Their shares fell more than 16% each.

          Wall Street's indexes recouped some ground this month after a sharp slump following the April 2 "Liberation Day" tariff announcements, but are set for monthly declines.

          The S&P 500 is set to snap its best winning streak since November if losses hold through close.

          Wednesday also marks 100 days since Trump took office. Erratic changes in trade policies and uncertainty have roiled markets over that period, offsetting initial optimism over the administration's business-friendly policies.

          "If you were looking for a playbook on how to slow a healthy economy, (policy changes) seem like a good example," said Scott Helfstein, head of investment strategy at Global X.

          Among other stocks, Norwegian Cruise Line Holdings (NCLH.N), opens new tab tumbled 10% after missing first-quarter earnings estimates.

          Declining issues outnumbered advancers by a 7.61-to-1 ratio on the NYSE and by a 4.77-to-1 ratio on the Nasdaq.

          The S&P 500 posted 2 new 52-week highs and 3 new lows while the Nasdaq Composite recorded 14 new highs and 57 new lows.

          Reporting by Lisa Mattackal and Purvi Agarwal in Bengaluru; Editing by Devika Syamnath

          Source: Reuters

          To stay updated on all economic events of today, please check out our Economic calendar
          Risk Warnings and Disclaimers
          You understand and acknowledge that there is a high degree of risk involved in trading. Following any strategies or investment methods may lead to potential losses. The content on the site is provided by our contributors and analysts for information purposes only. You are solely responsible for determining whether any trading assets, securities, strategy, or any other product is suitable for investing based on your own investment objectives and financial situation.
          Add to Favorites
          Share

          U.S. Economy Shrinks 0.3% in First Quarter as Trump Trade Wars Disrupt Businesses

          Warren Takunda

          Economic

          China–U.S. Trade War

          The U.S. economy shrank at a 0.3% annual pace from January through March, the first drop in three years, as President Donald Trump’s trade wars disrupted business. First-quarter growth was slowed by a surge in imports as companies in the United States tried to bring in foreign goods before Trump imposed massive tariffs.
          The January-March drop in gross domestic product — the nation’s output of goods and services — reversed a 2.4% gain in the last three months of 2024. Imports grew at a 41% pace, fastest since 2020, and shaved 5 percentage points off first-quarter growth. Consumer spending also slowed sharply — to 1.8% growth from 4% in October-December last year. Federal government spending plunged 5.1% in the first quarter.
          Forecasters surveyed by the data firm FactSet had, on average, expected the economy to eke out 0.8% growth in the first quarter, but many expected GDP to fall.
          Financial markets sank on the report. The Dow Jones tumbled 400 points at the opening bell shortly after the GDP numbers were released. The S&P 500 dropped 1.5% and the Nasdaq composite fell 2%.
          The surge in imports — fastest since 1972 outside COVID-19 economic disruptions — is likely to reverse in the second quarter, removing a weight on GDP. For that reason, Paul Ashworth of Capital Economics forecasts that April-June growth will rebound to a 2% gain.
          Trade deficits reduce GDP. But that’s mainly a matter of mathematics. GDP is supposed to count only what’s produced domestically. So imports — which the government counts as consumer spending in the GDP report when you buy, say, Swiss chocolates — have to be subtracted out to keep them from artificially inflating domestic production.
          And other aspects of Wednesday’s GDP report suggested that the economy looked solid at the start of the year.
          A category within the GDP data that measures the economy’s underlying strength rose at a healthy 3% annual rate from January through March, up from 2.9% in the fourth quarter of 2024. This category includes consumer spending and private investment but excludes volatile items like exports, inventories and government spending.
          Still, many economists say that Trump’s massive import taxes — the erratic way he’s rolled them out — will hurt growth in the second half of the year and that recession risks are rising.
          “We think the downturn of the economy will get worse in the second half of this year,’' wrote Carl Weinberg, chief economist at High Frequency Economics. “Corrosive uncertainty and higher taxes — tariffs are a tax on imports — will drag GDP growth back into the red by the end of this year.’'
          Wednesday’s report also showed an increase in prices that is likely to worry the Federal Reserve which is still trying to cool inflation after a severe pandemic run-up. The Fed’s favored inflation gauge – the personal consumption expenditures, or PCE, price index – rose at an annual rate of 3.6%, up from 2.4% in the fourth quarter. Excluding volatile food and energy prices, so-called core PC inflation registered 3.5%, compared with 2.6% from October-December. The central bank wants to see inflation at 2%.
          The first-quarter GDP numbers “highlight the bind that the Federal Reserve is in,” Ryan Sweet of Oxford Economics wrote in a commentary. The Fed must weigh whether to cut interest rates to support economic growth or leave rates high because of elevated inflation. “The economy was essentially stagnant in the first three months of the year while growth in headline and core inflation accelerated, fanning concerns of stagflation.’’
          Trump inherited a solid economy that had grown steadily despite high interest rates imposed by the Fed in 2022 and 2023 to fight inflation. His erratic trade policies — including 145% tariffs on China — have paralyzed businesses and threatened to raise prices and hurt consumers.
          Democrats were quick to blame Trump for disrupting several years of solid economic growth. Democratic Sen. Elizabeth Warren of Massachusetts said: “100 days into his presidency, Donald Trump’s red-light, green-light tariffs are shrinking our economy, with businesses stockpiling imports in anticipation of tariff doomsday.″
          There is potential evidence emerging that the solid job market, a pillar of the U.S. economy during the pandemic recession, may be weakening.
          On Wednesday, payroll provider ADP reported that companies added just 62,000 jobs in April, about half of what was expected, and down from 147,000 in March. That could be a signal that businesses may be taking a more cautious approach to hiring amid uncertainty over tariffs. Still, the ADP figures often diverge from the government’s jobs reports, which arrive Friday.
          Employers in the education and health, information technology, and business and professional services industries all cut jobs. Business and professional services include sectors such as engineering, accounting and advertising.
          “Unease is the word of the day,” said Nela Richardson, chief economist at ADP. “It can be difficult to make hiring decisions in such an environment.”

          Source: AP

          To stay updated on all economic events of today, please check out our Economic calendar
          Risk Warnings and Disclaimers
          You understand and acknowledge that there is a high degree of risk involved in trading. Following any strategies or investment methods may lead to potential losses. The content on the site is provided by our contributors and analysts for information purposes only. You are solely responsible for determining whether any trading assets, securities, strategy, or any other product is suitable for investing based on your own investment objectives and financial situation.
          Add to Favorites
          Share

          The stock market’s worst first 100 days of any presidential term in more than 50 years

          Adam

          Stocks

          The US stock market just recorded its worst first 100 days of any presidential term since President Gerald Ford assumed office in 1974.
          The stock market initially surged higher after President Donald Trump’s reelection in November on expectations for a pro-business boom. Yet 100 days into Trump’s second term, Wall Street has been shaken by historic levels of uncertainty and volatility because of tariffs.
          “Given the ongoing uncertainty around US trade policy and the economic outlook more broadly, we suspect the going will get tougher from here,” said Jonas Goltermann, deputy chief markets economist at Capital Economics, in a Monday note.
          The stock market has rallied in recent days, with the S&P 500 and Dow posting a six-day winning streak. The Dow on Tuesday closed higher by 300 points or 0.75%. The broader S&P 500 gained 0.58% and the tech-heavy Nasdaq Composite gained 0.55%.
          However, the S&P 500 is still down 7.27% since Trump’s inauguration on January 20. The benchmark index has shed $3.66 trillion in market value since Trump was inaugurated, according to Howard Silverblatt, senior index analyst at S&P Dow Jones Indices.
          Markets extended their gains Tuesday afternoon as Commerce Secretary Howard Lutnick said on CNBC he had a trade deal done, though he declined to name the country.
          The S&P 500’s performance so far during Trump’s second term has been the third-worst performance during the first 100 days of any presidential term in US history, following only President Richard Nixon and Ford.
          “Policy is overshadowing key fundamentals,” said Terry Sandven, chief equity strategist at US Bank Wealth Management Group. “We could still have some weakness in front of us, but at a minimum, we’ve got volatility until visibility around tariffs starts to improve.”

          A whipsawing ride for the stock market

          The stock market has been on a rollercoaster this year, whipsawing at the whims of Trump’s back-and-forth decisions on tariff policy.
          The S&P 500 hit a record high in February before sliding into correction in March as Trump began to roll out his plan for tariffs. The S&P 500 plummeted in early April after Trump unveiled his so-called “Liberation Day” tariffs, hitting its lowest point of the year on April 8, when it was on the cusp of entering a bear market.
          The market has regained some ground since but the S&P 500 is still down 1.94% from where it was before Trump unveiled his “reciprocal” tariffs on April 2.
          “I don’t remember a time when a policy was so directly aimed at economic outcomes, where it was received so negatively, universally by the investment community,” said Kelly Bouchillon, senior partner at Sound View Wealth Advisors. “It’s the most uncertainty I think we’ve seen around corporate earnings and growth in sometime, all self-inflicted by the administration.”
          The Magnificent Seven tech stocks, which boosted the market to record highs in 2024, have broadly slumped this year. Apple (AAPL) is down 15.66% this year. Nvidia (NVDA) is down 18.8%. Tesla (TSLA) is down 27.7%.
          Amazon (AMZN) has tumbled 14.6% this year. The e-commerce giant briefly dropped on Tuesday after a report from Punchbowl News that the e-commerce giant would begin listing how much of an item’s price represents the added cost of tariffs. White House press secretary Karoline Leavitt called the move a “hostile and political act.”
          An Amazon spokesperson said in a statement to CNN that the move “was never a consideration for the main Amazon site and nothing has been implemented on any Amazon properties.”
          Trump called Amazon founder Jeff Bezos to complain, two senior White House officials told CNN. Trump later said it was a “good call.”
          “Jeff Bezos was very nice. He was terrific,” Trump told reporters on Tuesday. “He solved the problem very quickly. Good guy.”
          The best performers in the market this year have been have been tobacco and gold, according to CFRA Research. Newmont Corporation (NEM), a gold mining company, is up 42.3% this year. Phillip Morris (PM), the tobacco giant, is up 41.47%.
          Meanwhile, AI and tech company Palantir (PLTR) has soared 53.48% this year, making it the best-performing stock in the S&P 500 after gaining about 340% in 2024.
          The Nasdaq, which entered a bear market on April 4, is down 11% since Trump’s inauguration. The Dow is down 6.8% since Trump’s inauguration.

          US government bonds

          While stocks have been volatile, US Treasuries have emerged as a notable loser in Trump’s first 100 days in office.
          Typically, when investors sell off stocks in times of uncertainty, they park their cash in US Treasuries, seeking the safety of an asset backed by the full faith and credit of the US government.
          Yet as stocks declined around the world in early April, investors abruptly sold off US Treasuries, raising questions about how much they value US government bonds as a haven.
          The yield on the 10-year Treasury note has come down to 4.176% since spiking in early April, but the recent volatility has unnerved investors.
          “The prospect of foreign investors reducing exposure to US assets amid concerns about the continued predominance of US Treasuries as a safe haven has been at the center of market debate over the last few weeks,” said Vishwanath Tirupattur, a strategist at Morgan Stanley, in a Monday note.

          The US dollar

          A decline in the dollar this year has sparked debates on Wall Street about the stability and preeminence of US financial markets.
          The US dollar index, which measures the dollar’s strength against six foreign currencies, has tumbled more than 8% this year. The dollar index on April 21 hit its lowest level in three years.
          After Trump’s election in November, the dollar pushed higher on expectations for economic growth. The swift decline in the dollar has raised questions about investors’ confidence in the United States. The Euro has gained more than 9% against the dollar this year.
          “That trend of a weaker currency and money flowing into non-US assets does stand out to me as being maybe something that’s going to be a little bit more persistent going forward,” said Joe Zappia, co-chief investment officer at LVW Advisors.

          International stocks

          Some winners across Trump’s first 100 days have been stocks overseas, which have been buoyed by investors reconsidering their allocations to US assets.
          US markets this year have underperformed markets in Europe, South America and Asia, and the theme of selling American assets has recently captivated some global investors and analysts on Wall Street.
          Bank of America’s latest global fund manager survey showed the largest number of global investors on record intending to decrease holdings of US stocks.
          Germany’s DAX index is up 12.6% this year. Hong Kong’s Hang Seng index is up 9.7% this year.
          The Trump administration’s trade policy has raised concerns about US economic growth and caused global investors to rethink their exposure to the US, Arun Sai, senior multi-asset strategist at Pictet Asset Management, told CNN.
          “If you’re a European investor, you will now think twice about allocating strategically to the US,” Sai said. “The S&P 500 is no longer the only game in town.”

          Wall Street’s fear gauge

          Trump’s trade policy has injected historic levels of volatility into the stock market.
          The CBOE Volatility Index, Wall Street’s fear gauge, spiked sharply this year, hitting levels not seen since the onset of the Covid-19 pandemic.
          The VIX closed at 52 points on April 8. The VIX has only closed above 50 twice before this month: in March 2020 and during the 2008 financial crisis.
          The VIX has declined in recent weeks but is still trading above 20 points, the level associated with heightened volatility.

          Gold

          Gold has emerged as the champion of Trump’s first 100 days.
          The yellow metal has soared about 26% this year, smashing through record highs and briefly surpassing $3,500 a troy ounce.
          Investors have flocked to gold as a safe haven given the uncertain outlook of Trump’s tariffs and the US-China trade war. Bullion is historically a haven during times of economic and geopolitical uncertainty.
          The most crowded trade in April was gold, according to the Bank of America survey, breaking a two-year streak for the Magnificent Seven tech stocks.

          source : cnn

          Risk Warnings and Disclaimers
          You understand and acknowledge that there is a high degree of risk involved in trading. Following any strategies or investment methods may lead to potential losses. The content on the site is provided by our contributors and analysts for information purposes only. You are solely responsible for determining whether any trading assets, securities, strategy, or any other product is suitable for investing based on your own investment objectives and financial situation.
          Add to Favorites
          Share

          Bitcoin Macro Indicator That Predicted 2022 Bottom Flashes 'Buy Signal'

          Warren Takunda

          Cryptocurrency

          Key takeaways:
          Macro Chain Index issues first buy signal since 2022, hinting at a new Bitcoin bull run.
          RSI crossover on the MCI aligns with past cycle bottoms that preceded 500%+ BTC rallies.
          Bitcoin price recovers from $74K to $95K amid rising open interest and positive funding rates.
          A key Bitcoin indicator that accurately signaled the 2022 market bottom has just flashed another buy signal, suggesting the cryptocurrency may be entering a new bull phase.

          Bitcoin metric hints at “absolute bottom”

          Dubbed the Macro Chain Index (MCI), the indicator is a composite of several long-term on-chain and macroeconomic metrics.
          It analyzes factors such as accumulation behavior, network activity, and supply trends, helping identify whether Bitcoin is undervalued or overvalued relative to its historical cycle position.
          The most important part of the current chart is the RSI (Relative Strength Index) of the MCI (purple). In April, the RSI crossed above its 52-week moving average (yellow), which has historically confirmed the start of Bitcoin bull runs.Bitcoin Macro Indicator That Predicted 2022 Bottom Flashes 'Buy Signal'_1

          Bitcoin macro chain index. Source: Alpha Extract

          This RSI crossover previously appeared in 2015 ahead of Bitcoin’s surge to $20,000, in 2019 before the run to $65,000, and in late 2022 just before BTC bottomed near $15,500.
          If historical patterns hold, the April 2025 crossover means the beginning of a new bull run, particularly as several other indicators also point to Bitcoin breaking above its key psychological resistance at $100,000.
          “Our Macro Chain Index fired a long signal, the first buy signal since 2022, when it successfully went long at the absolute bottom,” Alpha Extract, the creator of the Macro Chain Index, stressed further, adding:
          “Considering that the fundamentals align and the market structure is gradually following, this is a significant call, imho.”
          Bitcoin dipped by as much as 32% after establishing a record high of nearly $110,000 in January, a sharp decline caused primarily by US President Donald Trump’s global trade war.Bitcoin Macro Indicator That Predicted 2022 Bottom Flashes 'Buy Signal'_2

          BTC/USD weekly price chart. Source: TradingView

          BTC formed a local low below $74,450 in early April, but has since recovered to around $95,650 amid signs that it is “decoupling” from an otherwise bearish US stock market.

          Bitcoin open interest rises by $2.2 billion in April

          Bitcoin’s recent price rebound is gaining strong support from futures markets, especially on Binance.
          Between January and early April, open interest (OI) on the exchange dropped from $11.9 billion to $7.5 billion, marking a 36.9% decline and signaling reduced confidence and lower leverage during the market downturn. But the trend flipped in mid-April.
          Over the past three weeks, traders have pushed open interest up by 29.3%, from $7.5 billion to $9.7 billion, aligning with Bitcoin’s price rise in spot markets.Bitcoin Macro Indicator That Predicted 2022 Bottom Flashes 'Buy Signal'_3

          Bitcoin open interest (Binance) daily chart. Source: CryptoQuant

          This synchronized rise in price and open interest shows that traders are entering new long positions, not just closing shorts. It signals growing confidence in Bitcoin’s upside.
          Funding rates have also stayed mostly positive, which means long-position holders are paying short sellers, a typical sign that the market expects higher prices.Bitcoin Macro Indicator That Predicted 2022 Bottom Flashes 'Buy Signal'_4

          Bitcoin funding rates. Source: CryptoQuant

          The rising open interest and positive funding rates are showing renewed bullish momentum, adding weight to the argument that Bitcoin could continue climbing toward $100,000 in the coming days.

          Source: Cointelegraph

          Risk Warnings and Disclaimers
          You understand and acknowledge that there is a high degree of risk involved in trading. Following any strategies or investment methods may lead to potential losses. The content on the site is provided by our contributors and analysts for information purposes only. You are solely responsible for determining whether any trading assets, securities, strategy, or any other product is suitable for investing based on your own investment objectives and financial situation.
          Add to Favorites
          Share

          Fed’s Preferred Inflation Gauge Stalls While Spending Picks Up

          Glendon

          Economic

          Forex

          The Federal Reserve’s preferred inflation gauge stalled in March for the first time in nearly a year and consumer spending was strong, a welcome reprieve before tariffs are expected to broadly drive up prices.

          The personal consumption expenditures price index stagnated from February, according to Bureau of Economic Analysis data out Wednesday. Excluding food and energy, the so-called core PCE was also unchanged, the tamest in almost five years.

          Inflation-adjusted consumer spending climbed 0.7% last month after an upward revision to the prior month, suggesting households spent aggressively to get ahead of new tariffs.

          The data round out a quarter in which the US economy contracted for the first time since 2022 on a monumental pre-tariffs import surge and more moderate consumer spending. The report earlier Wednesday also showed core PCE inflation accelerated to a 3.5% pace in the first quarter — the most in a year.

          Source: Bloomberg Europe

          To stay updated on all economic events of today, please check out our Economic calendar
          Risk Warnings and Disclaimers
          You understand and acknowledge that there is a high degree of risk involved in trading. Following any strategies or investment methods may lead to potential losses. The content on the site is provided by our contributors and analysts for information purposes only. You are solely responsible for determining whether any trading assets, securities, strategy, or any other product is suitable for investing based on your own investment objectives and financial situation.
          Add to Favorites
          Share
          FastBull
          Copyright © 2025 FastBull Ltd

          728 RM B 7/F GEE LOK IND BLDG NO 34 HUNG TO RD KWUN TONG KLN HONG KONG

          TelegramInstagramTwitterfacebooklinkedin
          App Store Google Play Google Play
          Products
          Charts

          Chats

          Q&A with Experts
          Screeners
          Economic Calendar
          Data
          Tools
          Membership
          Features
          Function
          Markets
          Copy Trading
          Latest Signals
          Contests
          News
          Analysis
          24/7
          Columns
          Education
          Company
          Careers
          About Us
          Contact Us
          Advertising
          Help Center
          Feedback
          User Agreement
          Privacy Policy
          Business

          White Label

          Data API

          Web Plug-ins

          Poster Maker

          Affiliate Program

          Risk Disclosure

          The risk of loss in trading financial instruments such as stocks, FX, commodities, futures, bonds, ETFs and crypto can be substantial. You may sustain a total loss of the funds that you deposit with your broker. Therefore, you should carefully consider whether such trading is suitable for you in light of your circumstances and financial resources.

          No decision to invest should be made without thoroughly conducting due diligence by yourself or consulting with your financial advisors. Our web content might not suit you since we don't know your financial conditions and investment needs. Our financial information might have latency or contain inaccuracy, so you should be fully responsible for any of your trading and investment decisions. The company will not be responsible for your capital loss.

          Without getting permission from the website, you are not allowed to copy the website's graphics, texts, or trademarks. Intellectual property rights in the content or data incorporated into this website belong to its providers and exchange merchants.

          Not Logged In

          Log in to access more features

          FastBull Membership

          Not yet

          Purchase

          Become a signal provider
          Help Center
          Customer Service
          Dark Mode
          Price Up/Down Colors

          Log In

          Sign Up

          Position
          Layout
          Fullscreen
          Default to Chart
          The chart page opens by default when you visit fastbull.com