• Trade
  • Markets
  • Copy
  • Contests
  • News
  • 24/7
  • Calendar
  • Q&A
  • Chats
Trending
Screeners
SYMBOL
LAST
BID
ASK
HIGH
LOW
NET CHG.
%CHG.
SPREAD
SPX
S&P 500 Index
6818.87
6818.87
6818.87
6861.30
6801.50
-8.54
-0.13%
--
DJI
Dow Jones Industrial Average
48403.33
48403.33
48403.33
48679.14
48317.93
-54.71
-0.11%
--
IXIC
NASDAQ Composite Index
23095.03
23095.03
23095.03
23345.56
23012.00
-100.13
-0.43%
--
USDX
US Dollar Index
97.810
97.890
97.810
98.070
97.740
-0.140
-0.14%
--
EURUSD
Euro / US Dollar
1.17584
1.17593
1.17584
1.17686
1.17262
+0.00190
+ 0.16%
--
GBPUSD
Pound Sterling / US Dollar
1.33914
1.33923
1.33914
1.34014
1.33546
+0.00207
+ 0.15%
--
XAUUSD
Gold / US Dollar
4321.85
4322.28
4321.85
4350.16
4294.68
+22.46
+ 0.52%
--
WTI
Light Sweet Crude Oil
56.703
56.733
56.703
57.601
56.601
-0.530
-0.93%
--

Community Accounts

Signal Accounts
--
Profit Accounts
--
Loss Accounts
--
View More

Become a signal provider

Sell trading signals to earn additional income

View More

Guide to Copy Trading

Get started with ease and confidence

View More

Signal Accounts for Members

All Signal Accounts

Best Return
  • Best Return
  • Best P/L
  • Best MDD
Past 1W
  • Past 1W
  • Past 1M
  • Past 1Y

All Contests

  • All
  • Trump Updates
  • Recommend
  • Stocks
  • Cryptocurrencies
  • Central Banks
  • Featured News
Top News Only
Share

African Stock Market Closing Report | On Monday (December 15), The South African FTSE/Jse Africa Leading 40 Trading Index Closed Down 0.43%, Nearing 105,200 Points

Share

The Athens Stock Exchange Composite Index Closed Up 0.15% At 2107.43 Points

Share

The Offshore Yuan Broke Through 7.04 Against The US Dollar

Share

Fbi Director: A Fifth Individual Believed To Be Planning A Separate Attack Arrested By Fbi New Orleans

Share

New York Fed President Williams: The 2% Inflation Target Must Be Achieved Without Impacting The Job Market

Share

New York Fed President Williams: Monetary Policy Very Focused On Balancing Job, Inflation Risks

Share

New York Fed President Williams Expects USA Unemployment To Be 4.5% By End Of 2025

Share

New York Fed President Williams: Labor Market Risks Have Risen As Risks To Inflation Have Eased

Share

New York Fed President Williams Expects Inflation To Move To 2.5% In 2026, 2% In 2027

Share

New York Fed President Williams Sees Tariffs As A One-Off Price Adjustment, Not Spilling Over Into Broader Inflation

Share

New York Fed President Williams: Labor Market Cooling Has Been Gradual Process

Share

New York Fed President Williams Expects Active Usage Of Standing Repo Facility To Manage Liquidity

Share

New York Fed President Williams: Critical For USA Central Bank To Get Inflation Back To 2%

Share

New York Fed President Williams Expects 2026 GDP Growth To Hit 2.25%, Well Above 2025 Rate

Share

New York Fed President Williams Projects Jobless Rate Will Come Back Down Over Next Few Years

Share

New York Fed President Williams: Fed Policy Has Moved Toward Neutral From Modestly Restrictive

Share

Federal Reserve Governor Milan: I Would Be Happy To Vote For The Re-election Of Regional Fed Presidents

Share

Miran: What Is Most Surprising Is How Nice And Collegial The Fed Has Been

Share

Miran: The Least Attractive Part Of Being At The Fed Is Having Only 1 Of 12 Votes On A Committee

Share

White House To Host Press Call On Russia-Ukraine Peace Talks

TIME
ACT
FCST
PREV
Japan Tankan Small Manufacturing Outlook Index (Q4)

A:--

F: --

P: --

Japan Tankan Large Non-Manufacturing Outlook Index (Q4)

A:--

F: --

P: --

Japan Tankan Large Manufacturing Outlook Index (Q4)

A:--

F: --

P: --

Japan Tankan Small Manufacturing Diffusion Index (Q4)

A:--

F: --

P: --

Japan Tankan Large-Enterprise Capital Expenditure YoY (Q4)

A:--

F: --

P: --

U.K. Rightmove House Price Index YoY (Dec)

A:--

F: --

P: --

China, Mainland Industrial Output YoY (YTD) (Nov)

A:--

F: --

P: --

China, Mainland Urban Area Unemployment Rate (Nov)

A:--

F: --

P: --

Saudi Arabia CPI YoY (Nov)

A:--

F: --

P: --

Euro Zone Industrial Output YoY (Oct)

A:--

F: --

P: --

Euro Zone Industrial Output MoM (Oct)

A:--

F: --

P: --

Canada Existing Home Sales MoM (Nov)

A:--

F: --

P: --

Canada National Economic Confidence Index

A:--

F: --

P: --

Canada New Housing Starts (Nov)

A:--

F: --

P: --
U.S. NY Fed Manufacturing Employment Index (Dec)

A:--

F: --

P: --

U.S. NY Fed Manufacturing Index (Dec)

A:--

F: --

P: --

Canada Core CPI YoY (Nov)

A:--

F: --

P: --

Canada Manufacturing Unfilled Orders MoM (Oct)

A:--

F: --

P: --

U.S. NY Fed Manufacturing Prices Received Index (Dec)

A:--

F: --

P: --

U.S. NY Fed Manufacturing New Orders Index (Dec)

A:--

F: --

P: --

Canada Manufacturing New Orders MoM (Oct)

A:--

F: --

P: --

Canada Core CPI MoM (Nov)

A:--

F: --

P: --

Canada Trimmed CPI YoY (SA) (Nov)

A:--

F: --

P: --

Canada Manufacturing Inventory MoM (Oct)

A:--

F: --

P: --

Canada CPI YoY (Nov)

A:--

F: --

P: --

Canada CPI MoM (Nov)

A:--

F: --

P: --

Canada CPI YoY (SA) (Nov)

A:--

F: --

P: --

Canada Core CPI MoM (SA) (Nov)

A:--

F: --

P: --

Canada CPI MoM (SA) (Nov)

A:--

F: --

P: --

Federal Reserve Board Governor Milan delivered a speech
U.S. NAHB Housing Market Index (Dec)

A:--

F: --

P: --

Australia Composite PMI Prelim (Dec)

--

F: --

P: --

Australia Services PMI Prelim (Dec)

--

F: --

P: --

Australia Manufacturing PMI Prelim (Dec)

--

F: --

P: --

Japan Manufacturing PMI Prelim (SA) (Dec)

--

F: --

P: --

U.K. 3-Month ILO Employment Change (Oct)

--

F: --

P: --

U.K. Unemployment Claimant Count (Nov)

--

F: --

P: --

U.K. Unemployment Rate (Nov)

--

F: --

P: --

U.K. 3-Month ILO Unemployment Rate (Oct)

--

F: --

P: --

U.K. Average Weekly Earnings (3-Month Average, Including Bonuses) YoY (Oct)

--

F: --

P: --

U.K. Average Weekly Earnings (3-Month Average, Excluding Bonuses) YoY (Oct)

--

F: --

P: --

France Services PMI Prelim (Dec)

--

F: --

P: --

France Composite PMI Prelim (SA) (Dec)

--

F: --

P: --

France Manufacturing PMI Prelim (Dec)

--

F: --

P: --

Germany Services PMI Prelim (SA) (Dec)

--

F: --

P: --

Germany Manufacturing PMI Prelim (SA) (Dec)

--

F: --

P: --

Germany Composite PMI Prelim (SA) (Dec)

--

F: --

P: --

Euro Zone Composite PMI Prelim (SA) (Dec)

--

F: --

P: --

Euro Zone Services PMI Prelim (SA) (Dec)

--

F: --

P: --

Euro Zone Manufacturing PMI Prelim (SA) (Dec)

--

F: --

P: --

U.K. Services PMI Prelim (Dec)

--

F: --

P: --

U.K. Manufacturing PMI Prelim (Dec)

--

F: --

P: --

U.K. Composite PMI Prelim (Dec)

--

F: --

P: --

Euro Zone ZEW Economic Sentiment Index (Dec)

--

F: --

P: --

Germany ZEW Current Conditions Index (Dec)

--

F: --

P: --

Germany ZEW Economic Sentiment Index (Dec)

--

F: --

P: --

Euro Zone Trade Balance (Not SA) (Oct)

--

F: --

P: --

Euro Zone ZEW Current Conditions Index (Dec)

--

F: --

P: --

Euro Zone Trade Balance (SA) (Oct)

--

F: --

P: --

U.S. Retail Sales MoM (Excl. Gas Stations & Vehicle Dealers) (SA) (Oct)

--

F: --

P: --

U.S. Retail Sales MoM (Excl. Automobile) (SA) (Oct)

--

F: --

P: --

Q&A with Experts
    • All
    • Chatrooms
    • Groups
    • Friends
    Connecting
    .
    .
    .
    Type here...
    Add Symbol or Code

      No matching data

      All
      Trump Updates
      Recommend
      Stocks
      Cryptocurrencies
      Central Banks
      Featured News
      • All
      • Russia-Ukraine Conflict
      • Middle East Flashpoint
      • All
      • Russia-Ukraine Conflict
      • Middle East Flashpoint
      Search
      Products

      Charts Free Forever

      Chats Q&A with Experts
      Screeners Economic Calendar Data Tools
      Membership Features
      Data Warehouse Market Trends Institutional Data Policy Rates Macro

      Market Trends

      Market Sentiment Order Book Forex Correlations

      Top Indicators

      Charts Free Forever
      Markets

      News

      News Analysis 24/7 Columns Education
      From Institutions From Analysts
      Topics Columnists

      Latest Views

      Latest Views

      Trending Topics

      Top Columnists

      Latest Update

      Signals

      Copy Rankings Latest Signals Become a signal provider AI Rating
      Contests
      Brokers

      Overview Brokers Assessment Rankings Regulators News Claims
      Broker listing Forex Brokers Comparison Tool Live Spread Comparison Scam
      Q&A Complaint Scam Alert Videos Tips to Detect Scam
      More

      Business
      Events
      Careers About Us Advertising Help Center

      White Label

      Data API

      Web Plug-ins

      Affiliate Program

      Awards Institution Evaluation IB Seminar Salon Event Exhibition
      Vietnam Thailand Singapore Dubai
      Fans Party Investment Sharing Session
      FastBull Summit BrokersView Expo
      Recent Searches
        Top Searches
          Markets
          News
          Analysis
          User
          24/7
          Economic Calendar
          Education
          Data
          • Names
          • Latest
          • Prev

          View All

          No data

          Scan to Download

          Faster Charts, Chat Faster!

          Download App
          English
          • English
          • Español
          • العربية
          • Bahasa Indonesia
          • Bahasa Melayu
          • Tiếng Việt
          • ภาษาไทย
          • Français
          • Italiano
          • Türkçe
          • Русский язык
          • 简中
          • 繁中
          Open Account
          Search
          Products
          Charts Free Forever
          Markets
          News
          Signals

          Copy Rankings Latest Signals Become a signal provider AI Rating
          Contests
          Brokers

          Overview Brokers Assessment Rankings Regulators News Claims
          Broker listing Forex Brokers Comparison Tool Live Spread Comparison Scam
          Q&A Complaint Scam Alert Videos Tips to Detect Scam
          More

          Business
          Events
          Careers About Us Advertising Help Center

          White Label

          Data API

          Web Plug-ins

          Affiliate Program

          Awards Institution Evaluation IB Seminar Salon Event Exhibition
          Vietnam Thailand Singapore Dubai
          Fans Party Investment Sharing Session
          FastBull Summit BrokersView Expo

          Euro Zone Industry Growth Picks Up, Boosting Resilience Narrative

          Samantha Luan

          Forex

          Economic

          Summary:

          Industry expanded by 0.8% on the month after a 0.2% increase in September, in line with expectations, data from the EU's statistics agency Eurostat showed on Monday.

          Blast furnaces at a ThyssenKrupp steel factory in Duisburg, Germany, November 5, 2025. REUTERS/Leon Kuegeler

          Euro zone industrial output growth accelerated in October, bolstering views that the bloc is picking up momentum as trade uncertainty is dissipating, the labour market remains tight and consumption is inching up.

          Industry expanded by 0.8% on the month after a 0.2% increase in September, in line with expectations, data from the EU's statistics agency Eurostat showed on Monday.

          Compared to a year earlier, output growth accelerated to 2.0% in October from 1.2% in September, beating expectations for 1.9% in a Reuters poll of economists.

          German industry, expanding by 1.4% on the month, was among the top performers, offsetting a 1.0% drop in Italy and lukewarm growth in France.

          The euro zone economy has proven surprisingly resilient this year, and European Central Bank President Christine Lagarde has already said that another upgrade in the growth outlook is coming this week.

          Still, expansion is far from spectacular. The bloc is only growing at a rate just above 1%, near its so-called potential, as exports, the main driver of the economy in recent decades, remain weak and the domestic sector is producing nearly all growth.

          Industrial exports have struggled for years as surging energy costs have put the bloc at a cost disadvantage just as China was expanding its high-tech industrial base, grabbing market share.

          While industry might be bottoming out this year, there is no boom in sight and it is still somewhat unclear how the new U.S. tariff regime will alter global trading patterns.

          Nevertheless the bloc appears to be adjusting well, and even if there is no boom underway, the downside risk also appears limited.

          "Incoming high-frequency indicators continue to point to positive momentum in activity heading into year-end," Barclays said in a note.

          Source: Reuters

          To stay updated on all economic events of today, please check out our Economic calendar
          Risk Warnings and Disclaimers
          You understand and acknowledge that there is a high degree of risk involved in trading. Following any strategies or investment methods may lead to potential losses. The content on the site is provided by our contributors and analysts for information purposes only. You are solely responsible for determining whether any trading assets, securities, strategy, or any other product is suitable for investing based on your own investment objectives and financial situation.
          Add to Favorites
          Share

          Fear And Greed Index in Fear 30% of The Past Year, Bitcoin Back in Extreme Fear

          Glendon

          Cryptocurrency

          Technical Analysis

          As bitcoin BTC$89.907,85 struggles to hold above $90,000, market sentiment has once again slipped into extreme fear.

          Over the past year, fear or extreme fear has accounted for more than 30% of all readings on the Crypto Fear and Greed Index. The index currently stands at 17, firmly within the extreme fear section.

          Fear has dominated sentiment since the October liquidation crash more than two months ago, as bitcoin dropped 36% from its October all-time high. While the cryptocurrency market has yet to stage a meaningful recovery. With bitcoin currently trading nearly 30% below its all-time high, investor caution remains elevated.

          A similar disconnect is occurring in U.S. equities. Sentiment currently sits at 42, which signals fear, according to the CNN Fear and Greed Index, even as the S&P 500 trades around 6,827, just a few percentage points below its all-time high.

          Across both U.S. equities and cryptocurrencies, fear continues to dominate investor psychology.

          Bitcoin entered a death cross in November, a technical pattern where the 50-day moving average falls below the 200 day moving average. In this instance, the death cross coincided with a local bottom near $80,000 on Nov. 21. Notably, every death cross during the current market cycle since 2023 has marked a significant local bottom, reinforcing its relevance as a contrarian indicator in this cycle.

          Source: CoinDesk

          Risk Warnings and Disclaimers
          You understand and acknowledge that there is a high degree of risk involved in trading. Following any strategies or investment methods may lead to potential losses. The content on the site is provided by our contributors and analysts for information purposes only. You are solely responsible for determining whether any trading assets, securities, strategy, or any other product is suitable for investing based on your own investment objectives and financial situation.
          Add to Favorites
          Share

          AI Stock Rout Pressures U.S. Markets Despite Strong Fundamentals

          Gerik

          Stocks

          Economic

          Tech-Led Sell-Off Hits Wall Street as AI Sentiment Wavers

          On Friday, major U.S. indexes retreated sharply as investor enthusiasm for artificial intelligence stocks showed fresh signs of fading. Broadcom, a central player in the AI hardware space, plunged over 11% despite delivering earnings and forward guidance that beat expectations. The downturn triggered a broader sell-off in tech names such as Nvidia, AMD, and Oracle, pulling down the S&P 500 and Nasdaq Composite by 1.07% and 1.69%, respectively.
          This week’s movement reflects a growing dissonance between company fundamentals and investor behavior, as markets increasingly question the sustainability of AI stock valuations. While financial stocks helped lift the Dow Jones by 1.1% on a weekly basis, that resilience failed to support broader indices amid tech weakness.

          Contradiction Between Fundamentals and Market Reaction

          Broadcom's earnings performance and future outlook exceeded analysts' expectations, reinforcing its position as a critical supplier in the ongoing AI infrastructure build-out. Bernstein analyst Stacy Rasgon expressed confusion over the market reaction, emphasizing the company’s accelerating AI momentum. Yet the sharp sell-off suggests a disconnect between fundamentals and valuation confidence likely fueled by fears of an AI-driven speculative bubble.
          Investor caution was not triggered by deteriorating performance but by heightened sensitivity to any signals of margin compression or overvaluation. As Oracle’s refutation of Bloomberg's report on delayed data centers indicates, even speculative headlines are enough to cause outsized market responses. Without clear catalysts to affirm AI’s long-term profitability in the near term, this sentiment-driven volatility is likely to persist.
          Global Macroeconomic Signals Add to Caution
          Contributing to the souring risk mood were fresh signs of economic weakness from China, the world’s second-largest economy. November data showed that both retail sales and industrial production slowed more than expected, with fixed asset investment also contracting. These indicators raise concerns about global demand, especially for tech hardware and semiconductors heavily linked to supply chains in Asia.
          The slowdown in China also weighed on Asia-Pacific markets early Monday, with South Korea’s KOSPI falling 1.84%, a move that echoes the weakness in U.S. tech-heavy indices. As China remains a key demand center for electronics and AI-related infrastructure, any deterioration in its macro outlook can have cascading effects on investor sentiment globally.

          Broadcom at the Center of Diverging Views

          Despite the stock decline, many analysts remain bullish on Broadcom and the broader AI theme. UBS strategists reiterated their positive outlook for 2026, driven by AI, electrification, and infrastructure investment. They argue that while current valuations are being questioned, the structural demand behind AI remains intact and will continue to benefit semiconductor and infrastructure-focused firms.
          However, near-term volatility seems inevitable. Investors are increasingly risk-averse in light of high valuations, geopolitical noise, and uncertainties around fiscal and monetary policy in the U.S. Tech stocks particularly those associated with AI may face periodic corrections as expectations reset and broader market liquidity tightens into year-end.

          Sector Rotation and the Resilience of Financials

          One notable development amid the tech downturn is the resilience of financial stocks. With expectations of stable interest rates and robust earnings, traditional banks and insurers have helped support the Dow's performance. This may indicate the beginning of a broader sector rotation away from high-growth tech and into value-oriented plays, at least temporarily.
          The divergence also reveals shifting investor priorities: from long-duration tech bets to near-term earnings stability in traditional sectors. If AI valuations remain under pressure, this rebalancing could continue into early 2026, especially if inflation data and monetary policy expectations turn more hawkish.

          Copper Rally Reflects AI’s Physical Infrastructure Needs

          While AI-linked tech stocks faltered, the physical infrastructure that supports them continues to gain value. Copper prices have soared to record highs, underpinned by increased demand from the energy transition and data center construction. The metal’s role in electrical wiring, transmission, and cooling systems positions it as a critical input in the expanding AI and clean energy ecosystem.
          Citi analysts forecast further price increases in 2026, driven by structural supply constraints and the growing role of copper in AI infrastructure development. This creates a bifurcation in the AI theme: while equity markets debate valuations, commodity markets are responding to tangible, long-term demand.

          Short-Term Volatility Masks Long-Term Potential

          The latest market pullback underscores rising sensitivity around AI valuations and the challenges of navigating macroeconomic uncertainties. While Broadcom’s results point to a solid future, investor behavior reflects unease about timing and positioning. In the near term, sentiment may continue to override fundamentals, especially in high-momentum sectors.
          Nonetheless, structural themes such as AI expansion, energy infrastructure, and digitalization remain intact, as evidenced by soaring copper prices and optimistic long-term forecasts. The market’s current volatility may simply represent a recalibration phase before a more durable upward trajectory resumes in 2026.

          Source: CNBC

          To stay updated on all economic events of today, please check out our Economic calendar
          Risk Warnings and Disclaimers
          You understand and acknowledge that there is a high degree of risk involved in trading. Following any strategies or investment methods may lead to potential losses. The content on the site is provided by our contributors and analysts for information purposes only. You are solely responsible for determining whether any trading assets, securities, strategy, or any other product is suitable for investing based on your own investment objectives and financial situation.
          Add to Favorites
          Share

          China’s Economic Engine Stalls as Factory Output and Retail Sales Lose Momentum

          Gerik

          Economic

          Weakened Output and Consumption Underscore Domestic Fragility

          In November, China's industrial production expanded by 4.8% year-on-year, slightly below the 4.9% growth recorded in October and missing the 5.0% projection from a Reuters poll. This mild deceleration, while modest on paper, points to underlying structural fatigue in the world’s second-largest economy, particularly as global demand plateaus and domestic consumption remains tepid.
          More concerning was the sharp slowdown in retail sales, which rose just 1.3% compared to the 2.9% gain seen in October. This marks a notable deterioration in consumer sentiment, especially worrying as it comes during a period typically characterized by increased seasonal spending. The underperformance reflects a broader pattern of weak demand and declining consumer confidence that is proving resistant to recent policy efforts.

          Consumer Caution Deepens Despite Promotional Efforts

          November's slump in retail activity is further highlighted by a significant 8.5% year-on-year drop in auto sales the steepest contraction in ten months. This outcome defies the usual fourth-quarter boost from year-end promotions and reveals that discretionary spending remains under intense pressure. Even the extended Singles' Day festival, which was prolonged to five weeks by major e-commerce platforms to boost sales, failed to revive demand meaningfully. This suggests a fundamental lack of willingness or ability among households to spend, despite aggressive marketing and discounting.
          The muted performance indicates that the ongoing property sector turmoil continues to erode household wealth, thereby constraining consumption. Given that consumer spending is a critical pillar for rebalancing China's economic model, these results raise concerns about the sustainability of domestic-led recovery.
          Fixed Asset Investment Falls, Raising Concerns on Investment-Led Growth
          In a parallel trend, fixed asset investment also contracted by 1.3% in the January–November period, narrowing from a 1.7% decline in the first ten months but still reflective of sluggish momentum. The slight improvement was not enough to offset broader skepticism, especially as analysts had forecast a larger 2.3% drop.
          This decline underscores a broader investment slowdown, particularly in real estate and infrastructure areas long relied upon to fuel GDP expansion. Persistent weakness in these sectors casts doubt on the effectiveness of traditional stimulus levers and highlights the limitations of a policy framework still centered around heavy production and capital deployment.

          Policymakers Under Pressure Amid Growth Target Ambitions

          Despite the growing signs of economic strain, Beijing appears determined to pursue a 5% growth target for 2026, as the country enters the first year of a new five-year development plan. This ambition, while politically important, faces increasing skepticism from global institutions such as the World Bank and the IMF, both of which have issued more conservative forecasts for China’s growth trajectory.
          At a recent high-level policy meeting, Chinese leaders reaffirmed their commitment to a “proactive” fiscal stance, promising to stimulate both consumption and investment. However, their rhetoric also acknowledged a growing contradiction between strong domestic supply and faltering demand. This admission highlights a lingering reluctance to fully transition away from supply-side, export-driven policies toward a consumption-oriented economic model.

          Geopolitical Frictions Threaten External Demand Resilience

          China’s exports have remained relatively resilient, surprising analysts who expected sharper declines due to higher U.S. tariffs. However, this strength may not last. The nation’s substantial trade surplus exceeding a trillion dollars has provoked increasing pushback from trading partners. French President Emmanuel Macron, during a state visit, publicly criticized China’s trade imbalances and hinted at potential retaliatory tariffs. Similarly, Mexico approved tariffs of up to 50% on certain Chinese imports beginning next year.
          These actions introduce new risks to China's export engine, potentially weakening one of the few bright spots in the country’s current economic landscape. If retaliation spreads, external demand could contract sharply, compounding domestic vulnerabilities.
          China’s November data paints a sobering picture of an economy caught between weakening internal demand and growing external scrutiny. Industrial production and retail sales have lost momentum, while fixed investment continues to decline. Despite public commitments to rebalance the economy, the current policy response remains tethered to legacy models of growth. Until consumer confidence returns and structural imbalances are addressed, China’s path to sustainable recovery will likely remain uneven and vulnerable to both internal pressures and external frictions.

          Source: Reuters

          To stay updated on all economic events of today, please check out our Economic calendar
          Risk Warnings and Disclaimers
          You understand and acknowledge that there is a high degree of risk involved in trading. Following any strategies or investment methods may lead to potential losses. The content on the site is provided by our contributors and analysts for information purposes only. You are solely responsible for determining whether any trading assets, securities, strategy, or any other product is suitable for investing based on your own investment objectives and financial situation.
          Add to Favorites
          Share

          Gold Outlook: Volatility Rises As US Data And Central Banks Take Spotlight

          Pepperstone

          Commodity

          Forex

          Last week, gold showed resilience amid heightened volatility. Persistent dollar weakness, ongoing central bank purchases, and safe-haven demand driven by geopolitical uncertainty all supported the rally. At the same time, hawkish comments from Fed officials put some pressure on prices at elevated levels.

          This week, markets face several key risk events, including the US November nonfarm payrolls and CPI data, as well as rate decisions from the Bank of England and the Bank of Japan. The outcomes of these events could influence interest rate expectations and risk sentiment, significantly shaping gold's trajectory into year-end.

          Technical Observation: Bullish Momentum Accelerates, $4,300 Faces a Key Test

          On the XAUUSD daily chart, gold's bullish momentum picked up sharply last week, with four consecutive daily gains, shifting the trend from consolidation to an active uptrend. On Thursday, prices broke above the key $4,250 resistance, and on Friday, intraday highs reached $4,353, marking a seven-week peak.

          Although there was a rapid pullback of nearly $100 during the US session on Friday, with a long upper shadow highlighting high-level selling pressure, gold ultimately held above $4,300, posting a weekly gain of nearly 2.5%, signaling that bulls remained firmly in control.

          Gold Outlook: Volatility Rises As US Data And Central Banks Take Spotlight_1

          Entering Monday, gold continued its upward push, with RSI re-entering the overbought zone above 70, indicating sustained short-term momentum. If the daily candle closes above $4,300, market confidence in the uptrend will strengthen, with prices likely to test the previous high at $4,381.

          However, considering the short-term strength, a dip below $4,300 could see support emerge around the $4,180 consolidation low and the uptrend line extending from late October, potentially attracting dip buyers.

          Bullish "Base" Intact: Dollar, Central Banks, and Geopolitical Risks in Sync

          Gold's ability to hold gains at high levels remains supported by three key factors: the weaker dollar trend, continued central bank purchases, and hedging demand amid geopolitical uncertainty. Together, these elements provide the underlying framework for gold's price support.

          On the policy front, December saw a Fed rate cut alongside the resumption of short-term Treasury purchases to ease liquidity pressure, which helped short-term US yields ease. The dollar index fell for the third consecutive week, briefly testing near-term lows around 98.

          Dollar weakness lowers the opportunity cost of holding gold and diminishes the relative appeal of higher-yielding assets, redirecting capital flows back into gold.

          Gold Outlook: Volatility Rises As US Data And Central Banks Take Spotlight_2

          Meanwhile, central bank buying continues to act as a long-term "anchor" for gold. According to the World Gold Council, global central banks added a net 53 tonnes of gold in October, a significant month-on-month increase and the highest single-month total this year. Consistent official purchases provide a solid base for gold at high levels and support market acceptance of current price ranges.

          Geopolitical uncertainty also remains a factor. From US interception of Venezuelan oil shipments, the ongoing Russia-Ukraine stalemate, to tensions in Southeast Asia, these events continually reinforce demand for hedging. While each may have limited immediate impact, collectively they offer marginal support to gold amid broader uncertainty.

          Hawkish Fed Voices Emerge, Capping Short-Term Bullish Momentum

          Although Fed Chair Powell has clearly signaled that rate hikes are not being considered in the near term, hawkish voices persist within the Fed.

          Last Friday, Cleveland Fed President Harker (2026 voting member), Chicago Fed President Goolsby, and Kansas City Fed President George highlighted persistent inflation concerns, favoring a more restrictive stance. These comments pushed down market expectations for 2026 rate cuts, naturally weighing on short-term demand for non-yielding gold.

          In my view, this is more of a sentiment recalibration at high levels than the start of a trend reversal. As long as the dollar remains relatively weak, coupled with ongoing central bank purchases and geopolitical hedging demand, the medium-term bullish structure for gold remains intact.

          Focus on US Data and Central Bank Decisions, Watch for Volatility

          Overall, the bullish structure for gold remains intact, but short-term volatility has increased. With the holiday season approaching, active capital is winding down and market liquidity is thinner. Any deviation from expectations in major risk events is more likely to trigger trend moves rather than just intraday noise. In this environment, risk management is more important than directional calls.

          In the US, key focus this week is on November nonfarm payrolls (Thursday AEDT) and CPI (Friday AEDT). Markets expect around 50k new jobs, a slight rise in the unemployment rate to 4.5%, and core inflation near 3%.

          If labor data comes in slightly stronger, say 60–70k new jobs with unemployment at 4.4–4.5% and inflation broadly as expected, it would suggest the economy is not slowing sharply and that rate cuts still have room, potentially putting modest pressure on gold bulls.

          Conversely, if the labor market shows a clear weakness—negative job growth, unemployment rising to 4.6% or higher, and core inflation falling to 2.8–2.9%—markets may price in a "recession trade," which would clearly benefit gold.

          Additionally, several Fed officials, including Williams and Bostic, are scheduled to speak this week. Their comments on economic prospects and policy direction could further influence expectations for future easing, amplifying short-term price swings.

          Globally, central bank policy divergence is also significant. The market widely expects the Bank of England to cut rates by 25bps, while the Bank of Japan has over a 90% chance of a rate hike. Diverging paths among major central banks could, via currency and rate channels, further intensify short-term gold volatility.

          Source: Pepperstone

          Risk Warnings and Disclaimers
          You understand and acknowledge that there is a high degree of risk involved in trading. Following any strategies or investment methods may lead to potential losses. The content on the site is provided by our contributors and analysts for information purposes only. You are solely responsible for determining whether any trading assets, securities, strategy, or any other product is suitable for investing based on your own investment objectives and financial situation.
          Add to Favorites
          Share

          Japanese Business Sentiment Climbs to 4-Year Peak, Paving Way for BOJ Rate Hike

          Gerik

          Economic

          Business Confidence Rises as Japan Navigates External Pressures

          In the final quarter of 2025, business confidence among large Japanese manufacturers rose to its highest level in four years, with the Bank of Japan’s December Tankan survey reporting a sentiment index of +15, up from +14 in September. This marks the third consecutive quarterly improvement, indicating that firms have thus far absorbed the impact of increased U.S. tariffs without a significant decline in operational outlook. The figure aligned with market expectations and reflects continued resilience in Japan’s industrial sector.
          Non-manufacturers maintained a robust sentiment index of +34, unchanged from the previous quarter. This consistency across both manufacturing and service sectors provides support for the prevailing market view that the Bank of Japan will proceed with a policy rate hike during its December 18–19 meeting. The central bank is reportedly preparing to raise its short-term policy rate from 0.5% to 0.75%.

          Strength in Capital Investment Supports Policy Shift

          In addition to rising sentiment, capital expenditure projections further reinforce expectations of monetary tightening. Large firms anticipate a 12.6% increase in capital investment for the fiscal year ending March 2026, surpassing the median forecast of 12%. This commitment to investment suggests business confidence in underlying demand conditions, despite ongoing external uncertainties.
          The Tankan survey also revealed that firms observed rising sales prices in the fourth quarter and expect this trend to persist in the near term. This ability to pass on higher costs indicates that pricing power remains intact, a key condition that allows the central bank to continue phasing out its ultra-loose monetary policy framework.

          Short-Term Optimism Dampened by Medium-Term Caution

          Despite these positive indicators, Japanese businesses expressed concern about worsening conditions in the next three months. These concerns primarily relate to the uncertain impact of prolonged U.S. tariff policies, subdued domestic consumption, and the persistent challenge of labor shortages. A Bank of Japan official highlighted that while trade tensions have eased, inflation and demographic constraints continue to cloud the medium-term outlook.
          The index measuring labor market conditions indicated the tightest environment since 1991, during Japan’s bubble era. While such tightness risks slowing growth, analysts suggest it could also support wage inflation a necessary component in the BOJ’s framework for a sustained rate normalization process. According to Capital Economics, this wage-price dynamic could justify a further rate increase to 1.75% by 2027, assuming consistent gains in income and consumption.

          Mixed Economic Signals Offer Conditional Support for BOJ Hike

          Japan’s economy contracted in the third quarter as exports weakened under pressure from U.S. tariffs. However, recent data signals a potential rebound in the current quarter, with recovery in both exports and factory output. This supports the BOJ’s cautious optimism that Japan can withstand moderate tightening without derailing growth.
          Nevertheless, firms remain wary of structural issues. The aging population and shrinking labor pool pose long-term challenges that may limit potential growth. These underlying demographic pressures make the current wage growth both a necessity and a constraint: while it supports policy tightening, it also reflects an economy straining to maintain productivity without sufficient workforce expansion.
          The December Tankan survey reinforces expectations that the Bank of Japan will raise interest rates this week for the first time in months. Strong business sentiment, improved capital investment plans, and pricing power signal that conditions are in place for such a move. However, caution persists among firms due to trade uncertainties, soft consumption, and a critically tight labor market. The BOJ must now navigate a delicate balance normalizing policy to reflect improved fundamentals, while remaining responsive to the persistent vulnerabilities that could temper Japan’s recovery in the longer term.

          Source: Reuters

          To stay updated on all economic events of today, please check out our Economic calendar
          Risk Warnings and Disclaimers
          You understand and acknowledge that there is a high degree of risk involved in trading. Following any strategies or investment methods may lead to potential losses. The content on the site is provided by our contributors and analysts for information purposes only. You are solely responsible for determining whether any trading assets, securities, strategy, or any other product is suitable for investing based on your own investment objectives and financial situation.
          Add to Favorites
          Share

          Market Analysis: AUD/USD And NZD/USD Test Support, Break Or Bounce Next?

          FXOpen

          Forex

          Economic

          AUD/USD is attempting a fresh increase from 0.6630. NZD/USD is consolidating and could aim for a move above 0.5800 in the short term.

          Important Takeaways for AUD/USD and NZD/USD Analysis Today

          · The Aussie Dollar started a minor pullback from 0.6685 against the US Dollar.

          · There is a key bullish trend line forming with support at 0.6645 on the hourly chart of AUD/USD at FXOpen.

          · NZD/USD is consolidating above 0.5765 and 0.5755.

          · There is a major bullish trend line forming with support at 0.5765 on the hourly chart of NZD/USD at FXOpen.

          AUD/USD Technical Analysis

          On the hourly chart of AUD/USD at FXOpen, the pair formed a base above 0.6600. The Aussie Dollar started a decent increase above 0.6630 against the US Dollar to enter a short-term positive zone.

          The pair struggled above 0.6680 and recently corrected some gains. The recent low was formed at 0.6632. The pair is now consolidating and facing resistance near the 50% Fib retracement level of the downward move from the 0.6677 swing high to the 0.6632 low at 0.6655 and the 50-hour simple moving average.

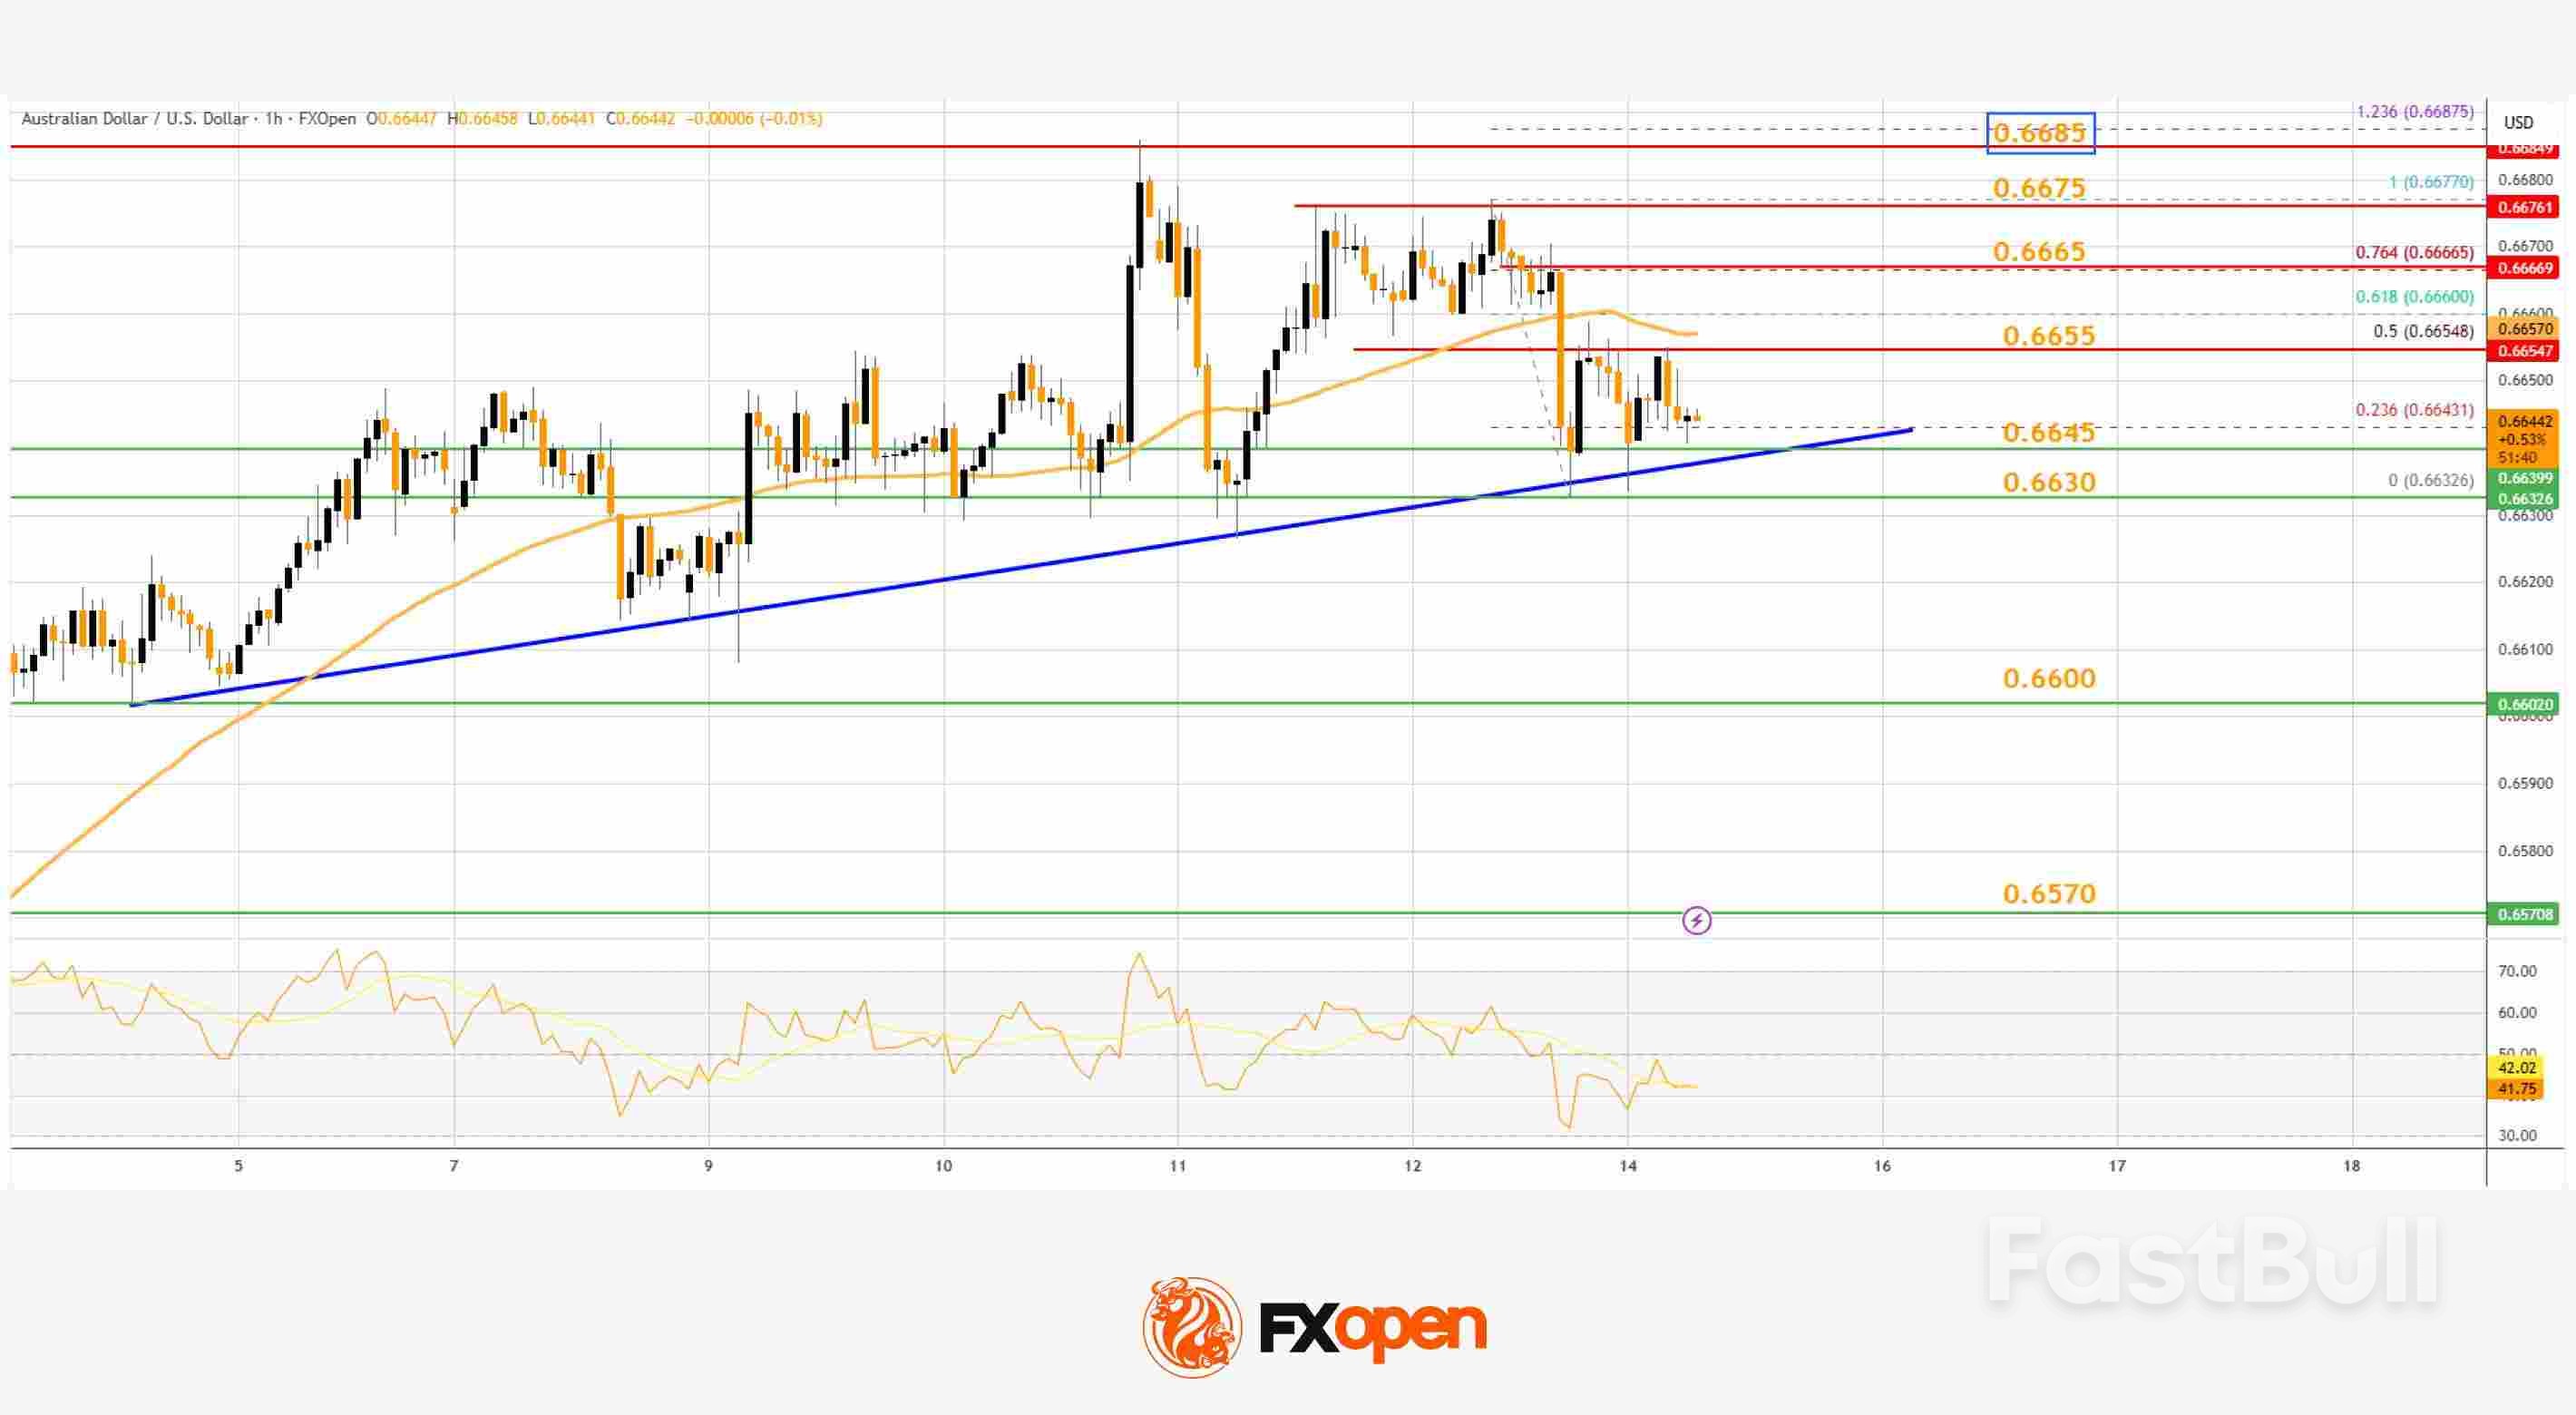
          The AUD/USD chart indicates that the pair could struggle to clear the 76.4% Fib retracement at 0.6665. The first major hurdle for the bulls could be 0.6685.

          An upside break above 0.6685 resistance might send the pair further higher. The next major target is near the 0.6720 level. Any more gains could clear the path for a move toward 0.6750. If there is no close above 0.6665, the pair might start a fresh decline.

          Immediate bid zone could be near the 0.6645 level. There is also a key bullish trend line forming with support at 0.6645. The next area of interest is 0.6630. If there is a downside break below 0.6630, the pair could extend its decline toward 0.6600. Any more losses might signal a move toward 0.6570.

          NZD/USD Technical Analysis

          On the hourly chart of NZD/USD on FXOpen, the pair also followed AUD/USD. The New Zealand Dollar failed to stay above 0.5800 and corrected gains against the US Dollar.

          The pair dipped below 0.5790 and the 50-hour simple moving average and 0.5830. A low was formed at 0.5765, and the pair is now consolidating below the 23.6% Fib retracement level of the downward move from the 0.5831 swing high to the 0.5765 low.

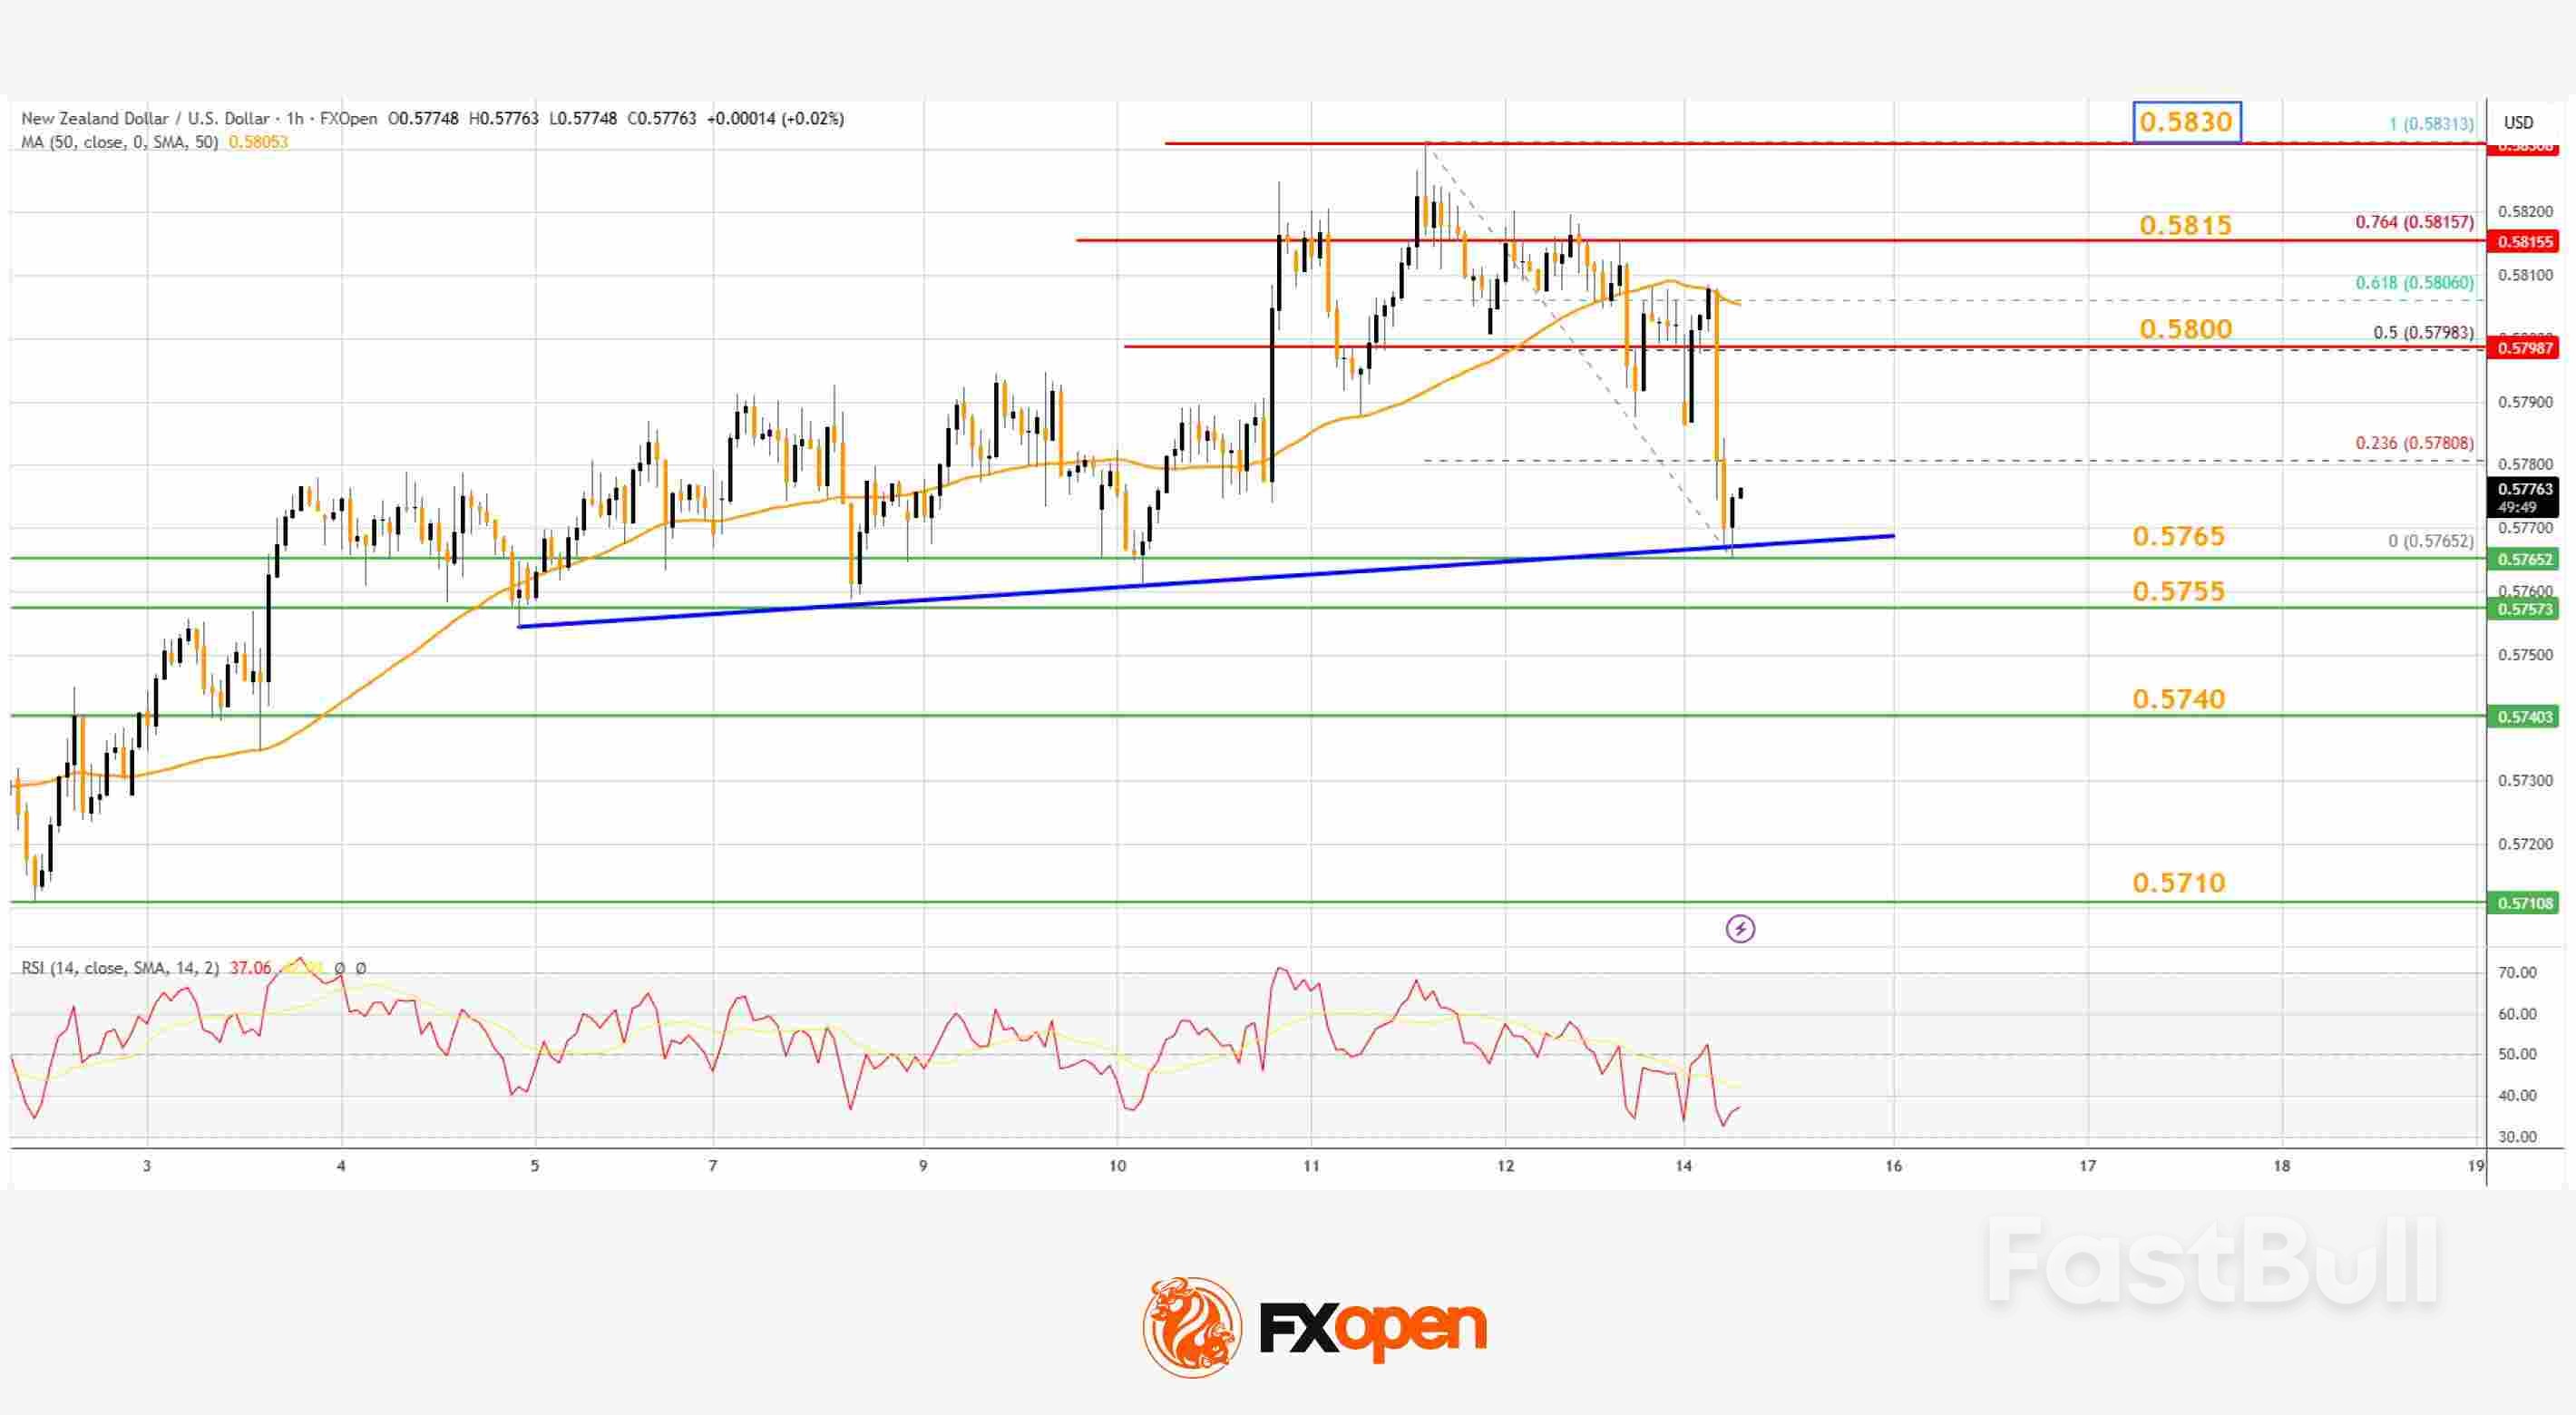
          The NZD/USD chart suggests that the RSI is below 40, signaling a short-term negative bias. On the upside, the pair is facing resistance near the 50% Fib retracement level at 0.5800.

          The next major hurdle for buyers could be 0.5815. A clear move above 0.5815 might even push the pair toward 0.5830. Any more gains might clear the path for a move toward the 0.5880 pivot zone in the coming sessions.

          On the downside, there is support forming near the 0.5765 zone and a bullish trend line. If there is a downside break below 0.5765, the pair might slide toward 0.5740. Any more losses could lead NZD/USD into a bearish zone to 0.5710.

          Source: FXOpen

          To stay updated on all economic events of today, please check out our Economic calendar
          Risk Warnings and Disclaimers
          You understand and acknowledge that there is a high degree of risk involved in trading. Following any strategies or investment methods may lead to potential losses. The content on the site is provided by our contributors and analysts for information purposes only. You are solely responsible for determining whether any trading assets, securities, strategy, or any other product is suitable for investing based on your own investment objectives and financial situation.
          Add to Favorites
          Share
          FastBull
          Copyright © 2025 FastBull Ltd

          728 RM B 7/F GEE LOK IND BLDG NO 34 HUNG TO RD KWUN TONG KLN HONG KONG

          TelegramInstagramTwitterfacebooklinkedin
          App Store Google Play Google Play
          Products
          Charts

          Chats

          Q&A with Experts
          Screeners
          Economic Calendar
          Data
          Tools
          Membership
          Features
          Function
          Markets
          Copy Trading
          Latest Signals
          Contests
          News
          Analysis
          24/7
          Columns
          Education
          Company
          Careers
          About Us
          Contact Us
          Advertising
          Help Center
          Feedback
          User Agreement
          Privacy Policy
          Business

          White Label

          Data API

          Web Plug-ins

          Poster Maker

          Affiliate Program

          Risk Disclosure

          The risk of loss in trading financial instruments such as stocks, FX, commodities, futures, bonds, ETFs and crypto can be substantial. You may sustain a total loss of the funds that you deposit with your broker. Therefore, you should carefully consider whether such trading is suitable for you in light of your circumstances and financial resources.

          No decision to invest should be made without thoroughly conducting due diligence by yourself or consulting with your financial advisors. Our web content might not suit you since we don't know your financial conditions and investment needs. Our financial information might have latency or contain inaccuracy, so you should be fully responsible for any of your trading and investment decisions. The company will not be responsible for your capital loss.

          Without getting permission from the website, you are not allowed to copy the website's graphics, texts, or trademarks. Intellectual property rights in the content or data incorporated into this website belong to its providers and exchange merchants.

          Not Logged In

          Log in to access more features

          FastBull Membership

          Not yet

          Purchase

          Become a signal provider
          Help Center
          Customer Service
          Dark Mode
          Price Up/Down Colors

          Log In

          Sign Up

          Position
          Layout
          Fullscreen
          Default to Chart
          The chart page opens by default when you visit fastbull.com