• Trade
  • Markets
  • Copy
  • Contests
  • News
  • 24/7
  • Calendar
  • Q&A
  • Chats
Trending
Screeners
SYMBOL
LAST
BID
ASK
HIGH
LOW
NET CHG.
%CHG.
SPREAD
SPX
S&P 500 Index
6827.42
6827.42
6827.42
6899.86
6801.80
-73.58
-1.07%
--
DJI
Dow Jones Industrial Average
48458.04
48458.04
48458.04
48886.86
48334.10
-245.98
-0.51%
--
IXIC
NASDAQ Composite Index
23195.16
23195.16
23195.16
23554.89
23094.51
-398.69
-1.69%
--
USDX
US Dollar Index
97.950
98.030
97.950
98.500
97.950
-0.370
-0.38%
--
EURUSD
Euro / US Dollar
1.17394
1.17409
1.17394
1.17496
1.17192
+0.00011
+ 0.01%
--
GBPUSD
Pound Sterling / US Dollar
1.33707
1.33732
1.33707
1.33997
1.33419
-0.00148
-0.11%
--
XAUUSD
Gold / US Dollar
4299.39
4299.39
4299.39
4353.41
4257.10
+20.10
+ 0.47%
--
WTI
Light Sweet Crude Oil
57.233
57.485
57.233
58.011
56.969
-0.408
-0.71%
--

Community Accounts

Signal Accounts
--
Profit Accounts
--
Loss Accounts
--
View More

Become a signal provider

Sell trading signals to earn additional income

View More

Guide to Copy Trading

Get started with ease and confidence

View More

Signal Accounts for Members

All Signal Accounts

Best Return
  • Best Return
  • Best P/L
  • Best MDD
Past 1W
  • Past 1W
  • Past 1M
  • Past 1Y

All Contests

  • All
  • Trump Updates
  • Recommend
  • Stocks
  • Cryptocurrencies
  • Central Banks
  • Featured News
Top News Only
Share

Iranian Media Says 18 Crew Members Of Foreign Tanker Seized In Gulf Of Oman Over Carrying 'Smuggled Fuel' Detained

Share

Regional Governor: Two Killed In Ukrainian Drone Strike On Russia's Saratov

Share

Chinese Foreign Ministry - China Foreign Minister Met With United Arab Emirates Counterpart On Dec 12

Share

China's Central Financial And Economic Affairs Commission Deputy Director: Will Expand Export And Increase Import In 2026

Share

Thai Leader Anutin: Landmine Blast That Killed Thai Soldiers 'Not A Roadside Accident'

Share

Thai Leader Anutin: Thailand To Continue Military Action Until 'We Feel No More Harm'

Share

Cambodian Prime Minister Hun Manet Says He Had Phone Calls With Trump And Malaysian Leader Anwar About Ceasefire

Share

Cambodia's Hun Manet Says USA, Malaysia Should Verify 'Which Side Fired First' In Latest Conflict

Share

Cambodia's Hun Manet: Cambodia Maintains Its Stance In Seeking Peaceful Resolution Of Disputes

Share

Nasdaq Companies: Allergan, Ferrovia, Insmed, Monolithic Power Systems, Seagate Technology, And Western Digital Will Be Added To The NASDAQ 100 Index. Biogen, CdW, GlobalFoundries, Lululemon, ON Semiconductor, And Tradedesk Will Be Removed From The NASDAQ 100 Index

Share

Witkoff Headed To Berlin This Weekend To Meet With Zelenskiy, European Leaders -Wsj Reporter On X

Share

Russia Attacks Two Ukrainian Ports, Damaging Three Turkish-Owned Vessels

Share

[Historic Flooding Occurs In At Least Four Rivers In Washington State Due To Days Of Torrential Rains] Multiple Areas In Washington State Have Been Hit By Severe Flooding Due To Days Of Torrential Rains, With At Least Four Rivers Experiencing Historic Flooding. Reporters Learned On The 12th That The Floods Caused By The Torrential Rains In Washington State Have Destroyed Homes And Closed Several Highways. Experts Warn That Even More Severe Flooding May Occur In The Future. A State Of Emergency Has Been Declared In Washington State

Share

Trump Says Proposed Free Economic Zone In Donbas Would Work

Share

Trump: I Think My Voice Should Be Heard

Share

Trump Says Will Be Choosing New Fed Chair In Near Future

Share

Trump Says Proposed Free Economic Zone In Donbas Complex But Would Work

Share

Trump Says Land Strikes In Venezuela Will Start Happening

Share

US President Trump: Thailand And Cambodia Are In A Good Situation

Share

State Media: North Korean Leader Kim Hails Troops Returning From Russia Mission

TIME
ACT
FCST
PREV
U.K. Trade Balance Non-EU (SA) (Oct)

A:--

F: --

P: --

U.K. Trade Balance (Oct)

A:--

F: --

P: --

U.K. Services Index MoM

A:--

F: --

P: --

U.K. Construction Output MoM (SA) (Oct)

A:--

F: --

P: --

U.K. Industrial Output YoY (Oct)

A:--

F: --

P: --

U.K. Trade Balance (SA) (Oct)

A:--

F: --

P: --

U.K. Trade Balance EU (SA) (Oct)

A:--

F: --

P: --

U.K. Manufacturing Output YoY (Oct)

A:--

F: --

P: --

U.K. GDP MoM (Oct)

A:--

F: --

P: --

U.K. GDP YoY (SA) (Oct)

A:--

F: --

P: --

U.K. Industrial Output MoM (Oct)

A:--

F: --

P: --

U.K. Construction Output YoY (Oct)

A:--

F: --

P: --

France HICP Final MoM (Nov)

A:--

F: --

P: --

China, Mainland Outstanding Loans Growth YoY (Nov)

A:--

F: --

P: --

China, Mainland M2 Money Supply YoY (Nov)

A:--

F: --

P: --

China, Mainland M0 Money Supply YoY (Nov)

A:--

F: --

P: --

China, Mainland M1 Money Supply YoY (Nov)

A:--

F: --

P: --

India CPI YoY (Nov)

A:--

F: --

P: --

India Deposit Gowth YoY

A:--

F: --

P: --

Brazil Services Growth YoY (Oct)

A:--

F: --

P: --

Mexico Industrial Output YoY (Oct)

A:--

F: --

P: --

Russia Trade Balance (Oct)

A:--

F: --

P: --

Philadelphia Fed President Henry Paulson delivers a speech
Canada Building Permits MoM (SA) (Oct)

A:--

F: --

P: --

Canada Wholesale Sales YoY (Oct)

A:--

F: --

P: --

Canada Wholesale Inventory MoM (Oct)

A:--

F: --

P: --

Canada Wholesale Inventory YoY (Oct)

A:--

F: --

P: --

Canada Wholesale Sales MoM (SA) (Oct)

A:--

F: --

P: --

Germany Current Account (Not SA) (Oct)

A:--

F: --

P: --

U.S. Weekly Total Rig Count

A:--

F: --

P: --

U.S. Weekly Total Oil Rig Count

A:--

F: --

P: --

Japan Tankan Large Non-Manufacturing Diffusion Index (Q4)

--

F: --

P: --

Japan Tankan Small Manufacturing Outlook Index (Q4)

--

F: --

P: --

Japan Tankan Large Non-Manufacturing Outlook Index (Q4)

--

F: --

P: --

Japan Tankan Large Manufacturing Outlook Index (Q4)

--

F: --

P: --

Japan Tankan Small Manufacturing Diffusion Index (Q4)

--

F: --

P: --

Japan Tankan Large Manufacturing Diffusion Index (Q4)

--

F: --

P: --

Japan Tankan Large-Enterprise Capital Expenditure YoY (Q4)

--

F: --

P: --

U.K. Rightmove House Price Index YoY (Dec)

--

F: --

P: --

China, Mainland Industrial Output YoY (YTD) (Nov)

--

F: --

P: --

China, Mainland Urban Area Unemployment Rate (Nov)

--

F: --

P: --

Saudi Arabia CPI YoY (Nov)

--

F: --

P: --

Euro Zone Industrial Output YoY (Oct)

--

F: --

P: --

Euro Zone Industrial Output MoM (Oct)

--

F: --

P: --

Canada Existing Home Sales MoM (Nov)

--

F: --

P: --

Euro Zone Total Reserve Assets (Nov)

--

F: --

P: --

U.K. Inflation Rate Expectations

--

F: --

P: --

Canada National Economic Confidence Index

--

F: --

P: --

Canada New Housing Starts (Nov)

--

F: --

P: --

U.S. NY Fed Manufacturing Employment Index (Dec)

--

F: --

P: --

U.S. NY Fed Manufacturing Index (Dec)

--

F: --

P: --

Canada Core CPI YoY (Nov)

--

F: --

P: --

Canada Manufacturing Unfilled Orders MoM (Oct)

--

F: --

P: --

Canada Manufacturing New Orders MoM (Oct)

--

F: --

P: --

Canada Core CPI MoM (Nov)

--

F: --

P: --

Canada Manufacturing Inventory MoM (Oct)

--

F: --

P: --

Canada CPI YoY (Nov)

--

F: --

P: --

Canada CPI MoM (Nov)

--

F: --

P: --

Canada CPI YoY (SA) (Nov)

--

F: --

P: --

Canada Core CPI MoM (SA) (Nov)

--

F: --

P: --

Q&A with Experts
    • All
    • Chatrooms
    • Groups
    • Friends
    Connecting
    .
    .
    .
    Type here...
    Add Symbol or Code

      No matching data

      All
      Trump Updates
      Recommend
      Stocks
      Cryptocurrencies
      Central Banks
      Featured News
      • All
      • Russia-Ukraine Conflict
      • Middle East Flashpoint
      • All
      • Russia-Ukraine Conflict
      • Middle East Flashpoint
      Search
      Products

      Charts Free Forever

      Chats Q&A with Experts
      Screeners Economic Calendar Data Tools
      Membership Features
      Data Warehouse Market Trends Institutional Data Policy Rates Macro

      Market Trends

      Market Sentiment Order Book Forex Correlations

      Top Indicators

      Charts Free Forever
      Markets

      News

      News Analysis 24/7 Columns Education
      From Institutions From Analysts
      Topics Columnists

      Latest Views

      Latest Views

      Trending Topics

      Top Columnists

      Latest Update

      Signals

      Copy Rankings Latest Signals Become a signal provider AI Rating
      Contests
      Brokers

      Overview Brokers Assessment Rankings Regulators News Claims
      Broker listing Forex Brokers Comparison Tool Live Spread Comparison Scam
      Q&A Complaint Scam Alert Videos Tips to Detect Scam
      More

      Business
      Events
      Careers About Us Advertising Help Center

      White Label

      Data API

      Web Plug-ins

      Affiliate Program

      Awards Institution Evaluation IB Seminar Salon Event Exhibition
      Vietnam Thailand Singapore Dubai
      Fans Party Investment Sharing Session
      FastBull Summit BrokersView Expo
      Recent Searches
        Top Searches
          Markets
          News
          Analysis
          User
          24/7
          Economic Calendar
          Education
          Data
          • Names
          • Latest
          • Prev

          View All

          No data

          Scan to Download

          Faster Charts, Chat Faster!

          Download App
          English
          • English
          • Español
          • العربية
          • Bahasa Indonesia
          • Bahasa Melayu
          • Tiếng Việt
          • ภาษาไทย
          • Français
          • Italiano
          • Türkçe
          • Русский язык
          • 简中
          • 繁中
          Open Account
          Search
          Products
          Charts Free Forever
          Markets
          News
          Signals

          Copy Rankings Latest Signals Become a signal provider AI Rating
          Contests
          Brokers

          Overview Brokers Assessment Rankings Regulators News Claims
          Broker listing Forex Brokers Comparison Tool Live Spread Comparison Scam
          Q&A Complaint Scam Alert Videos Tips to Detect Scam
          More

          Business
          Events
          Careers About Us Advertising Help Center

          White Label

          Data API

          Web Plug-ins

          Affiliate Program

          Awards Institution Evaluation IB Seminar Salon Event Exhibition
          Vietnam Thailand Singapore Dubai
          Fans Party Investment Sharing Session
          FastBull Summit BrokersView Expo

          Ethereum Falls Below $4,000 Amid Increased ETF Outflows

          Glendon

          Cryptocurrency

          Summary:

          ETF outflows surpass $428 million instigating sell pressure. BitMine acquires over 100,000 ETH during fluctuation. Ethereum's price below $4,000 reflects broader market effects.

          Ethereum (ETH) fell below $4,000 due to substantial ETF outflows and whale activity. Notably, BlackRock's ETF saw $310.13M in outflows, increasing sell pressure, while BitMine added 104,336 ETH, signaling institutional confidence.

          Ethereum dipped below the $4,000 mark on October 13, 2025, following notable institutional outflows primarily from BlackRock's ETF, amid wider crypto market volatility.

          The event signifies Ethereum's vulnerability to ETF flows, affecting investor sentiment. Market response reflects broader technology sector dynamics.

          Ethereum's recent descent was chiefly influenced by institutional behaviors, particularly BlackRock’s ETF outflow of $310 million in one day. Owning over 100,000 ETH, BitMine counteracted with significant accumulation. Influences trace back to heightened volatility within the market.

          Negative net flows marked by Ethereum ETFs reached $428.5 million combined. BlackRock, as a key player, catalyzed sell pressure. Absent commentary from Ethereum's leadership, institutional moves dominated the discourse.

          Bitcoin and major altcoins also mirrored Ethereum's decline. DeFi and NFT sectors revealed reduced activity, accentuating impacts on network demand. Analysts project technical rebounds yet stress prevailing market skepticism.

          "Ethereum must reclaim the $4,076 resistance to trigger a bullish momentum shift…Short-term forecasts suggest a possible rebound to $4,427 by October 20." - Binance Analyst, Binance.com

          Analyzing historical precedents, ETH often recovers post correction. Major past sell-offs required stabilizing above technical support. Historical data indicates patterns of balance restoration following institutional actions.

          Ethereum must navigate potential regulatory shifts affecting technological integration. Focus pivots on long-term trends in network utilization, indicating how the ecosystem might adjust amid financial and technological landscapes.

          Source: CryptoSlate

          Risk Warnings and Disclaimers
          You understand and acknowledge that there is a high degree of risk involved in trading. Following any strategies or investment methods may lead to potential losses. The content on the site is provided by our contributors and analysts for information purposes only. You are solely responsible for determining whether any trading assets, securities, strategy, or any other product is suitable for investing based on your own investment objectives and financial situation.
          Add to Favorites
          Share

          Oil Prices Rebound as India Signals Shift Away from Russian Supply

          Gerik

          Economic

          Commodity

          India’s Pivot on Russian Oil Lifts Crude Prices Amid Global Supply Jitters

          After a sharp decline earlier this week, crude oil prices rebounded Thursday following remarks by U.S. President Donald Trump that India will cease buying oil from Russia, a move that could significantly reshape global energy flows. Trump cited a commitment from Indian Prime Minister Narendra Modi, although no official timeline or confirmation has been issued by New Delhi. Despite this, Brent crude climbed near $62 and WTI hovered around $59, reversing two sessions of losses.
          India’s pivot is seen as a bullish signal, as the world’s third-largest oil importer will need to restructure its sourcing from Russia currently supplying India at roughly three times the volume of U.S. exports toward more Middle Eastern or American suppliers. Analysts say this shift could trigger short-term market tightening, especially if executed swiftly.

          Behind the Shift: U.S. Pressure, Trade Talks, and Sanctions

          India’s decision appears to be influenced by mounting pressure from the U.S., particularly as it seeks to accelerate trade negotiations. Washington has been increasingly critical of Indian firms that have benefited from G7 price-capped Russian oil, accusing them of profiteering and undermining Western efforts to curtail Kremlin revenues. On Wednesday, India’s trade secretary noted the country’s capacity to purchase $15 billion more in U.S. oil, hinting at potential redirection strategies.
          Concurrently, the U.K. imposed sanctions on Russian oil majors, two Chinese energy firms, and Indian refiner Nayara Energy Ltd. due to their continued dealings with Russian fuel. This aligns with a broader Western push to suffocate Russia’s energy income and limit Putin’s war chest.

          Oil Volatility Remains Amid Mixed Supply and Demand Signals

          Despite the price rebound, the oil market remains volatile. Recent reports from major trading houses suggest a long-anticipated oversupply may be materializing, contributing to downward pressure on prices. Adding to the uncertainty, U.S. crude inventories reportedly surged by 7.4 million barrels last week, the biggest weekly gain since July pending confirmation from official data.
          Trade tensions are also muddying the outlook. While Trump declared that the U.S. remains in a trade war with China, Treasury Secretary Scott Bessent proposed a temporary easing of tariffs to resolve disputes over critical minerals creating a mixed policy message for energy traders to decipher.
          India’s potential withdrawal from Russian oil marks a strategic realignment that could pressure global supplies and support prices in the short term. However, with rising U.S. inventories, possible oversupply trends, and geopolitical uncertainty still in play, oil’s upward momentum may face limits without broader confirmation of demand resilience. Investors now await official inventory data and clarity from New Delhi on the extent of its energy realignment before drawing firmer conclusions.

          Source: Bloomberg

          To stay updated on all economic events of today, please check out our Economic calendar
          Risk Warnings and Disclaimers
          You understand and acknowledge that there is a high degree of risk involved in trading. Following any strategies or investment methods may lead to potential losses. The content on the site is provided by our contributors and analysts for information purposes only. You are solely responsible for determining whether any trading assets, securities, strategy, or any other product is suitable for investing based on your own investment objectives and financial situation.
          Add to Favorites
          Share

          U.S.-China Trade Tensions Resurface: Volatility Surges, Long-Term Rivalry Continues

          Pepperstone

          Economic

          Forex

          Over the past week, U.S.-China trade tensions escalated once more, heightening policy uncertainty and increasing market volatility.

          On one side, China's Ministry of Commerce announced further restrictions on exports of rare earths, lithium batteries, and other critical materials, adding more companies to the “unreliable entities list” and expanding export controls to cover rare earth materials, key equipment, and lithium batteries. On the other side, the U.S. government threatened to impose an additional 100% tariff on Chinese goods and plans to restrict exports of critical software and aircraft components starting November 1.

          Within just a few days, both sides acted swiftly and decisively, alternating between signaling willingness to negotiate and applying pressure. This made it difficult for traders to accurately price in the potential market impact of the U.S.-China standoff.

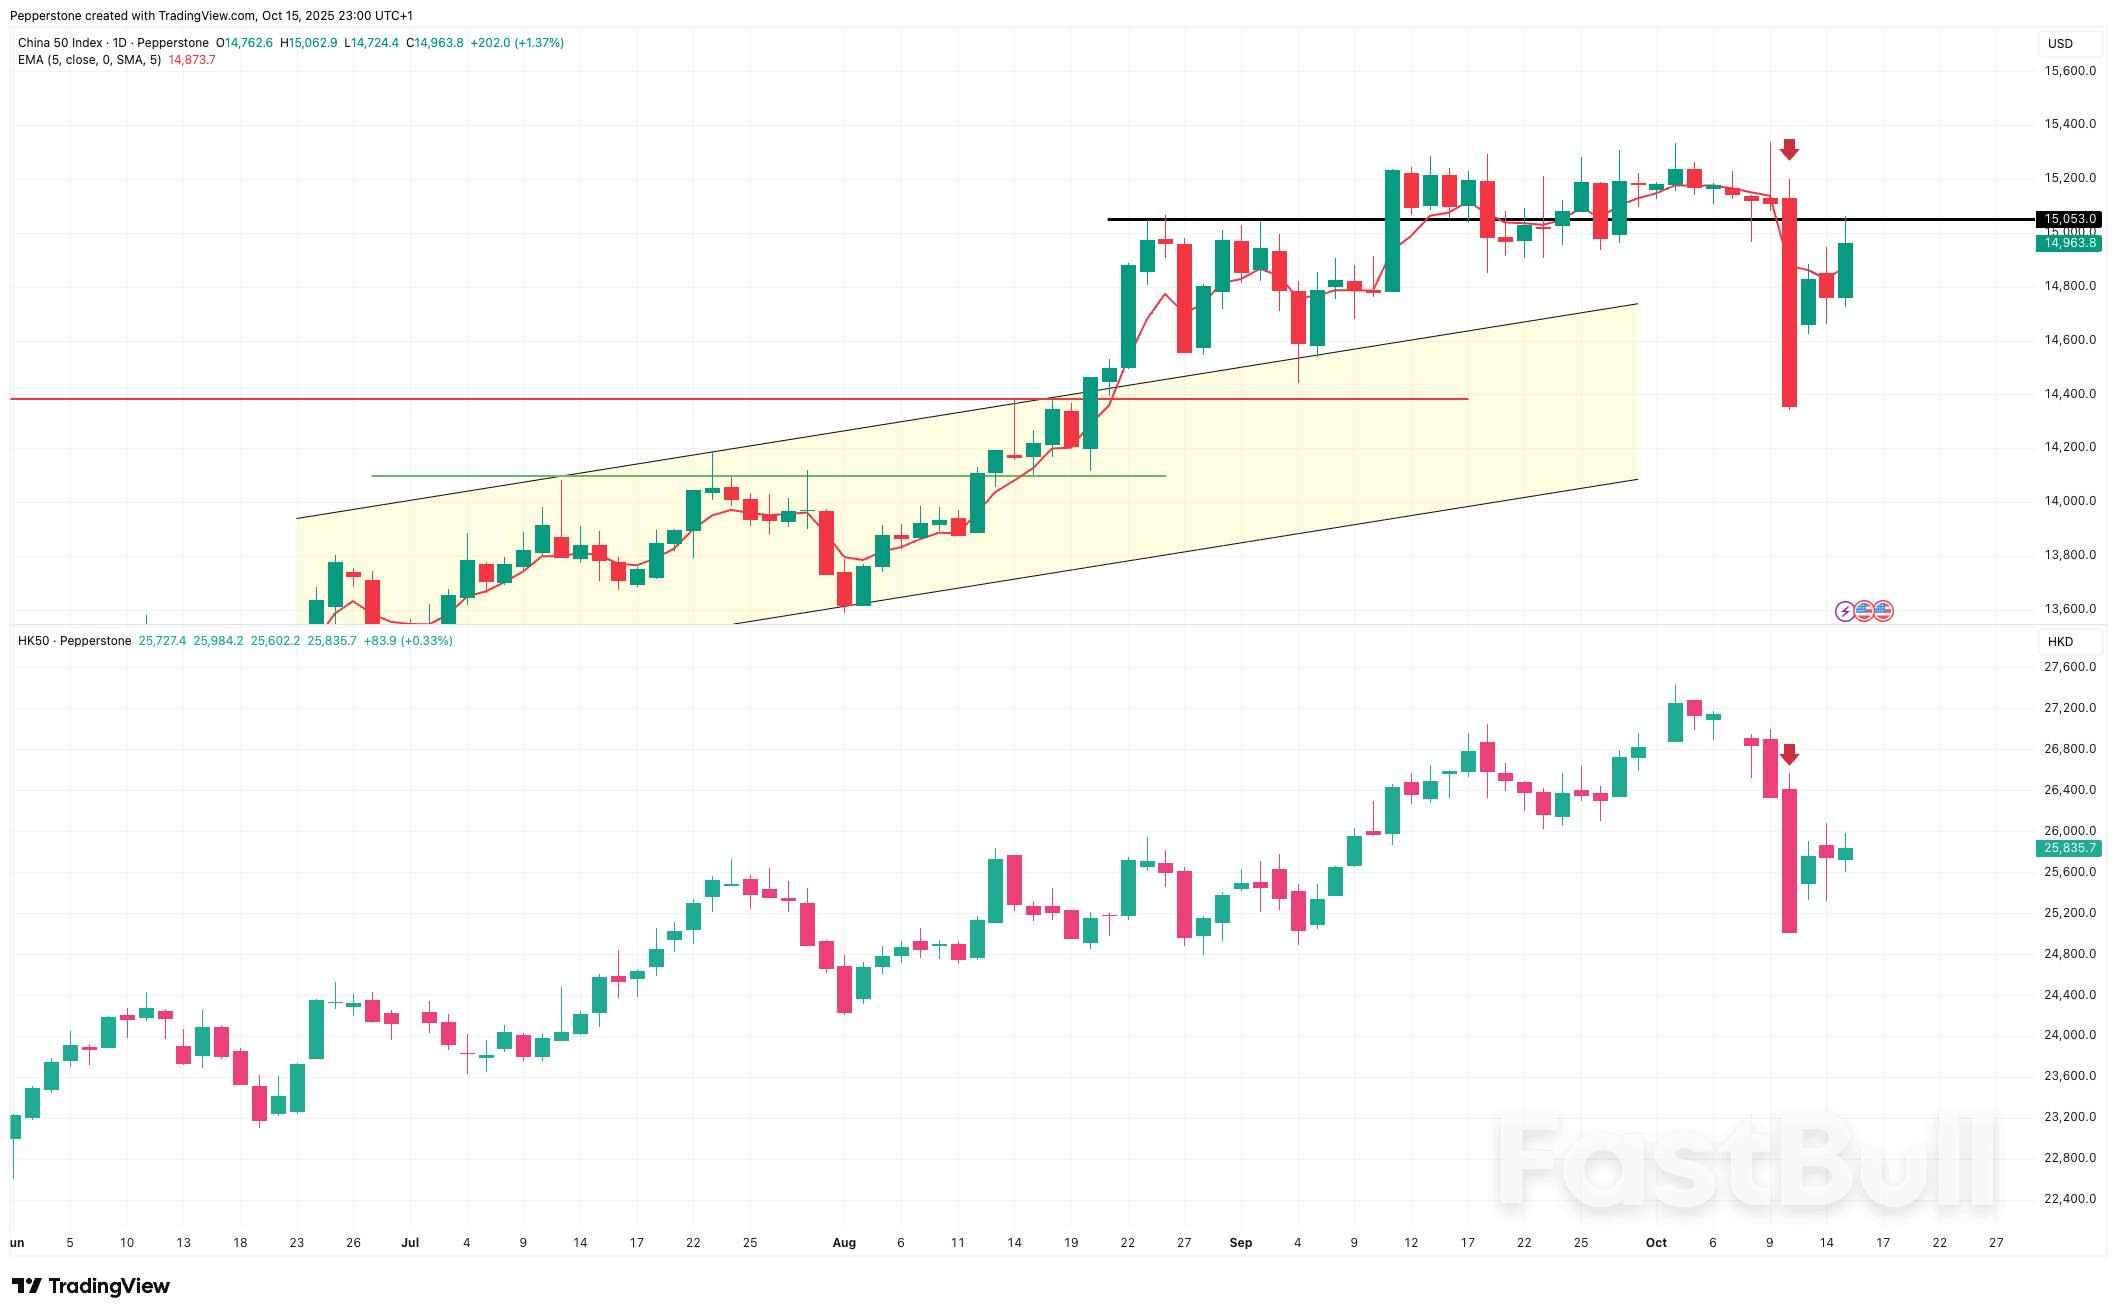
          Global risk assets came under broad pressure, with the CN50 and Hang Seng Index (HK50) both falling nearly 5% on the day the tariffs were announced. Although investor sentiment in other Asia-Pacific markets, such as Japan and Australia, has since stabilized and partially recovered from the tariff-induced pullback, stocks in mainland China and Hong Kong remain mixed.

          Chinese market participants are processing the news flow while closely monitoring several key questions: Will these tariffs and export restrictions actually be implemented? If so, what impact could they have on China's economy and capital markets? And which upcoming events or potential risks should investors pay attention to?

          Export Controls in Focus, Technological Independence Urgent

          Compared with the tariffs announced by the U.S. in April, the latest round of U.S.-China frictions shows significant shifts.

          First, the dispute has moved from traditional tariffs to export controls and technology restrictions, particularly in rare earths and high-tech sectors. China controls approximately 70%-80% of global rare earth mining and around 90% of refining and processing capacity. This round of restrictions targets not only raw material exports but also key equipment and processing technology.

          While the U.S. can seek alternative supplies from countries like Brazil, India, and Australia, fully compensating for China's production gap would take significant time. A 2010 precedent—China's two-month rare earth export ban on Japan—took nearly five years for Japan to partially offset the supply shortfall, highlighting the strategic leverage inherent in rare earth controls.

          Similarly, U.S. restrictions on exporting high-end chips to China make technological independence increasingly urgent. Accelerating domestic development of semiconductors and AI chips is not only a necessary step to mitigate supply risks but also strengthens China's bargaining position in tariff and trade negotiations.

          Political factors have also added complexity to this round of talks. Ongoing U.S. government shutdown risks and the Supreme Court's pending ruling on IEEPA tariffs could reduce administrative efficiency and delay policy implementation, complicating negotiations further.

          China Market: Short-Term Impact Contained, Supply Chain Resilience Evident

          Even if the proposed 100% tariffs and export restrictions were fully implemented, the direct impact on China's macroeconomy may be less severe than some market expectations suggest.

          From a trade perspective, while China's effective tariffs are already approaching 40%, diversification of export markets provides a buffer. In September 2025, China's exports to the U.S. fell 27% year-on-year, marking six consecutive months of decline, yet exports to ASEAN, the EU, and Japan rebounded significantly.

          With trade increasingly shifting toward regional partners and emerging markets, China's external demand structure is gradually reshaping. Trade diversion, combined with potential policy offsets from Chinese authorities, should help mitigate the negative effects of U.S. tariffs.

          At a deeper level, this round of friction is not just about tariff rates or export volumes; it is a contest over technological leadership, supply chain control, and global institutional influence.

          Critical materials like rare earths hold strategic positions in global supply chains, giving China an irreplaceable advantage. Restricting exports may raise short-term downstream costs but simultaneously enhances China's leverage in negotiations.

          In addition, U.S. software exports to China account for just 5.8% of total exports in 2024, limiting overall impact. Facing U.S. restrictions on high-end equipment and semiconductors, China's ongoing push for domestic substitutes and technological autonomy is gradually closing the gap while strengthening supply chain resilience.

          Overall, short-term frictions may raise risk premiums, increase capital outflow pressures, and heighten expectations of RMB depreciation. Industries such as technology, semiconductors, electronics, and machinery—especially small and medium-sized enterprises—may bear the initial brunt, with some companies possibly accelerating shipments to avoid tariffs.

          Nevertheless, China's relatively ample foreign exchange reserves, flexible exchange rate management, and solid fiscal tools should help stabilize market sentiment and ease short-term volatility.

          Limited Probability of Tariff Implementation, Focus on Quantifiable Issues

          Despite the continuous news flow, the likelihood of these tariffs being fully implemented remains low.

          President Trump's well-known “TACO Strategy” involves escalating tariff threats and issuing vague statements to create a high-pressure negotiation environment, signaling to other economies that the U.S. is willing to endure short-term pain for long-term gains. China, meanwhile, seeks to condemn and retaliate while signaling to markets that it will not compromise. Their interactions have largely been a credibility game, where political signaling often outweighs immediate economic impact.

          Domestic political uncertainty in the U.S. is the biggest obstacle to implementing these tariffs, with government shutdowns and compliance risks limiting practical execution. In contrast, China has more flexibility to respond with countermeasures, and this timing gap reduces the feasibility of fully implementing U.S. tariffs.

          The APEC summit and planned U.S.-China presidential meetings remain on schedule, and the new tariffs proposed by the White House are not expected to take effect until November, leaving room and time for negotiations.

          In the short term, discussions are likely to focus on quantifiable issues such as trade balance, tariff levels, export controls, and exchange rate fluctuations. The U.S. may push China to increase agricultural purchases and U.S. investments while pressing on issues like fentanyl; China could respond strategically by slowing the pace of foreign investment reforms.

          Over a longer horizon, U.S.-China relations are likely to oscillate between temporary truce and ongoing negotiations. For the U.S., short-term pauses help ease domestic political and market pressures while retaining leverage for future action. For China, they stabilize external conditions, alleviate economic pressure, and provide breathing space for domestic reforms.

          Breaking this cyclical deadlock ultimately depends on building verifiable mechanisms of trust. Setting concrete execution checkpoints to verify commitments, using temporary compromises to gain negotiation space, and gradually establishing reciprocal expectations could open new avenues for bilateral relations. This approach mirrors the framework of the 2019–2020 interim agreements and may again serve as a practical reference for current negotiations.

          Rising Market Volatility: Balancing Defense and Opportunity

          Overall, with temporary agreements becoming part of U.S.-China trade friction, such tensions are likely to represent a recurring feature of bilateral competition. Both sides use policy tools to signal positions and gain bargaining leverage, but the market impact ultimately hinges on the balance between “deterrence” and “executability.”

          Market volatility is inevitable amid this strategic game. In the near term, key points to watch include the leaders' planned meeting in South Korea at the end of the month and the U.S. Supreme Court's IEEPA tariff ruling in early November. Both sides are sending negotiation signals; if tensions ease, risk sentiment could improve, and China-Hong Kong stocks, supported by technology and AI sectors, may show more stable gains.

          In the face of short-term uncertainty, market participants may consider balancing defensive and opportunistic approaches.

          Defensively, attention can be given to export-oriented companies, raw materials, and critical supply chain nodes to reduce short-term volatility risks. Maintaining adequate liquidity, managing exposure to firms heavily reliant on U.S. exports, and hedging systemic risks are also prudent. Close monitoring of foreign exchange and interest rate markets can help respond to potential RMB depreciation pressures.

          On the opportunity side, investors may focus on growth prospects arising from technology upgrades, industrial substitution, and long-term structural reforms. High-quality targets in domestic substitution chains—such as semiconductor equipment, upstream materials, and core components for new energy—could benefit from both policy support and growing demand.

          Source: Pepperstone

          To stay updated on all economic events of today, please check out our Economic calendar
          Risk Warnings and Disclaimers
          You understand and acknowledge that there is a high degree of risk involved in trading. Following any strategies or investment methods may lead to potential losses. The content on the site is provided by our contributors and analysts for information purposes only. You are solely responsible for determining whether any trading assets, securities, strategy, or any other product is suitable for investing based on your own investment objectives and financial situation.
          Add to Favorites
          Share

          U.S. Bank Earnings Soar, Offsetting Trade War Jitters as Markets Rally

          Gerik

          Economic

          Wall Street Cheers Bank Profits as Trade War Tensions Simmer

          U.S. financial markets got a confidence boost this week as Bank of America and Morgan Stanley joined JPMorgan and Goldman Sachs in delivering stellar Q2 2025 earnings, far surpassing analyst forecasts. This strong performance, fueled by a surge in dealmaking and stock market momentum, helped push the S&P 500 and Nasdaq Composite upward, while the Russell 2000 hit a fresh record. The market rally indicates that despite concerns over rising costs from tariffs and persistent U.S.-China tensions, investors remain optimistic about the resilience of the U.S. economy.
          This upbeat sentiment comes as U.S. Federal Reserve’s Beige Book confirmed that many firms are facing elevated import costs due to tariffs, with some businesses passing those costs on to consumers while others try to remain competitive by holding prices steady. Yet, corporate profitability especially in the banking sector has not only held firm but exceeded expectations.

          White House to Impose Price Floors Amid China’s Rare Earth Dominance

          In a strategic move to combat what it deems China's “nonmarket economy,” U.S. Treasury Secretary Scott Bessent announced that the Trump administration will enforce price floors across key industries. This industrial policy will act as a government-backed pricing mechanism, ensuring that U.S. producers aren’t undercut by China's aggressive price-slashing particularly in sectors like rare earth elements, critical to high-tech and defense applications.
          Bessent explicitly rejected the idea that a stock market dip would cause a U.S. policy shift toward China, reinforcing a hardline stance even as the trade environment intensifies. The Treasury also recently finalized a $20 billion currency swap with Argentina, signaling broader financial diplomacy alongside protectionist industrial strategy.

          India’s Shift on Russian Oil Adds Another Layer to Energy Markets

          President Donald Trump further fueled market discussion by revealing that India will gradually stop buying Russian oil, based on a recent conversation with Prime Minister Narendra Modi. Although no official timeline was provided, such a move could tighten global oil supply, with Brent already rebounding from five-month lows. The announcement also came as Western nations expand sanctions on companies handling Russian energy, including Indian refiner Nayara Energy.
          India's redirection of oil sourcing coupled with its trade ambitions with the U.S. may further reinforce diplomatic ties, especially as it eyes an additional $15 billion in U.S. oil imports.

          Small-Cap Stocks and AI Water Concerns: A Tale of Two Trends

          While small-cap stocks (Russell 2000) continue to rally and attract attention from bullish investors, another issue gaining traction is the environmental impact of AI infrastructure. Across Southern Europe, water-stressed regions are raising concerns about the sustainability of mega AI projects, as data centers require massive water volumes to cool down.
          This rising awareness of AI’s hidden environmental costs could spark policy responses in the EU and encourage innovation in greener data solutions, adding another layer of complexity to the rapidly expanding artificial intelligence economy.
          Despite rising protectionism, ongoing trade disputes, and environmental headwinds, global markets remain largely unfazed, supported by strong corporate earnings, investor confidence, and resilient small-cap momentum. However, the path forward remains contingent on upcoming earnings from tech giants like Tesla and Intel, the evolving U.S.-China standoff, and the ability of governments to manage both geopolitical risk and environmental sustainability in an AI-driven world.

          Source: CNBC

          To stay updated on all economic events of today, please check out our Economic calendar
          Risk Warnings and Disclaimers
          You understand and acknowledge that there is a high degree of risk involved in trading. Following any strategies or investment methods may lead to potential losses. The content on the site is provided by our contributors and analysts for information purposes only. You are solely responsible for determining whether any trading assets, securities, strategy, or any other product is suitable for investing based on your own investment objectives and financial situation.
          Add to Favorites
          Share

          TSMC Profit Soars Nearly 40% on AI Demand Surge, Defying Trade Tensions

          Gerik

          Economic

          Stocks

          TSMC Reports Record Profit as AI Boom Drives Demand

          Taiwan Semiconductor Manufacturing Co. (TSMC), the world’s largest chip foundry, announced on Thursday that its net profit jumped nearly 40% year-on-year in the third quarter of 2025, reaching NT$452.3 billion ($15 billion). This significantly beat analysts’ expectations and highlights the company’s central role in the global semiconductor supply chain, particularly amid the explosive growth of AI technologies.
          The company’s 30% revenue increase year-over-year was largely fueled by surging demand for advanced chips used in artificial intelligence applications, especially those powering large language models, high-performance computing, and cloud infrastructure.

          AI Demand Resilience Supports TSMC's Global Expansion

          Morningstar analysts noted that TSMC’s products remain in high demand and see little risk of disruption even amid mounting geopolitical uncertainties. The firm’s deep technological lead, particularly in advanced nodes such as 3nm and 5nm, makes it indispensable to top-tier customers like Apple and Nvidia, both of which are aggressively expanding their AI product lines.
          “Demand for TSMC’s products is unyielding,” Morningstar stated, affirming that the AI wave is providing long-term structural support for the company’s financial performance.
          TSMC’s growing dominance in AI-related semiconductor production has helped shield it from the volatility of broader economic conditions and trade policy shifts.

          Strategic Investments to Diversify Away from Geopolitical Risk

          To mitigate exposure to geopolitical disruptions particularly in light of ongoing U.S.-China trade tensions TSMC has accelerated international capacity expansion, especially in the United States and Japan.
          The company has committed a total of $165 billion in U.S. investments, including its new chip fabrication plants in Arizona, which are slated to serve critical American customers and secure access to U.S. subsidies under the CHIPS Act. These plants also serve as a hedge against any future tariff or export control risks targeting Taiwan-based production.
          Meanwhile, U.S. Commerce Secretary Howard Lutnick recently proposed a 50-50 production split between Taiwan and the U.S., an idea firmly rejected by Taiwan. Still, the scale of TSMC’s overseas investment signals a pragmatic strategy to localize production without compromising its Taiwan-based leadership.

          AI Boom Shields TSMC from Volatility, Fuels Global Strategy

          TSMC’s robust earnings underscore its strategic position at the heart of the global tech ecosystem. As artificial intelligence continues to reshape hardware demand, TSMC’s advanced node technologies, diversified manufacturing base, and deep integration with leading global clients offer it both resilience and upside.
          Even amid geopolitical headwinds and calls for supply chain reshoring, the company is navigating challenges through calculated expansion and unmatched technological capabilities. With AI demand expected to remain strong, TSMC is positioned to continue its growth trajectory well into 2026 and beyond.

          Source: AP

          To stay updated on all economic events of today, please check out our Economic calendar
          Risk Warnings and Disclaimers
          You understand and acknowledge that there is a high degree of risk involved in trading. Following any strategies or investment methods may lead to potential losses. The content on the site is provided by our contributors and analysts for information purposes only. You are solely responsible for determining whether any trading assets, securities, strategy, or any other product is suitable for investing based on your own investment objectives and financial situation.
          Add to Favorites
          Share

          How to Read Stock Market Charts and Graphs for Beginners

          Winkelmann

          Stocks

          How to Read Stock Market Charts and Graphs: A Simple Guide for New Investors

          Learning how to read stock market charts and graphs helps investors identify trends, analyze price action, and make informed decisions.

          Part 1: Common Types of Stock Market Charts

          Stock charts display how a stock’s price changes over time. Each chart type presents data differently, helping investors spot momentum, volatility, and turning points.

          Line Chart

          Connects closing prices across time, offering a clean view of overall direction. Ideal for beginners learning how to read charts in the stock market.

          Bar Chart (OHLC)

          Shows open, high, low, and close for each period. The vertical bar reflects the full range, while left/right ticks mark open/close. Useful for gauging volatility and intraperiod sentiment.

          Candlestick Chart

          Visualizes the same OHLC data with colored bodies and wicks, revealing market psychology. Great for recognizing momentum, reversals, and continuation signals (how to read candle chart in stock market).

          Point & Figure Chart

          Ignores time and focuses on price movement only, filtering noise and highlighting breakouts and long-term trend structure.

          Key Elements of Stock Charts

          • OHLC: Open, High, Low, Close define each period’s price action.
          • Trendlines: Connect swing highs/lows to reveal direction and strength.
          • Support & Resistance: Price zones where demand or supply often shifts.
          • Volume: Confirms the strength behind price moves.
          • Timeframe: From minutes to months; choose based on strategy.

          Common Chart Patterns

          • Head and Shoulders: Often signals a trend reversal.
          • Double Top / Double Bottom: Reversal after failed break attempts.
          • Triangles (Ascending / Descending / Symmetrical): Consolidation before breakout.
          • Cup and Handle: Bullish continuation pattern after a rounded base.

          Part 2: Key Indicators Used in Stock Chart Analysis

          Understanding key indicators is essential when learning how to read stock market charts and graphs. These indicators help investors evaluate trend strength, momentum, and potential reversals in the market.

          1. Moving Averages (MA)

          The moving average smooths price data over a specific period, showing the average value of a stock’s price. It helps identify the overall trend direction — if prices stay above the MA, the market is bullish; below means bearish.

          • Simple Moving Average (SMA): Equal weighting for all data points in the period.
          • Exponential Moving Average (EMA): Gives more importance to recent data for quicker trend signals.
          • Golden Cross / Death Cross: When short-term and long-term MAs cross, signaling trend reversals.

          2. Relative Strength Index (RSI)

          RSI measures price momentum on a scale of 0 to 100, helping identify overbought or oversold conditions. A reading above 70 often means overbought, while below 30 indicates oversold. When analyzing how to read a stock market chart, RSI offers insight into market psychology and timing.

          3. Moving Average Convergence Divergence (MACD)

          The MACD indicator tracks the relationship between two exponential moving averages to show momentum shifts. When the MACD line crosses above the signal line, it’s a bullish signal; when below, it’s bearish.

          4. Volume

          Volume measures how many shares are traded during a given period. When price moves with rising volume, it confirms the strength of that move. This is critical in how to read charts in stock market analysis since it validates breakouts or reversals.

          5. Bollinger Bands

          Bollinger Bands use a moving average with upper and lower bands based on standard deviations. When prices touch the upper band, assets may be overbought; when near the lower band, oversold. It’s a visual way to measure volatility and extremes in how to read candle chart in stock market analysis.

          6. Fibonacci Retracement

          This tool helps identify potential support and resistance levels by dividing a major price move into key ratios (23.6%, 38.2%, 61.8%). Traders use it to predict pullbacks and continuation points.

          7. Trendlines and Channels

          Drawing trendlines helps visualize the market direction. Parallel trendlines form price channels that signal the boundaries of price movement. They’re often combined with indicators for confirmation.

          Part 3: How to Read Stock Market Charts and Graphs

          Learning how to read stock market charts and graphs helps investors interpret price trends, market sentiment, and entry or exit signals. Whether you use a line chart, bar chart, or candlestick chart, understanding each format allows you to visualize the balance between buyers and sellers.

          How to Read a Line Chart

          A line chart is the simplest way to view price movements over time. It connects the closing prices of each trading period with a continuous line, giving a clear picture of the overall trend.

          How to Read Stock Market Charts and Graphs for Beginners_1

          • Upward slope: Indicates a bullish trend (price increasing over time).
          • Downward slope: Signals a bearish trend (declining price).
          • Sideways line: Reflects consolidation or market indecision.

          Line charts are ideal for investors who want to see the “big picture” of a stock’s performance without short-term noise. When learning how to read a stock market chart, this is often the first step toward understanding broader trends.

          How to Read a Bar Chart

          A bar chart (also called an OHLC chart) shows more detail by including the open, high, low, and close prices within each period. Each vertical bar represents the trading range, while small ticks on either side show opening and closing prices.

          How to Read Stock Market Charts and Graphs for Beginners_2

          • Left tick: Opening price.
          • Right tick: Closing price.
          • Top and bottom: Highest and lowest prices for that session.

          When the close is higher than the open, it reflects bullish momentum; when it’s lower, bearish momentum. Bar charts are useful for seeing volatility and range strength — key for those studying how to read charts in stock market for active trading.

          How to Read a Candlestick Chart

          Candlestick charts are the most popular and powerful visualization for traders. Each “candle” represents one trading session and includes four data points: open, high, low, and close — similar to bar charts but more visual.

          How to Read Stock Market Charts and Graphs for Beginners_3

          • Green or hollow candle: Closing price is higher than opening (bullish).
          • Red or filled candle: Closing price is lower than opening (bearish).
          • Wicks or shadows: Represent intraday price extremes.

          When learning how to read candle chart in stock market, focus on body size and wick length — long bodies show strong moves, while long wicks signal market indecision or reversals.

          Common patterns include:

          • Doji: Signals indecision, often before reversals.
          • Hammer: Appears after a downtrend, suggesting a possible bottom.
          • Engulfing Pattern: Indicates a strong reversal in sentiment.

          How to Combine Indicators and Patterns

          Reading charts isn’t just about recognizing shapes — it’s about context. Combine technical indicators with visual patterns to confirm trends and improve accuracy.

          • Combine Moving Averages with Candlestick Patterns: For example, a bullish engulfing candle above the 50-day MA can signal strong trend continuation.
          • Use RSI with Support/Resistance: If RSI shows oversold while price touches support, it strengthens the buy signal.
          • Volume Confirmation: Rising volume validates price breakouts or breakdowns.

          Understanding how to integrate these tools is the key to mastering how to read stock market charts and graphs effectively for real-world investing or trading decisions.

          FAQs about How to Read Stock Market Charts and Graphs

          1. How to understand chart patterns in stock market?

          Chart patterns reveal market psychology. Shapes like triangles, double tops, and head-and-shoulders indicate trend continuation or reversal. Understanding them helps predict price behavior.

          2. What's the best chart pattern for beginners?

          Beginners can start with simple patterns such as trendlines, support and resistance zones, or candlestick formations like hammers and dojis—they are easy to spot and reliable.

          3. How often should I check stock charts?

          Long-term investors can review weekly or daily charts, while active traders may monitor hourly charts for faster signals and short-term trends.

          Conclusion

          Mastering how to read stock market charts and graphs helps investors spot opportunities, manage risk, and make smarter, data-driven trading decisions.

          Risk Warnings and Disclaimers
          You understand and acknowledge that there is a high degree of risk involved in trading. Following any strategies or investment methods may lead to potential losses. The content on the site is provided by our contributors and analysts for information purposes only. You are solely responsible for determining whether any trading assets, securities, strategy, or any other product is suitable for investing based on your own investment objectives and financial situation.
          Add to Favorites
          Share

          Dollar Drops Versus Euro, Rises Slightly Against Yen, China's Rare Earths in Focus

          Glendon

          Economic

          Forex

          (Oct 16): The US dollar headed for a third straight daily loss against the euro while edging up versus the yen on Thursday, as concerns over US-China tensions and dovish remarks from Federal Reserve officials continued to weigh on sentiment.

          Analysts say political headwinds have weighed on the yen but expect support to come from looming Fed rate cuts, the end of US quantitative tightening, and a potential rise in market volatility, which usually supports safe-haven assets.

          US Treasury yields hovered near multi-week lows, with the benchmark 10-year just above 4%, pressuring the dollar as investors also weighed a prolonged US government shutdown.

          The Fed’s Beige Book released Thursday offered little support to US rates, pointing to emerging signs of economic weakness, including rising layoffs and reduced spending among middle- and lower-income households. Fed Governor Stephen Miran said on Wednesday cutting rates is now more important.

          The dollar index, which measures the greenback against six other currencies, was down 0.05% at 98.63, and was on track for a weekly decline of around 0.3%.

          Rare earths in focus

          Investors were scrutinising China’s latest expansion of rare earth export controls, a move sharply criticised by senior US officials on Wednesday, who warned that it could disrupt global supply chains.

          "The question for financial markets is whether China's proposed export controls on rare earths are merely part of a bargaining ploy to achieve greater concessions from the US," said Chris Turner, global head of markets at ING.

          Amid the tit-for-tat action, US President Donald Trump still expects to meet Chinese President Xi Jinping in South Korea this month, US Treasury Secretary Scott Bessent said.

          "An extension, rather than a grand bargain that settles all trade issues, is probably the most realistic second-best outcome compared to the alternative of escalation of retaliation," said Joseph Capurso, head of foreign exchange at Commonwealth Bank of Australia.

          The Australian dollar was flat at US$0.6511 after data showed unemployment hit a near four-year high in September, adding to the case for interest rate cuts.

          The Aussie, often considered a proxy for risk appetite, has been volatile this week due to the trade tension as traditional havens gained.

          China's yuan firmed to a two-week high against the US dollar on Thursday after the central bank set its strongest daily midpoint in a year.

          French political drama in the background

          The euro touched a one-week high and was up 0.10% at US$1.1656 as traders braced for yet another episode in the French political drama, with Prime Minister Sebastien Lecornu likely to survive two no-confidence votes in parliament.

          France's political crisis has barely affected euro zone sovereign bond markets as investors see no room for a selloff in French bonds without snap elections.

          However, by shelving pension reform until after 2027, France’s prime minister has managed to defuse a sharp escalation in the crisis, though at the cost of complicating efforts to rein in public finances, analysts said.

          The yen briefly firmed to a one-week high of 150.51 per dollar but was up 0.05% at 151.11. Japan's weakened Liberal Democratic Party is set to begin policy talks with the right-leaning Innovation Party on Thursday that could help Sanae Takaichi clinch a prime ministerial vote expected next week.

          "Regardless of the outcome of the prime ministerial election, it is highly likely that the market will price in some expansionary fiscal policies," said Shinichiro Kadota, head of Japan forex and rates strategy at Barclays Tokyo.

          "We remain long on the US dollar versus the yen given the risk of a further rally but with eyes on an eventual intervention risk or Bank of Japan hike if the move extends."

          Source: Theedgemarkets

          To stay updated on all economic events of today, please check out our Economic calendar
          Risk Warnings and Disclaimers
          You understand and acknowledge that there is a high degree of risk involved in trading. Following any strategies or investment methods may lead to potential losses. The content on the site is provided by our contributors and analysts for information purposes only. You are solely responsible for determining whether any trading assets, securities, strategy, or any other product is suitable for investing based on your own investment objectives and financial situation.
          Add to Favorites
          Share
          FastBull
          Copyright © 2025 FastBull Ltd

          728 RM B 7/F GEE LOK IND BLDG NO 34 HUNG TO RD KWUN TONG KLN HONG KONG

          TelegramInstagramTwitterfacebooklinkedin
          App Store Google Play Google Play
          Products
          Charts

          Chats

          Q&A with Experts
          Screeners
          Economic Calendar
          Data
          Tools
          Membership
          Features
          Function
          Markets
          Copy Trading
          Latest Signals
          Contests
          News
          Analysis
          24/7
          Columns
          Education
          Company
          Careers
          About Us
          Contact Us
          Advertising
          Help Center
          Feedback
          User Agreement
          Privacy Policy
          Business

          White Label

          Data API

          Web Plug-ins

          Poster Maker

          Affiliate Program

          Risk Disclosure

          The risk of loss in trading financial instruments such as stocks, FX, commodities, futures, bonds, ETFs and crypto can be substantial. You may sustain a total loss of the funds that you deposit with your broker. Therefore, you should carefully consider whether such trading is suitable for you in light of your circumstances and financial resources.

          No decision to invest should be made without thoroughly conducting due diligence by yourself or consulting with your financial advisors. Our web content might not suit you since we don't know your financial conditions and investment needs. Our financial information might have latency or contain inaccuracy, so you should be fully responsible for any of your trading and investment decisions. The company will not be responsible for your capital loss.

          Without getting permission from the website, you are not allowed to copy the website's graphics, texts, or trademarks. Intellectual property rights in the content or data incorporated into this website belong to its providers and exchange merchants.

          Not Logged In

          Log in to access more features

          FastBull Membership

          Not yet

          Purchase

          Become a signal provider
          Help Center
          Customer Service
          Dark Mode
          Price Up/Down Colors

          Log In

          Sign Up

          Position
          Layout
          Fullscreen
          Default to Chart
          The chart page opens by default when you visit fastbull.com