

Markets
News
Analysis
User
24/7
Economic Calendar
Education
Data
- Names
- Latest
- Prev


Signal Accounts for Members
All Signal Accounts
All Contests
 France Trade Balance (SA) (Oct)
A:--
F: --
 Euro Zone Employment YoY (SA) (Q3)
A:--
F: --
 Canada Part-Time Employment (SA) (Nov)
A:--
F: --
P: --
Canada Unemployment Rate (SA) (Nov)A:--
F: --
P: --
Canada Full-time Employment (SA) (Nov)A:--
F: --
P: --
Canada Labor Force Participation Rate (SA) (Nov)A:--
F: --
P: --
Canada Employment (SA) (Nov)A:--
F: --
P: --
 U.S. PCE Price Index MoM (Sept)
A:--
F: --
P: --
U.S. Personal Income MoM (Sept)A:--
F: --
P: --
U.S. Core PCE Price Index MoM (Sept)A:--
F: --
P: --
U.S. PCE Price Index YoY (SA) (Sept)A:--
F: --
P: --
U.S. Core PCE Price Index YoY (Sept)A:--
F: --
P: --
U.S. Personal Outlays MoM (SA) (Sept)A:--
F: --
U.S. 5-10 Year-Ahead Inflation Expectations (Dec)A:--
F: --
P: --
U.S. Real Personal Consumption Expenditures MoM (Sept)A:--
F: --
U.S. Weekly Total Rig CountA:--
F: --
P: --
U.S. Weekly Total Oil Rig CountA:--
F: --
P: --
U.S. Consumer Credit (SA) (Oct)A:--
F: --
 China, Mainland Foreign Exchange Reserves (Nov)
A:--
F: --
P: --
 Japan Trade Balance (Oct)
A:--
F: --
P: --
Japan Nominal GDP Revised QoQ (Q3)A:--
F: --
P: --
China, Mainland Imports YoY (CNH) (Nov)A:--
F: --
P: --
China, Mainland Exports (Nov)A:--
F: --
P: --
China, Mainland Imports (CNH) (Nov)A:--
F: --
P: --
China, Mainland Trade Balance (CNH) (Nov)A:--
F: --
P: --
China, Mainland Exports YoY (USD) (Nov)A:--
F: --
P: --
China, Mainland Imports YoY (USD) (Nov)A:--
F: --
P: --
 Germany Industrial Output MoM (SA) (Oct)
A:--
F: --
Euro Zone Sentix Investor Confidence Index (Dec)A:--
F: --
P: --
Canada National Economic Confidence IndexA:--
F: --
P: --
 U.K. BRC Like-For-Like Retail Sales YoY (Nov)
--
F: --
P: --
U.K. BRC Overall Retail Sales YoY (Nov)--
F: --
P: --
 Australia Overnight (Borrowing) Key Rate
--
F: --
P: --
RBA Rate Statement RBA Press Conference Germany Exports MoM (SA) (Oct)--
F: --
P: --
U.S. NFIB Small Business Optimism Index (SA) (Nov)--
F: --
P: --
 Mexico 12-Month Inflation (CPI) (Nov)
--
F: --
P: --
Mexico Core CPI YoY (Nov)--
F: --
P: --
Mexico PPI YoY (Nov)--
F: --
P: --
U.S. Weekly Redbook Index YoY--
F: --
P: --
U.S. JOLTS Job Openings (SA) (Oct)--
F: --
P: --
China, Mainland M1 Money Supply YoY (Nov)--
F: --
P: --
China, Mainland M0 Money Supply YoY (Nov)--
F: --
P: --
China, Mainland M2 Money Supply YoY (Nov)--
F: --
P: --
U.S. EIA Short-Term Crude Production Forecast For The Year (Dec)--
F: --
P: --
U.S. EIA Natural Gas Production Forecast For The Next Year (Dec)--
F: --
P: --
U.S. EIA Short-Term Crude Production Forecast For The Next Year (Dec)--
F: --
P: --
EIA Monthly Short-Term Energy Outlook U.S. API Weekly Gasoline Stocks--
F: --
P: --
U.S. API Weekly Cushing Crude Oil Stocks--
F: --
P: --
U.S. API Weekly Crude Oil Stocks--
F: --
P: --
U.S. API Weekly Refined Oil Stocks--
F: --
P: --
 South Korea Unemployment Rate (SA) (Nov)
--
F: --
P: --
Japan Reuters Tankan Non-Manufacturers Index (Dec)--
F: --
P: --
Japan Reuters Tankan Manufacturers Index (Dec)--
F: --
P: --
Japan Domestic Enterprise Commodity Price Index MoM (Nov)--
F: --
P: --
Japan Domestic Enterprise Commodity Price Index YoY (Nov)--
F: --
P: --
China, Mainland PPI YoY (Nov)--
F: --
P: --
China, Mainland CPI MoM (Nov)--
F: --
P: --

No matching data
Latest Views
Latest Views
Trending Topics
Top Columnists
Latest Update
White Label
Data API
Web Plug-ins
Affiliate Program
View All
No data
JPMorgan Chase & Co chief executive officer Jamie Dimon said he expects “a kerfuffle” in the US Treasury market that prompts a Federal Reserve intervention.
“There will be a kerfuffle in the Treasury markets because of all the rules and regulations,” Dimon said Friday on an earnings call. When that happens, the Fed will step in — but not until “they start to panic a little bit,” he added.
Yields, especially on longer-term debt, have jumped this week amid broader market turmoil tied to President Donald Trump’s evolving tariff policy. The moves have raised questions about the debt’s safe haven appeal and stoked fears that hedge funds may be unwinding a pair of popular leveraged trades — one on the price difference between cash Treasuries and futures, and another on the spread between Treasury yields and swap rates.
In March 2020 with Covid engulfing the world, the Treasury market seized up as investors rapidly unwound their positions. The Fed was forced to intervene, pledging to buy trillions of dollars of bonds and providing emergency funding to the repo markets. Dimon said bank rule changes are needed to avoid that happening again.
“When you have a lot of volatile markets and very wide spreads and low liquidity in Treasuries, it affects all other capital markets,” Dimon said. “That’s the reason to do it, not as a favour to the banks.”
One of the speculated changes that Trump administration regulators may pursue is exempting Treasuries from the US banks’ supplementary leverage ratio, allowing firms to buy up more of the debt without a hit to their key capital ratios.
Dimon said the issue is not just with the SLR, and listed a slew of regulations with “deep flaws” that he said required reforms so banks could become more active intermediaries in markets.
“If they do, spreads will come in, there’ll be more active traders,” he said. “If they don’t, the Fed will have to intermediate, which I think is just a bad policy idea.”
The comments build on ones Dimon made this week in his annual shareholder letter. Certain rules treat Treasuries as “far riskier” than they are, he wrote, adding that restrictions on market-making by primary dealers, together with quantitative tightening, will likely lead to much higher volatility in Treasuries.
“These rules effectively discourage banks from acting as intermediaries in the financial markets — and this would be particularly painful at precisely the wrong time: when markets get volatile,” Dimon wrote.
The euro has emerged as a surprising victor in recent market fluctuations, reaching a three-year high against the US dollar as global investors grow increasingly nervous about holding American assets. This remarkable turnaround comes in the wake of President Donald Trump’s new tariff policies, which have triggered significant market turbulence and caused a substantial shift in global investment flows. The euro’s strength has confounded earlier market consensus, which had predicted the currency would weaken below $1 if tariffs were imposed. Instead, the single currency has gained more than 5% against the dollar since April 1, the day before Trump introduced new 10% baseline tariffs on all economies and additional 20% duties specifically targeting the European Union. The currency’s rally has accelerated following Trump’s decision to pause the higher levies for 90 days, fueling the biggest single-day jump in the euro since 2015.
As of 11:13 AM EST on April 11, 2025, the EUR/USD exchange rate stood at 1.1380, representing a daily gain of 1.08%. This follows an even more impressive 2.80% surge on April 10, when the rate closed at 1.1258. The currency pair reached as high as 1.1473 during April 11 trading, marking a substantial rise from its recent low of 1.0732 recorded on March 27, 2025. Over this period, the euro has experienced a remarkable 5.06% jump, with the most dramatic movement occurring between April 9-10 when the euro decisively broke above the psychologically important 1.10 level. This upward momentum builds on gains that started weeks earlier following Germany’s announcement of a massive spending plan, creating a perfect storm of factors supporting the single currency.
The primary driver behind the euro’s unexpected strength is a significant shift in global capital flows. European investors are selling their US assets and bringing money home, with the euro area accounting for the largest share of foreign ownership of US assets by currency. This repatriation pattern is particularly potent given that foreign holdings of US assets had ballooned to $62 trillion in 2024 from just $13 trillion a decade earlier. Unlike traditional safe havens such as the Japanese yen and Swiss franc, the euro typically weakens against the dollar during periods of market stress, making its current performance all the more remarkable. The gap between German and US 10-year bond yields has widened substantially, suggesting growing investor nervousness about US debt. According to ECB policymaker Francois Villeroy de Galhau, Trump’s policies have eroded confidence in the dollar, while some analysts now project the euro could potentially rally to $1.25 if current trends continue.
The euro’s appreciation carries mixed implications for the European economy. On the positive side, increased demand for euro-denominated debt could make it easier for European governments to fund spending initiatives. The stronger euro also provides the European Central Bank with more flexibility to maintain lower interest rates even if tariffs cause inflation to rise. However, analysts warn that becoming a currency of choice could ultimately hurt European exporters who have traditionally benefited from a weaker euro during global economic slowdowns. This concern is particularly relevant as the euro’s strength has been broad-based, hitting a 17-month high versus Britain’s pound and trading around 11-year highs against China’s yuan, pushing it to a record level on a trade-weighted basis. As markets continue to adjust to the new tariff landscape, European policymakers will need to carefully balance these competing economic forces.
The post Euro Surges Against the Dollar Amid Tariff Turbulence appeared first on Tokenist.


Recently, global markets were left stunned by the dramatic swings in U.S. stocks. After plunging sharply on news of “reciprocal tariffs,” the market reversed course and surged when the White House announced a 90-day suspension of tariffs on certain countries. The Dow Jones Industrial Average soared more than 2,900 points, a 7.87% gain — its biggest one-day jump since March 25, 2020. The S&P 500 rallied 9.52%, marking its largest gain since October 29, 2008, while the Nasdaq spiked 12.16%, notching the second-largest single-day gain in its history.
The “Magnificent Seven” tech giants all soared, with their combined market cap increasing by a staggering $1.85 trillion in just a matter of hours.
This kind of rhythm must feel all too familiar. That’s right — it’s the same kind of price action we often see in altcoins. Many market analysts couldn’t help but exclaim: “U.S. stocks are swinging like altcoins. The world is one giant pump-and-dump.”
Yet the surprises from the U.S. didn’t stop there. The March CPI data came in way below expectations: year-on-year growth was just 2.4%, missing forecasts, and the month-on-month figure even dropped by 0.1%. Core CPI was equally disappointing, hitting a four-year low. The unadjusted year-over-year core CPI for March came in at 2.8%, declining for the second straight month and marking the lowest level since March 2021 — falling short of the 3.0% market forecast.
These two sets of data not only defied market expectations but also prompted investors to reassess the Federal Reserve’s policy outlook. The market’s response was swift:
In the face of such data, a significant number of market analysts now believe a Fed rate cut in June is all but certain.
Harriet Torry, an economist at The Wall Street Journal, noted that under normal circumstances, a slowdown in year-over-year CPI growth would be considered welcome news.
Naturally, this also bodes well for the crypto market. As the Fed’s benchmark interest rate retreats, the crypto space could see a fresh wave of value re-evaluation.
The yield on the U.S. 10-year Treasury note has fallen from its 2023 peak of 4.8% to 4.28% (with a recent low of 4.18% before rebounding by 10 basis points in the past few days). Shrinking returns on traditional fixed-income assets have pushed capital toward higher-risk assets. Take Bitcoin as an example — its correlation with Treasury yields was as low as -0.73 in 2023. The opportunity cost of holding crypto assets drops significantly in a rate-cut cycle, thereby increasing their appeal. According to Goldman Sachs models, every 25 basis point rate cut could push Bitcoin’s market cap up by 6–8%.
Bitcoin’s 90-day correlation with gold rose from 0.12 in 2023 to 0.35, peaking at 0.68 during the Silicon Valley Bank crisis. When rate cuts coincide with rising recession risks, the safe-haven value of crypto assets may be re-evaluated. A report by Grayscale points out that a 1% drop in real interest rates could raise Bitcoin’s valuation baseline by 15%.
Historically, Fed rate-cutting cycles are often accompanied by broad-based asset price increases. As liquidity eases and capital costs decline, investor appetite for risk assets grows — this is especially pronounced in the crypto market.
As high-volatility and high-risk instruments, crypto assets are highly sensitive to liquidity shifts. When the Fed signals monetary easing, idle capital tends to chase higher returns, and crypto assets — with their strong return potential — quickly become a focus.
Against expectations of fiat currency debasement, the scarcity premium of fixed-supply cryptocurrencies becomes increasingly prominent. This built-in deflationary feature adds anti-inflation appeal during a rate-cut cycle.
Rate Cuts Amplify the “Asset Shortage” Phenomenon
Lower interest rates reduce yields in traditional financial markets (e.g., bonds, money market funds), creating reallocation pressure for institutions. Long-term investors like insurers, pension funds, and family offices may divert part of their capital toward growth-oriented emerging markets.
With regulatory infrastructure — such as ETFs, custody, and auditing — steadily maturing, crypto assets are becoming increasingly viable for compliant investment. As rate cuts lead to muted returns in traditional markets, institutions are likely to include Bitcoin and Ethereum in diversified portfolios.
Crypto ETFs in Sync with the Rate-Cut Cycle
By the end of 2024, several spot Bitcoin ETFs were approved for listing in the U.S., marking a pivotal moment for institutional money to enter the crypto space openly. If rate cuts coincide with the ETF boom, we could see a dual momentum of institutional inflows and macro liquidity expansion — further amplifying the crypto market’s upside potential.
DeFi Market Reawakens
During the rate-hiking cycle, DeFi platforms struggled to compete with low-risk returns from U.S. Treasuries, leading to a decline in TVL (total value locked). As risk-free yields fall, DeFi returns become more attractive again, drawing capital back in.
Leading protocols like Compound, Aave, and Lido are already showing signs of TVL recovery. As on-chain lending rates stabilize and stablecoin interest spreads widen, capital efficiency improves — enhancing liquidity across the DeFi ecosystem.
NFT and GameFi Markets See Renewed Interest
Rate cuts free up capital, reviving user enthusiasm for high-volatility, high-engagement assets like NFTs and GameFi tokens. Historically, NFT market activity has lagged behind Bitcoin rallies and typically explodes in the second phase of a bull market. Fed rate cuts may open new upside potential for these application-layer assets.
In sum, Fed rate cuts are laying the macro foundation for a new crypto market upcycle. From liquidity injection and capital reallocation to institutional entry, on-chain activity, and financing environments — rate cuts present systematic tailwinds for the crypto sector.
As the Fed opens the liquidity floodgates, crypto assets are evolving from speculative fringe assets into mainstream macro allocation tools. This transformation is being driven by both traditional financial giants and breakthroughs in underlying technology — alongside intense market cleansing and value reconfiguration.
Of course, the market won’t turn overnight. Regulatory clarity, tech infrastructure, and security challenges still need to be addressed. But under the dual engine of “monetary easing + asset innovation,” the crypto market could be poised for a new structural rally in the coming year. For investors and builders alike, understanding the policy cycle and market tempo will be key to navigating both bull and bear.
Van november 2022 tot november 2024 zat de EUR/USD-combinatie ‘geblokkeerd’ tussen 1.0450 en 1.1275. Enter Trump. Aanvankelijk voelde een meerderheid in de markt zich aangesproken door de MAGA-retoriek. Even zag het er naar uit dat EUR/USD helemaal door het ijs zou zakken. De VS had alle troeven: economisch en geopolitiek. Europa was een reus op lemen voeten die door Trump op zowat alle terreinen onderuit kon worden gehaald. (Externe) overschotten waren een nadeel, geen voordeel zo bleek.
Fast forward naar het tijdperk van wederkerige invoertarieven. In twee maanden tijd werd de vermelde handelsband bij het grof huisvuil gezet. Van EUR/USD 1.0140 begin februari schrijven we nu 1.14!. De Trump administratie wil op zich waarschijnlijk wel een zwakkere dollar. Het handelstekort weet je wel. Toch stond het huidige marktscenario waarschijnlijk niet in het plan (als er al een echt plan is natuurlijk). De EUR/USD-opsprong begon in maart als een Europese reflatietrade. Het besef van een te grote afhankelijkheid van de VS duwde Europa/Duitsland weg van fiscale orthodoxie naar investeringen in (militaire) ‘onafhankelijkheid’. Europese rentes, beurzen en de euro veerden op. Midden maart bereikte EUR/USD 1.095. De markt vertrouwde in de (groei)kracht van die Europese tekort-bestedingen, en alvast veel meer dan in het Amerikaanse economisch (tarief)beleid en de dogmatische keuze van niet gefinancierde belastingverminderingen.
Sinds “Liberation Day” zette EUR/USD een nieuwe forse stap hoger van 1.085 tot 1.14. Zonder meer een motie van wantrouwen in de dollar. Trump zette woensdag zijn joker/Trump put in om de ‘Sell America’ trade af te blokken. Niet zozeer om de beursdaling of de USD-daling af te remmen. Wel omdat het anker van het ‘American exceptionalism’ loskomt. Investeerders verliezen het vertrouwen in lange termijn Amerikaanse overheidsobligaties (en dus in de dollar). Hierbij viel gisteren op dat de hernieuwde verkoopdruk in lange Amerikaanse obligaties hand in hand ging met een stijging van Duitse Bunds. De weg is nog lang, maar de markt is op zoek naar een nieuwe veilige haven in het obligatie-universum, weg van de VS.
Waar eindigt dit? Hier nog niet. Zelfs het (volledig) terugdraaien van de handelstarieven is onvoldoende om het vertrouwen te herstellen. Er is ook nog de torenhoge Amerikaanse schuld. Hoe groot is de kans dat Trump fiscaal de tering naar de nering zet en onrealistische belastingverminderingen afblaast? Kort samengevat, de geloofwaardigheid van schuldpapier en de dollar zijn twee kanten van dezelfde medaille. Zolang de rust voor de eerste niet terugkeert, blijft de tweede onder druk staan.
De Fed is hier waarschijnlijk geen deus-ex-machina. Het volstaat deze keer niet om USD liquiditeit in de markt te duwen. De Fed obligaties kopen en daarmee het signaal bevestigen dat de markt alle vertrouwen verloren heeft? Niet evident. Ook aan de andere kant van de USD-vergelijking is hulp niet zo evident. Bij een te snelle daling van USD/JPY wilde de BoJ al wel eens ingrijpen om de te sterke yen af te remmen. Dat is nu niet aan de orde. Uiteraard kan Japan (of een ander land) dit niet oplossen. Bovendien. Wat ga je als CB doen met die USD doen? Beleggen in ‘veilige’ Treasuries? Over China zwijgen we hier sowieso. We zijn ons bewust van de simplistische short-cuts. De boodschap blijft dat de dollar in vrije val dreigt terecht te komen en dat er weinig conventionele mechanismen zijn om dit te stoppen. De technische grafiek zegt dat er nog een kleine weerstand ligt nabij 1.17 alvorens EUR/USD terugkeert richting de top van begin 2021 (1.2344).

As the U.S. braces for the onset of the first-quarter earnings season, the S&P 500 faces its next pivotal moment against the backdrop of a looming trade war and economic uncertainty.
The latest forecasts suggest that S&P 500 earnings will have grown 7.0% year-on-year for the quarter ending March, as per FactSet data.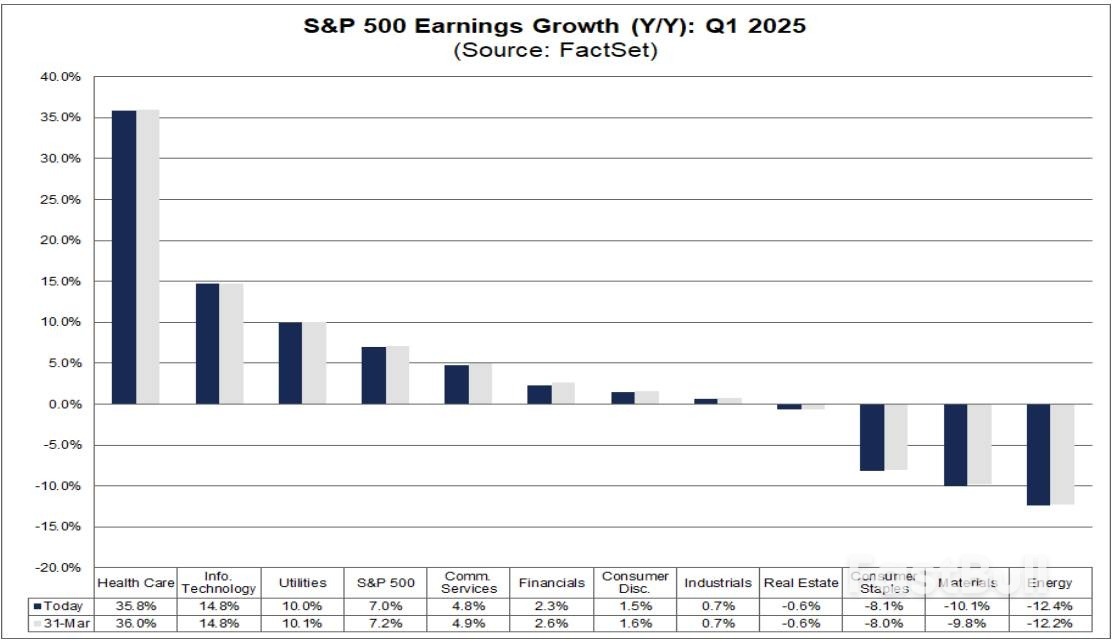
However, the optimism of these figures is tempered by the cloud of tariffs and their potential impact on corporate outlooks. Notably, companies with significant international exposure may face greater challenges, as tariffs can directly affect their supply chains and profit margins.
The earnings season kicks off with major financial institutions set to release their reports. JPMorgan Chase (NYSE:JPM) and Wells Fargo (NYSE:WFC) are scheduled to announce their Q1 earnings on April 11.
The banking sector, often among the first to feel the tremors of economic shifts, will provide an early indicator of how companies are navigating the current challenges. Investors will be listening closely, knowing that any hint of pessimism could ripple across the broader market.
Beyond the banking sector, investors are keenly observing developments across various industries to gauge the impact of tariffs and trade negotiations on corporate performance and growth projections.
Next week sees high-profile names like Netflix (NASDAQ:NFLX), Johnson & Johnson (NYSE:JNJ), United Airlines (NASDAQ:UAL), UnitedHealth (NYSE:UNH), Taiwan Semiconductor (NYSE:TSM), and ASML (NASDAQ:ASML) report earnings.
Tesla (NASDAQ:TSLA), Boeing (NYSE:BA), AT&T (NYSE:T), Verizon (NYSE:VZ), GE Aerospace (NYSE:GE), Intel (NASDAQ:INTC), IBM (NYSE:IBM), American Airlines (NASDAQ:AAL), Caterpillar (NYSE:CAT), are then due the following week.
The earnings season gathers momentum in the last week of April when the mega-cap tech companies, including Microsoft (NASDAQ:MSFT), Alphabet (NASDAQ:GOOGL), Meta Platforms (NASDAQ:META), Amazon (NASDAQ:AMZN), and Apple (NASDAQ:AAPL) are all scheduled to release their quarterly updates.
From technology to manufacturing, each sector has its unique vulnerabilities to trade disruptions, and the upcoming earnings season will be a telling indicator of how these companies are adapting and forecasting future demand.
Beyond the reported earnings figures, investors are particularly interested in the forward guidance provided by companies for insights into how tariffs and economic uncertainties are impacting future outlooks. A dour forecast from a bellwether firm could amplify fears that the economy is losing steam.
Tariffs were mentioned over 800 times in investor events and calls during Q4 - the highest number in 15 years and double the mentions during Trump’s 2018-2019 trade war. Management commentary on future earnings prospects, capital expenditures, and strategies to mitigate tariff impacts will be crucial in assessing the resilience of businesses.
Companies that demonstrate adaptability and provide clear strategies for navigating the current trade environment may instill greater confidence among investors.
728 RM B 7/F GEE LOK IND BLDG NO 34 HUNG TO RD KWUN TONG KLN HONG KONG


White Label
Data API
Web Plug-ins
Poster Maker
Affiliate Program
The risk of loss in trading financial instruments such as stocks, FX, commodities, futures, bonds, ETFs and crypto can be substantial. You may sustain a total loss of the funds that you deposit with your broker. Therefore, you should carefully consider whether such trading is suitable for you in light of your circumstances and financial resources.
No decision to invest should be made without thoroughly conducting due diligence by yourself or consulting with your financial advisors. Our web content might not suit you since we don't know your financial conditions and investment needs. Our financial information might have latency or contain inaccuracy, so you should be fully responsible for any of your trading and investment decisions. The company will not be responsible for your capital loss.
Without getting permission from the website, you are not allowed to copy the website's graphics, texts, or trademarks. Intellectual property rights in the content or data incorporated into this website belong to its providers and exchange merchants.
Not Logged In
Log in to access more features

FastBull Membership
Not yet
Purchase


Log In
Sign Up


