• Trade
  • Markets
  • Copy
  • Contests
  • News
  • 24/7
  • Calendar
  • Q&A
  • Chats
Screeners
SYMBOL
LAST
ASK
BID
HIGH
LOW
NET CHG.
%CHG.
SPREAD
SPX
S&P 500 Index
6978.02
6978.02
6978.02
7002.25
6964.04
-0.58
-0.01%
--
DJI
Dow Jones Industrial Average
49015.59
49015.59
49015.59
49150.34
48901.49
+12.19
+ 0.02%
--
IXIC
NASDAQ Composite Index
23857.44
23857.44
23857.44
23988.27
23775.49
+40.33
+ 0.17%
--
USDX
US Dollar Index
96.130
96.210
96.130
96.590
95.660
+0.590
+ 0.62%
--
EURUSD
Euro / US Dollar
1.19613
1.19622
1.19613
1.19615
1.19515
+0.00081
+ 0.07%
--
GBPUSD
Pound Sterling / US Dollar
1.38106
1.38117
1.38106
1.38117
1.37898
+0.00076
+ 0.06%
--
XAUUSD
Gold / US Dollar
5484.29
5484.73
5484.29
5491.26
5419.36
+68.09
+ 1.26%
--
WTI
Light Sweet Crude Oil
63.345
63.375
63.345
63.417
63.202
+0.004
+ 0.01%
--

Community Accounts

Signal Accounts
--
Profit Accounts
--
Loss Accounts
--
View More

Become a signal provider

Sell trading signals to earn additional income

View More

Guide to Copy Trading

Get started with ease and confidence

View More

Signal Accounts for Members

All Signal Accounts

Best Return
  • Best Return
  • Best P/L
  • Best MDD
Past 1W
  • Past 1W
  • Past 1M
  • Past 1Y

All Contests

  • All
  • Trump Updates
  • Recommend
  • Stocks
  • Cryptocurrencies
  • Central Banks
  • Featured News
Top News Only
Share

Nikkei Futures Trade At 53935 Versus Cash Close 53,358

Share

Spot Gold Rises 1% To A Record High Of $5449.29

Share

NASDAQ 100 Futures Rose 0.5% In Early Asian Trading On Thursday

Share

Brazil's Raizen Reports Sugarcane Crushing Of 10.6 Million Metric Tons In The Q3 Of The 2025/26 Crop

Share

Trump Official Told Group Of Executives In January: 'We're Not Here To Prop You Guys Up'

Share

[“De-Americanism” Spreads To Canada, Leading Pension Funds Turn To Yen, Gold, And Swiss Franc] Given The Continued Pressure On The US Dollar Due To US President Trump's Policies, One Of Canada's Largest Institutional Investors Is Viewing The Swiss Franc, Japanese Yen, And Gold As Potential Alternatives. On January 28, Ontario Investment Management Company (OIC) Stated In Its Annual Worldview Report That While US Treasury Yields Rose After Trump Announced Comprehensive Tariffs On April 2 Last Year, The Dollar Still Fell, Potentially Indicating That Investors No Longer View It As A Safe-haven Currency. The Pension Fund Management Company Also Stated That The Recent Performance Of The Dollar Reinforces The Message That The US May No Longer Be A Stable Partner

Share

SPDR Gold Trust Reports Holdings Up 0.24%, Or 2.58 Tonnes, To 1089.96 Tonnes By Jan 28

Share

Exco Technologies: Expect Products Compliant With USMCA Rules Of Origin To Remain Exempt From Tariffs In Long Term

Share

On Wednesday (January 28) In Late New York Trading, S&P 500 Futures Ultimately Rose 0.15%, Dow Jones Futures Fell 0.04%, And NASDAQ 100 Futures Rose 0.79%. Russell 2000 Futures Fell 0.48%

Share

On Wednesday (January 28) At The Close Of Trading In New York (05:59 Beijing Time On Thursday), The Offshore Yuan (CNH) Was Quoted At 6.9437 Against The US Dollar, Down 100 Points From Tuesday's New York Close. During The Day, The Offshore Yuan Traded Between 6.9319 And 6.9493, Generally Declining. It Hit A New Daily Low At 03:00 When The Federal Reserve Announced It Would Hold Rates Steady, Before Slightly Recovering Some Ground

Share

[Israeli Knesset Passes 2026 Budget In First Reading] On January 28, The Israeli Knesset Passed The 2026 National Budget In Its First Reading With 62 Votes To 55. A Second And Third Round Of Voting Will Follow. Under Israeli Law, The Government Must Pass The National Budget By March 31; Otherwise, Knesset Will Automatically Dissolve, And Early Elections Will Be Held Approximately 90 Days Later

Share

Spot Gold Rose Over 4.5%, Hitting A Record High Above $5,400, While New York Gold Futures Rose Over 5.8%. On Wednesday (January 28), Spot Gold Rose 4.53% In Late New York Trading, Hitting A Record High Above $5,415 Per Ounce. It Continued To Rise From Early Asian Trading Until 16:00 Beijing Time, Generally Holding Steady In The $5,250-$5,300 Range During Federal Reserve Chairman Powell's Speech, Before Accelerating Its Gains From 03:08. Comex Gold Futures Rose 5.83% To $5,378.80 Per Ounce, Hitting A Record High Of $5,391.30 At 05:06 (electronic Trading), Continuing The Recent Trend Of Setting New Historical Highs

Share

Spot Gold Hits A Fresh Record High At $5398.99/Oz

Share

US State Dept: Steps Were Taken To Impose Yet Another Round Of Visa Restrictions On Three Haitian Officials

Share

US Magnificent 7 Closing Report | On Wednesday (January 28), The Magnificent 7 Index Rose 0.22% To 209.62 Points, Showing A V-shaped Reversal Overall, Continuing To Rise After The Federal Reserve Released Its Policy Statement. The "mega-cap" Tech Stock Index Rose 0.04% To 398.55 Points, After A Gap-up Opening, It Continuously Gave Back Its Gains And Turned Negative Multiple Times

Share

Australia's Whitehaven Coal Second-Quarter Output Rises 13.5%

Share

New Zealand Dec Month Trade Balance NZ$+52.00 Million

Share

Brazil's Central Bank: Global Environment Still Remains Uncertain Due To The Economic Policy And Economic Outlook In The USA, Altering Global Financial Conditions

Share

Brazil's Central Bank: Headline Inflation And Measures Of Underlying Inflation Continued To Improve But Remained Above The Inflation Target

Share

Brazil's Central Bank: Set Of Indicators Continues To Show, As Expected, A Path Of Moderation On Economic Growth, While The Labor Market Still Shows Signals Of Resilience

TIME
ACT
FCST
PREV
U.S. API Weekly Refined Oil Stocks

A:--

F: --

P: --

U.S. API Weekly Crude Oil Stocks

A:--

F: --

P: --

U.S. API Weekly Gasoline Stocks

A:--

F: --

P: --

U.S. API Weekly Cushing Crude Oil Stocks

A:--

F: --

P: --

Australia RBA Trimmed Mean CPI YoY (Q4)

A:--

F: --

P: --

Australia CPI YoY (Q4)

A:--

F: --

P: --

Australia CPI QoQ (Q4)

A:--

F: --

P: --

Germany GfK Consumer Confidence Index (SA) (Feb)

A:--

F: --

P: --

Germany 10-Year Bund Auction Avg. Yield

A:--

F: --

P: --

India Industrial Production Index YoY (Dec)

A:--

F: --

P: --

India Manufacturing Output MoM (Dec)

A:--

F: --

P: --

U.S. MBA Mortgage Application Activity Index WoW

A:--

F: --

P: --

Canada Overnight Target Rate

A:--

F: --

P: --

BOC Monetary Policy Report
U.S. EIA Weekly Crude Stocks Change

A:--

F: --

P: --

U.S. EIA Weekly Cushing, Oklahoma Crude Oil Stocks Change

A:--

F: --

P: --

U.S. EIA Weekly Crude Demand Projected by Production

A:--

F: --

P: --

U.S. EIA Weekly Crude Oil Imports Changes

A:--

F: --

P: --

U.S. EIA Weekly Heating Oil Stock Changes

A:--

F: --

P: --

U.S. EIA Weekly Gasoline Stocks Change

A:--

F: --

P: --

BOC Press Conference
Russia PPI MoM (Dec)

A:--

F: --

P: --

Russia PPI YoY (Dec)

A:--

F: --

P: --

U.S. Interest Rate On Reserve Balances

A:--

F: --

P: --

U.S. Target Federal Funds Rate Lower Limit (Overnight Reverse Repo Rate)

A:--

F: --

P: --

U.S. Federal Funds Rate Target

A:--

F: --

P: --

U.S. Target Federal Funds Rate Upper Limit (Excess Reserves Ratio)

A:--

F: --

P: --

FOMC Statement
FOMC Press Conference
Brazil Selic Interest Rate

A:--

F: --

P: --

Australia Import Price Index YoY (Q4)

--

F: --

P: --

Japan Household Consumer Confidence Index (Jan)

--

F: --

P: --

Turkey Economic Sentiment Indicator (Jan)

--

F: --

P: --

Euro Zone M3 Money Supply (SA) (Dec)

--

F: --

P: --

Euro Zone Private Sector Credit YoY (Dec)

--

F: --

P: --

Euro Zone M3 Money Supply YoY (Dec)

--

F: --

P: --

Euro Zone 3-Month M3 Money Supply YoY (Dec)

--

F: --

P: --

South Africa PPI YoY (Dec)

--

F: --

P: --

Euro Zone Consumer Confidence Index Final (Jan)

--

F: --

P: --

Euro Zone Selling Price Expectations (Jan)

--

F: --

P: --

Euro Zone Industrial Climate Index (Jan)

--

F: --

P: --

Euro Zone Services Sentiment Index (Jan)

--

F: --

P: --

Euro Zone Economic Sentiment Indicator (Jan)

--

F: --

P: --

Euro Zone Consumer Inflation Expectations (Jan)

--

F: --

P: --

Italy 5-Year BTP Bond Auction Avg. Yield

--

F: --

P: --

Italy 10-Year BTP Bond Auction Avg. Yield

--

F: --

P: --

France Unemployment Class-A (Dec)

--

F: --

P: --

South Africa Repo Rate (Jan)

--

F: --

P: --

Canada Average Weekly Earnings YoY (Nov)

--

F: --

P: --

U.S. Nonfarm Unit Labor Cost Final (Q3)

--

F: --

P: --

U.S. Initial Jobless Claims 4-Week Avg. (SA)

--

F: --

P: --

U.S. Weekly Continued Jobless Claims (SA)

--

F: --

P: --

U.S. Trade Balance (Nov)

--

F: --

P: --

U.S. Weekly Initial Jobless Claims (SA)

--

F: --

P: --

Canada Trade Balance (SA) (Nov)

--

F: --

P: --

U.S. Exports (Nov)

--

F: --

P: --

Canada Imports (SA) (Nov)

--

F: --

P: --

Canada Exports (SA) (Nov)

--

F: --

P: --

U.S. Unit Labor Cost Revised MoM (SA) (Q3)

--

F: --

P: --
U.S. Factory Orders MoM (Nov)

--

F: --

P: --

Q&A with Experts
    • All
    • Chatrooms
    • Groups
    • Friends
    Khawatir_ flag
    @EuroTrader
    Khawatir_ flag
    "Khawatir_" recalled a message
    Khawatir_ flag
    commodity cfd.
    Khawatir_ flag
    Likewise with the HangSeng Index. Mine is the HK33, not the HK50 (Hong Kong 50).
    EuroTrader flag
    Khawatir_
    @EuroTrader
    @Khawatir_I can see the one of natural gas .am going to know why the prices are different
    Khawatir_ flag
    EuroTrader
    tell me the answer.
    EuroTrader flag
    Khawatir_
    Likewise with the HangSeng Index. Mine is the HK33, not the HK50 (Hong Kong 50).
    @Khawatir_okay now i get it .one is futures pricing and the other is CFD pricing. It's clearee now
    EuroTrader flag
    Khawatir_
    @Khawatir_the answer skipped my mind. I forgot we have futures and options contracts while we retail folks deal on CFD
    Khawatir_ flag
    EuroTrader
    @EuroTraderyes, but on HK33 & NatGas I am CFD on my MT5
    Khawatir_ flag
    EuroTrader
    @EuroTrader
    Khawatir_ flag
    Khawatir_
    👆@EuroTrader
    EuroTrader flag
    Khawatir_
    @Khawatir_ okay that's it right .you are trading the CFD offerss not the futures contracts
    Khawatir_ flag
    @EuroTraderGold opened upside m5
    EuroTrader flag
    Khawatir_
    @EuroTraderGold opened upside m5
    @Khawatir_there is no stopping Gold. It's gonna keep making the giant moves to the upside
    EuroTrader flag
    EuroTrader flag
    EuroTrader flag
    EuroTrader
    @Khawatir_just placed my limit orders on natural gas and I'll be holding this trade for the next one month
    Khawatir_ flag
    Khawatir_ flag
    @EuroTradermine, pure complete double bottom or imperfect head & shoulder
    Type here...
    Add Symbol or Code

      No matching data

      All
      Trump Updates
      Recommend
      Stocks
      Cryptocurrencies
      Central Banks
      Featured News
      • All
      • Russia-Ukraine Conflict
      • Middle East Flashpoint
      • All
      • Russia-Ukraine Conflict
      • Middle East Flashpoint
      Search
      Products

      Charts Free Forever

      Chats Q&A with Experts
      Screeners Economic Calendar Data Tools
      Membership Features
      Data Warehouse Market Trends Institutional Data Policy Rates Macro

      Market Trends

      Market Sentiment Order Book Forex Correlations

      Top Indicators

      Charts Free Forever
      Markets

      News

      News Analysis 24/7 Columns Education
      From Institutions From Analysts
      Topics Columnists

      Latest Views

      Latest Views

      Trending Topics

      Top Columnists

      Latest Update

      Signals

      Copy Rankings Latest Signals Become a signal provider AI Rating
      Contests
      Brokers

      Overview Brokers Assessment Rankings Regulators News Claims
      Broker listing Forex Brokers Comparison Tool Live Spread Comparison Scam
      Q&A Complaint Scam Alert Videos Tips to Detect Scam
      More

      Business
      Events
      Careers About Us Advertising Help Center

      White Label

      Data API

      Web Plug-ins

      Affiliate Program

      Awards Institution Evaluation IB Seminar Salon Event Exhibition
      Vietnam Thailand Singapore Dubai
      Fans Party Investment Sharing Session
      FastBull Summit BrokersView Expo
      Recent Searches
        Top Searches
          Markets
          News
          Analysis
          User
          24/7
          Economic Calendar
          Education
          Data
          • Names
          • Latest
          • Prev

          View All

          No data

          Scan to Download

          Faster Charts, Chat Faster!

          Download App
          English
          • English
          • Español
          • العربية
          • Bahasa Indonesia
          • Bahasa Melayu
          • Tiếng Việt
          • ภาษาไทย
          • Français
          • Italiano
          • Türkçe
          • Русский язык
          • 简中
          • 繁中
          Open Account
          Search
          Products
          Charts Free Forever
          Markets
          News
          Signals

          Copy Rankings Latest Signals Become a signal provider AI Rating
          Contests
          Brokers

          Overview Brokers Assessment Rankings Regulators News Claims
          Broker listing Forex Brokers Comparison Tool Live Spread Comparison Scam
          Q&A Complaint Scam Alert Videos Tips to Detect Scam
          More

          Business
          Events
          Careers About Us Advertising Help Center

          White Label

          Data API

          Web Plug-ins

          Affiliate Program

          Awards Institution Evaluation IB Seminar Salon Event Exhibition
          Vietnam Thailand Singapore Dubai
          Fans Party Investment Sharing Session
          FastBull Summit BrokersView Expo

          Denmark Is Finally Giving Up On EU Chat Control After Privacy Backlash

          Winkelmann

          Forex

          Economic

          Summary:

          Denmark, which holds the European Council presidency, has reportedly withdrawn the proposal that would have forced platforms like Telegram, WhatsApp and Signal to allow authorities to screen messages before they're encrypted and sent.

          Denmark, which holds the European Council presidency, has reportedly withdrawn the proposal that would have forced platforms like Telegram, WhatsApp and Signal to allow authorities to screen messages before they're encrypted and sent.

          The proposed legislation, known as the Chat Control law, was first introduced in May 2022 as a method to combat the spread of illicit and illegal content through messaging services.

          A revived version of it came up this year, with critics arguing again that it would undermine encrypted messaging and people's right to privacy.

          The withdrawn proposal means it will remain voluntary.

          Minister of Justice Peter Hummelgaard stated that the proposal will now "not be part of the EU presidency's new compromise proposal, and that it will continue to be voluntary," for tech giants to screen encrypted messages, according to a report by Danish daily newspaper Politiken on Oct. 30.

          Current framework expires in April

          The current voluntary framework expires in April 2026, and Politiken reported that Hummelgaard stated that if the years-long political stalemate over Chat Control were not resolved, it would leave the EU without any legal tools to combat bad actors using messaging services.

          The backtrack on chat control was reportedly to ensure a new framework could be implemented before the deadline.

          Tech giants and privacy advocates celebrate

          X's Global Government Affairs team said on Saturday that Denmark's withdrawal is a "major defeat for mass surveillance advocates," and the platform will "continue to monitor the progress of these negotiations and oppose any efforts to implement government mass surveillance of users."

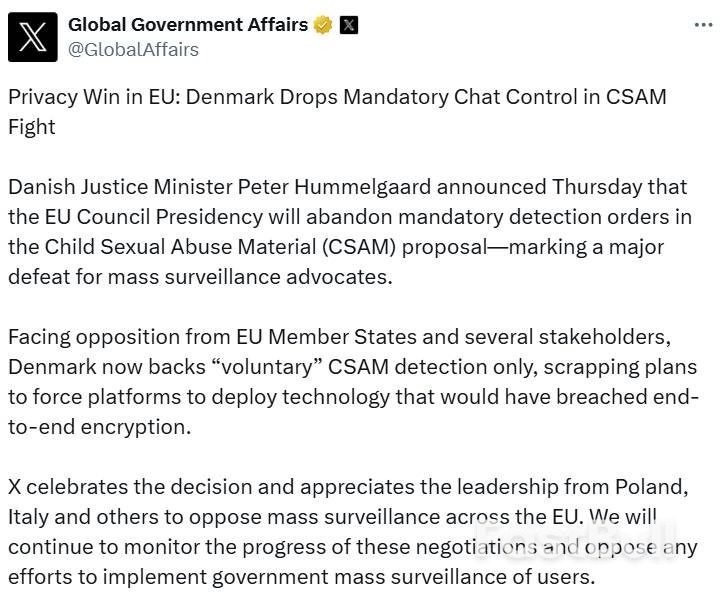
          Source: X Global Government Affairs

          Patrick Hansen, the director of EU Strategy and Policy at stablecoin issuer Circle, also applauded the news and stated it was a "Major win for digital freedoms in the EU."

          The Electronic Frontier Foundation (EFF), a civil liberty nonprofit, shared a similar stance and speculated public pressure "pushed the EU Council to withdraw its dangerous plan to scan encrypted messages."

          Lawmakers need to give up on mass surveillance

          Thorin Klosowski, a security and privacy activist with the EFF, said in a blog post on Friday that lawmakers should stop attempting to bypass encryption under the guise of public safety.

          He argues that the focus should be on "developing real solutions that don't violate the human rights of people around the world."

          "As long as lawmakers continue to misunderstand the way encryption technology works, there is no way forward with message-scanning proposals, not in the EU or anywhere else," he said.

          "This sort of surveillance is not just an overreach; it's an attack on fundamental human rights. The coming EU presidencies should abandon these attempts and work on finding a solution that protects people's privacy and security."

          Ireland will assume the EU Council's presidency in July 2026, taking the reins from Denmark after a year in the role.

          Source: COINTELEGRAPH

          To stay updated on all economic events of today, please check out our Economic calendar
          Risk Warnings and Disclaimers
          You understand and acknowledge that there is a high degree of risk involved in trading. Following any strategies or investment methods may lead to potential losses. The content on the site is provided by our contributors and analysts for information purposes only. You are solely responsible for determining whether any trading assets, securities, strategy, or any other product is suitable for investing based on your own investment objectives and financial situation.
          Add to Favorites
          Share

          Thailand Manufacturing Sector Expansion Accelerates To 29-month High

          James Whitman

          Economic

          Thailand's manufacturing sector expansion accelerated in October, reaching its fastest pace since May 2023, according to the latest S&P Global Thailand Manufacturing PMI data.

          The headline PMI rose to 56.6 in October from 54.6 in September, marking the sixth consecutive month above the 50.0 neutral mark. This indicates a significant improvement in manufacturing conditions.

          New orders increased at the steepest rate in two-and-a-half years, driven by successful business development and rising client interest. While external demand continued to decline, the fall in new export orders was only marginal and less severe than in September.

          Production growth accelerated for the seventh consecutive month in response to rising new work. Thai manufacturers increased their workforce capacity for the second straight month to manage growing workloads.

          Despite these efforts, backlogs accumulated at a survey record pace, and finished goods inventories declined for the fifth consecutive month as companies fulfilled orders.

          Purchasing activity expanded in October, though stocks of purchases continued to decline due to high utilization of input products and shipment delays as lead times lengthened.

          On the pricing front, average input costs stabilized after three consecutive months of decline, leading manufacturers to keep their selling prices unchanged at the start of the fourth quarter.

          Business confidence improved to its highest level in two-and-a-half years, supported by hopes for business expansion plans and better economic conditions to drive sales in the coming year.

          Jingyi Pan, Economics Associate Director at S&P Global Market Intelligence, noted that manufacturing output rose at the quickest pace in nearly two-and-a-half years, primarily driven by robust domestic demand.

          Pan added that forward-looking indicators present a positive outlook for near-term output growth, suggesting the Thai manufacturing sector remains on track for continued growth in the coming months.

          Source: Investing

          To stay updated on all economic events of today, please check out our Economic calendar
          Risk Warnings and Disclaimers
          You understand and acknowledge that there is a high degree of risk involved in trading. Following any strategies or investment methods may lead to potential losses. The content on the site is provided by our contributors and analysts for information purposes only. You are solely responsible for determining whether any trading assets, securities, strategy, or any other product is suitable for investing based on your own investment objectives and financial situation.
          Add to Favorites
          Share

          Asian Equities Extend Gains on Tech Momentum as Wall Street Closes Another Positive Month

          Gerik

          Economic

          Stocks

          Tech-Led Rally Lifts Asian Markets After Wall Street’s Bullish Streak

          Asian equities opened the week on a positive note, with South Korea leading regional gains and investor sentiment buoyed by a strong finish in U.S. markets. Momentum from Wall Street’s continued climb, particularly fueled by Amazon’s better-than-expected earnings, spilled over into Asia despite mixed economic data from China and ongoing geopolitical uncertainty.
          The South Korean Kospi surged 2.6% to close at 4,212.20, with Samsung Electronics rallying 3.4% as investors rotated back into heavyweight tech names. This followed Friday’s 9.6% jump in Amazon’s shares, driven by a surprisingly large profit that lifted the S&P 500 to 6,840.20 just shy of its record high earlier in the week.
          Meanwhile, Japan’s markets remained shut for a public holiday, removing one of the region’s largest contributors from the day’s activity. Futures for the Dow and S&P 500 indicated mild optimism, up 0.2% and 0.3% respectively, reflecting cautious confidence ahead of more earnings releases and economic data.

          China’s Factory Activity Slows, Damping Momentum

          Investor enthusiasm was more muted in China, where manufacturing data showed signs of slowing. The private RatingDog PMI slipped to 50.6 in October from 51.2 in September, while the official figure dropped to 49.0 remaining below the expansion threshold. These figures suggest moderating industrial growth, which weighed slightly on Shanghai equities, although the Composite Index still managed to rise 0.1% to 3,958.21. The Hang Seng in Hong Kong added 0.4%, supported by selective tech buying.
          The Chinese data points highlight a likely correlation rather than a causation between recent policy uncertainty and weakening factory momentum. Slower activity could be driven by external demand shifts and cautious domestic consumption amid tax changes and ongoing reforms.

          Geopolitical Backdrop: Taiwan and U.S.-China Relations

          Markets largely shrugged off comments by U.S. President Donald Trump regarding Taiwan. While Trump suggested that Chinese President Xi Jinping had pledged to avoid action on the self-governed island during Trump’s tenure, this did not result in immediate market reactions. Investors remained focused on trade policy and earnings, though Taiwan’s market edged up slightly by 0.1%.
          The limited reaction indicates that geopolitical risk, while present, did not materially impact short-term investor positioning at the start of the week. Traders appear to be taking a wait-and-see approach regarding the durability of any U.S.-China trade truce.

          Wall Street Ends a Strong Month with Amazon’s Lead

          Back in the U.S., major indices closed October on a high. The S&P 500 posted its sixth consecutive monthly gain the longest streak since 2021. Amazon’s surge, thanks to a market capitalization exceeding $2.4 trillion, accounted for a significant portion of the day’s index movement. Without it, the S&P would have posted a minor loss.
          Apple also reported a positive earnings surprise, though the stock slipped 0.4% as investors digested revenue composition details. CEO Tim Cook highlighted strong iPhone and services performance. Despite this, broader concerns remain around inflated valuations and whether recent tech earnings can support sustained price increases.
          Recent jitters over aggressive AI-related capital expenditures from Meta and Microsoft underscore those concerns. Investors remain wary of valuation bubbles forming, even as large-cap tech names continue to dominate index performance.

          Commodities and Currency Markets Remain Steady

          Oil prices inched higher, with U.S. benchmark crude trading at $61.21 per barrel and Brent crude rising to $65.03. These gains were modest but reflected underlying optimism in energy demand projections. Meanwhile, the dollar strengthened against the yen to 154.06, while the euro edged lower to $1.1532, reflecting a mild shift in risk sentiment and expectations around central bank policy divergence.
          Asian markets entered November with renewed optimism, boosted by robust U.S. tech earnings and a continuation of Wall Street’s bullish trend. South Korea’s outsized performance illustrates the region’s sensitivity to global tech movements, while slower manufacturing figures in China and geopolitical undercurrents surrounding Taiwan serve as reminders of lingering fragilities. Investors are navigating a market environment that rewards strong fundamentals but remains susceptible to valuation concerns and policy shifts, both domestic and international.

          Source: AP

          To stay updated on all economic events of today, please check out our Economic calendar
          Risk Warnings and Disclaimers
          You understand and acknowledge that there is a high degree of risk involved in trading. Following any strategies or investment methods may lead to potential losses. The content on the site is provided by our contributors and analysts for information purposes only. You are solely responsible for determining whether any trading assets, securities, strategy, or any other product is suitable for investing based on your own investment objectives and financial situation.
          Add to Favorites
          Share

          China's Tax Policy Shift Pushes Gold Below $4,000 as Market Recalibrates

          Gerik

          Commodity

          Economic

          Gold Retreats Amid Policy Shift in World’s Largest Consumer Market

          Spot gold declined to $3,997.40 per ounce in Singapore trading following a 2.7% weekly drop, as China’s unexpected move to cut longstanding tax incentives reshaped global sentiment. The Chinese government’s decision to partially revoke the value-added tax (VAT) rebate for certain gold sales, specifically for non-investment purposes, marks a critical pivot in the bullion market particularly for the retail and jewelry sectors. While the correction was relatively modest at 1% intraday, its symbolic impact on trader psychology was more pronounced.
          Under the previous structure, Chinese retailers including both members and non-members of the Shanghai Gold Exchange and Shanghai Futures Exchange were permitted to deduct a 13% VAT on input costs for gold, regardless of its end use. This framework effectively reduced the cost of gold products, encouraging strong retail demand, especially in the jewelry segment. As of November, however, Beijing has amended this approach: only investment-grade gold sold by exchange members will continue receiving the full tax benefit. All other sales such as those used for jewelry or industrial products will be subject to a reduced 6% input VAT deduction.
          This change, set to remain in place through the end of 2027, forces much of the downstream industry to absorb higher effective costs or pass them along to consumers, undermining affordability in a price-sensitive segment. Analysts at Citigroup noted that price increases are highly likely across the entire retail chain, amplifying inflationary pressure on gold jewelry.

          Causal Relationship Between Policy and Price Movements

          The price dip is not merely a coincidental occurrence alongside policy news. There is a direct causal link between Beijing’s VAT revision and reduced investor and consumer appetite. Jewelry-focused firms were the first to react, with Chow Tai Fook plunging as much as 12%, Chow Sang Sang dropping over 8%, and Laopu Gold falling more than 9% in Hong Kong trading. The new VAT structure discourages non-investment consumption by narrowing retailer margins and making gold jewelry less competitive in price.
          In this context, gold’s sharp October rally fueled partly by retail hoarding behavior was bound to be corrected, especially as speculative demand subsided. The recent correction, then, is more than a technical pullback; it reflects a structural policy-induced adjustment, particularly in Asia, where physical demand traditionally anchors long-term support levels.

          Global Sentiment and Investor Outlook

          Although Chinese consumption was not the primary driver of this year’s record-breaking surge in gold prices, which have soared over 50% year-to-date, the recent tax shift introduces a significant headwind to sentiment. According to BullionVault’s Adrian Ash, this may signal the start of a deeper correction phase, welcomed by some investors seeking more attractive reentry points.
          Central banks and institutional investors remain key pillars supporting gold’s upward trajectory, due to persistent geopolitical risks and currency instability. However, localized disruptions such as tax policy in China can create short- to medium-term volatility that interrupts bullish momentum.
          China’s recalibration of tax incentives for gold sales, while not devastating in isolation, introduces a new layer of complexity to an already sensitive commodity market. It weakens demand from the world’s largest consumer, pushes downstream firms toward price hikes, and injects bearish sentiment into global gold trade. The full impact of this shift will unfold in the coming quarters, but for now, gold’s breach of the $4,000 level underscores how quickly policy changes in a single nation can ripple through global markets.

          Source: Bloomberg

          To stay updated on all economic events of today, please check out our Economic calendar
          Risk Warnings and Disclaimers
          You understand and acknowledge that there is a high degree of risk involved in trading. Following any strategies or investment methods may lead to potential losses. The content on the site is provided by our contributors and analysts for information purposes only. You are solely responsible for determining whether any trading assets, securities, strategy, or any other product is suitable for investing based on your own investment objectives and financial situation.
          Add to Favorites
          Share

          Malaysia’s $142 Million Magnet Plant Aims to Position Nation as Rare Earths Powerhouse

          Gerik

          Economic

          Commodity

          Malaysia Moves to Anchor Rare Earths Industry with Magnet Facility

          Prime Minister Anwar Ibrahim announced that Malaysia’s rare earth ambitions are taking a concrete step forward with the construction of a 600 million ringgit ($142 million) magnet manufacturing plant in the Kuantan district of Pahang. The project led by Lynas Rare Earths of Australia and JS Link of South Korea will produce 3,000 tonnes of neodymium magnets annually, crucial components in electric vehicles, wind turbines, semiconductors, and defense systems.
          Anwar emphasized that the project has already moved beyond a memorandum of understanding. “JS Link has purchased the land, and the investment is in what’s left is to accelerate the process,” he stated, confirming that Malaysia’s Trade Ministry will supervise progress due to the strategic importance of rare-earth processing.

          Building a Domestic Supply Chain for Critical Minerals

          The move comes amid growing global pressure to diversify critical mineral supply chains, reducing overreliance on China, which currently dominates over 80% of the rare earths processing market. Malaysia, estimated to hold 16.1 million metric tons of rare earth deposits, has historically lacked the technology and capacity to fully exploit these resources. The new magnet plant is part of a broader strategy to shift from raw material exporter to value-added processor, allowing Malaysia to participate more deeply in high-tech global supply chains.
          This development has both economic and strategic implications. By engaging in value-added production, Malaysia is increasing its potential as a regional hub for advanced materials and clean technology, aligning with its broader industrial upgrading agenda.

          Geopolitical Context and Partnerships

          Malaysia’s rare earth strategy is unfolding amid intensifying geopolitical competition over critical minerals. In recent months, the country has engaged with both China and the United States on rare-earth cooperation. In October, Malaysia signed a deal with the US to explore joint efforts in diversifying rare earth supply chains, while ongoing negotiations with China focus on technical collaboration in refining and processing.
          This dual-track diplomacy reflects Malaysia’s intent to remain non-aligned and investment-friendly, attracting partnerships from both East and West. The involvement of Lynas already operating a rare earth separation plant in Malaysia and JS Link provides a technological backbone and supply assurance, enhancing investor confidence and accelerating the nation’s industrial upgrading.
          The magnet plant signals a decisive step in Malaysia’s rare earths strategy, transitioning from passive resource holder to active player in high-tech manufacturing. With major partners on board and construction underway, Malaysia is now positioning itself as a competitive node in the global rare earths value chain. The success of this project could redefine Malaysia’s role in clean energy, electronics, and defense technology ecosystems and may set a template for how resource-rich but technologically constrained nations can leapfrog into advanced manufacturing through strategic collaboration.

          Source: Reuters

          To stay updated on all economic events of today, please check out our Economic calendar
          Risk Warnings and Disclaimers
          You understand and acknowledge that there is a high degree of risk involved in trading. Following any strategies or investment methods may lead to potential losses. The content on the site is provided by our contributors and analysts for information purposes only. You are solely responsible for determining whether any trading assets, securities, strategy, or any other product is suitable for investing based on your own investment objectives and financial situation.
          Add to Favorites
          Share

          China’s Factory Activity Slows in October as Export Orders Drop and Confidence Wanes

          Gerik

          Economic

          Private Manufacturing Data Shows Signs of Strain

          China’s manufacturing momentum showed renewed signs of cooling in October, with the RatingDog General Manufacturing PMI, compiled by S&P Global, falling to 50.6 from 51.2 in September. The figure fell short of the 50.9 expected by analysts and underscores softening factory activity just as global demand uncertainty continues to weigh on exports.
          Although the reading remains above the 50-point threshold that separates expansion from contraction, it contrasts sharply with the official PMI of 49.0, released last Friday by the National Bureau of Statistics, which showed factory output shrinking at the fastest pace in six months. This divergence highlights structural differences in survey methodology: the private index focuses more heavily on small- and mid-sized exporters, while the official data covers a broader swath of the economy.

          Export Orders Fall and Confidence Weakens

          A major drag on October’s performance came from new export orders, which declined at the fastest pace since May, driven by rising trade uncertainty amid earlier escalations with the US. Surveyed firms reported subdued demand and a cautious stance toward future production plans.
          The business confidence gauge fell to its lowest in six months, suggesting that manufacturers are more pessimistic about their 12-month outlook. The slowdown in new business and output growth compounded this sentiment. These data points indicate a causal relationship between geopolitical tensions and the moderation in factory activity, rather than a temporary fluctuation.

          Employment Uptick Offers a Silver Lining

          In contrast to the broader slowdown, the employment index posted a surprise uptick, rising for the first time since March and reaching its highest level since August 2023. While the hiring rebound may reflect labor restructuring or delayed effects of prior stimulus, its sustainability remains uncertain given the underlying weakness in orders and investment.
          The survey comes just days after the US and China announced a temporary trade truce, following a bilateral summit between President Donald Trump and President Xi Jinping. As part of the deal, the US agreed to halve fentanyl-related tariffs on Chinese goods, suspending expansion of the Commerce Department’s export blacklist and pausing Section 301 investigations into China's logistics and shipbuilding industries.
          In return, China will lift retaliatory tariffs on a wide range of US agricultural products, including soybeans, pork, and beef, and terminate anti-dumping investigations against American chipmakers. The easing of restrictions on Nexperia chip exports also suggests some softening of Beijing’s protectionist stance, which may gradually restore confidence in the tech supply chain.

          Mixed Outlook for 2025 and Beyond

          Despite the trade détente, the outlook for China’s manufacturing remains cautious. Growth in the third quarter slowed to 4.8%, the weakest in a year, and fixed-asset investment declined 0.5%, the first drop since 2020. Structural headwinds, such as the prolonged property downturn and the fading impact of earlier consumption subsidies, are likely to cap further acceleration.
          Export performance has remained relatively resilient thanks to market diversification, with sales to Southeast Asia up 14.7%, to the EU up 8.2%, and to Africa surging over 28%. Still, exports to the US have declined by double digits every month since April, reinforcing China’s push to reduce dependence on American demand.
          October’s weaker PMI reading reflects the delicate balance China must maintain between global trade dynamics and domestic structural pressures. While the recent trade truce with the US offers short-term relief and could stabilize orders in the months ahead, waning business confidence, weak fixed investment, and a declining property sector present deeper challenges. The modest rebound in factory employment offers a positive signal, but unless global demand and domestic investment regain traction, China’s manufacturing recovery will likely remain uneven into 2026.

          Source: CNBC

          To stay updated on all economic events of today, please check out our Economic calendar
          Risk Warnings and Disclaimers
          You understand and acknowledge that there is a high degree of risk involved in trading. Following any strategies or investment methods may lead to potential losses. The content on the site is provided by our contributors and analysts for information purposes only. You are solely responsible for determining whether any trading assets, securities, strategy, or any other product is suitable for investing based on your own investment objectives and financial situation.
          Add to Favorites
          Share

          China's Factory Activity Slows Down In October, Missing Expectations, Private PMI Shows

          Winkelmann

          Forex

          Political

          China–U.S. Trade War

          Economic

          China's factory activity growth in October missed market expectations, as trade tensions with the U.S. intensified during the month, according to a private survey released Monday.

          The RatingDog China General Manufacturing PMI, compiled by S&P Global, dropped to 50.6 in October from the six-month high of 51.2 in September, missing analysts' expectations of 50.9 in a Reuters poll.

          Staying above the 50-benchmark that separates growth from contraction, the private survey numbers were better compared to the official survey released last Friday that showed manufacturing activity falling to 49.0, its worst contraction in six months.

          Private surveys, previously conducted by Caixin and S&P Global, have usually painted a better picture than official polls over the past years as they have focused more on export-oriented manufacturers.

          The RatingDog private survey covers 650 manufacturers and collects responses in the second half of each month while the official PMI surveys a larger sample of over 3,000 companies at month-end.

          With the extension of the U.S.-China trade truce and expected recovery in export orders, the manufacturing PMI is likely to rebound modestly in the coming months as business confidence stabilizes, said Dongming Xie, managing director and head of Asia macro research at OCBC Bank.

          China and the U.S. reached a trade truce last week following a meeting between American President Donald Trump and his Chinese counterpart, Xi Jinping, in South Korea, stabilizing relations after an escalating trade battle that had sparked fears of a global economic downturn.

          Under the agreement, the U.S. will lower the fentanyl-linked tariffs on Chinese goods by half to 10%, taking the total rate on Chinese goods to around 47%, in response to China pausing its sweeping export controls on rare earth metals.

          The U.S. will also suspend the implementation of the 50% ownership "penetration rule" under export controls and the Section 301 investigation into China's maritime, logistics and shipbuilding sectors.

          Source: CNBC

          To stay updated on all economic events of today, please check out our Economic calendar
          Risk Warnings and Disclaimers
          You understand and acknowledge that there is a high degree of risk involved in trading. Following any strategies or investment methods may lead to potential losses. The content on the site is provided by our contributors and analysts for information purposes only. You are solely responsible for determining whether any trading assets, securities, strategy, or any other product is suitable for investing based on your own investment objectives and financial situation.
          Add to Favorites
          Share
          FastBull
          Copyright © 2026 FastBull Ltd

          728 RM B 7/F GEE LOK IND BLDG NO 34 HUNG TO RD KWUN TONG KLN HONG KONG

          TelegramInstagramTwitterfacebooklinkedin
          App Store Google Play Google Play
          Products
          Charts

          Chats

          Q&A with Experts
          Screeners
          Economic Calendar
          Data
          Tools
          Membership
          Features
          Function
          Markets
          Copy Trading
          Latest Signals
          Contests
          News
          Analysis
          24/7
          Columns
          Education
          Company
          Careers
          About Us
          Contact Us
          Advertising
          Help Center
          Feedback
          User Agreement
          Privacy Policy
          Personal Information Protection Statement
          Business

          White Label

          Data API

          Web Plug-ins

          Poster Maker

          Affiliate Program

          Risk Disclosure

          The risk of loss in trading financial instruments such as stocks, FX, commodities, futures, bonds, ETFs and crypto can be substantial. You may sustain a total loss of the funds that you deposit with your broker. Therefore, you should carefully consider whether such trading is suitable for you in light of your circumstances and financial resources.

          No decision to invest should be made without thoroughly conducting due diligence by yourself or consulting with your financial advisors. Our web content might not suit you since we don't know your financial conditions and investment needs. Our financial information might have latency or contain inaccuracy, so you should be fully responsible for any of your trading and investment decisions. The company will not be responsible for your capital loss.

          Without getting permission from the website, you are not allowed to copy the website's graphics, texts, or trademarks. Intellectual property rights in the content or data incorporated into this website belong to its providers and exchange merchants.

          Not Logged In

          Log in to access more features

          Connect Broker
          Become a signal provider
          Help Center
          Customer Service
          Dark Mode
          Price Up/Down Colors

          Log In

          Sign Up

          Position
          Layout
          Fullscreen
          Default to Chart
          The chart page opens by default when you visit fastbull.com