• Trade
  • Markets
  • Copy
  • Contests
  • News
  • 24/7
  • Calendar
  • Q&A
  • Chats
Trending
Screeners
SYMBOL
LAST
BID
ASK
HIGH
LOW
NET CHG.
%CHG.
SPREAD
SPX
S&P 500 Index
6870.39
6870.39
6870.39
6895.79
6858.28
+13.27
+ 0.19%
--
DJI
Dow Jones Industrial Average
47954.98
47954.98
47954.98
48133.54
47871.51
+104.05
+ 0.22%
--
IXIC
NASDAQ Composite Index
23578.12
23578.12
23578.12
23680.03
23506.00
+72.99
+ 0.31%
--
USDX
US Dollar Index
98.880
98.960
98.880
98.960
98.730
-0.070
-0.07%
--
EURUSD
Euro / US Dollar
1.16521
1.16528
1.16521
1.16717
1.16341
+0.00095
+ 0.08%
--
GBPUSD
Pound Sterling / US Dollar
1.33266
1.33274
1.33266
1.33462
1.33136
-0.00046
-0.03%
--
XAUUSD
Gold / US Dollar
4206.76
4207.19
4206.76
4218.85
4190.61
+8.85
+ 0.21%
--
WTI
Light Sweet Crude Oil
59.248
59.278
59.248
60.084
59.247
-0.561
-0.94%
--

Community Accounts

Signal Accounts
--
Profit Accounts
--
Loss Accounts
--
View More

Become a signal provider

Sell trading signals to earn additional income

View More

Guide to Copy Trading

Get started with ease and confidence

View More

Signal Accounts for Members

All Signal Accounts

Best Return
  • Best Return
  • Best P/L
  • Best MDD
Past 1W
  • Past 1W
  • Past 1M
  • Past 1Y

All Contests

  • All
  • Trump Updates
  • Recommend
  • Stocks
  • Cryptocurrencies
  • Central Banks
  • Featured News
Top News Only
Share

German Government Spokesperson: We See Russia As A Threat To Our Security

Share

Thai Army Chief Of Staff: Thailand Seeking To Cripple Cambodia's Military Capability

Share

German Government Spokesperson: We Reject Criticism Of Europe In New US National Security Strategy

Share

Ivory Coast 2025/26 Cocoa Arrivals Reached 803000 T By December 7 Versus 820000 T A Year Ago - Exporters' Estimate

Share

EU To Delay Proposals For Automotive Sector, Including Co2 Emissions, To Dec 16, Draft EU Commission Document Shows

Share

Kremlin: India Buys Energy Where It Is Profitable To And As Far As We Understand They Will Continue To Do That

Share

Turkey's Main Banking Index Up 2.5%

Share

Turkey's Main BIST-100 Index Up 1.9%

Share

Hungary's Preliminary November Budget Balance Huf -403 Billion

Share

Indian Rupee Down 0.1% At 90.07 Per USA Dollar As Of 3:30 P.M. Ist, Previous Close 89.98

Share

India's Nifty 50 Index Provisionally Ends 0.96% Lower

Share

[JPMorgan: US Stock Rally May Stagnate Following Fed Rate Cut] JPMorgan Strategists Say The Recent Rally In US Stocks May Stall As Investors Take Profits Following The Anticipated Fed Rate Cut. The Market Currently Predicts A 92% Probability Of The Fed Lowering Borrowing Costs On Wednesday. Expectations Of A Rate Cut Have Continued To Rise, Fueled By Positive Signals From Policymakers In Recent Weeks. "Investors May Be More Inclined To Lock In Gains At The End Of The Year Rather Than Increase Directional Exposure," Mislav Matejka's Team Wrote In A Report

Share

Russian Defence Ministry: Russian Forces Take Control Of Novodanylivka In Ukraine's Zaporizhzhia Region

Share

Russian Defence Ministry: Russian Forces Take Control Of Chervone In Ukraine's Donetsk Region

Share

French Finance Ministry: Government Started Process To Block Temporarily Shein Platform

Share

Finance Minister: Indonesia To Impose Coal Export Tax Of Up To 5% Next Year

Share

[Trump Considering Fired Homeland Security Secretary Noem? White House Denies] According To Reports From US Media Outlets Such As The Daily Beast And The UK's Independent, The White House Has Denied Reports That US President Trump Is Considering Firing Homeland Security Secretary Noem. White House Spokesperson Abigail Jackson Posted On Social Media On The 7th Local Time, Calling The Claims "fake News" And Stating That "Secretary Noem Has Done An Excellent Job Implementing The President's Agenda And 'making America Safe Again'."

Share

HKEX: Standard Chartered Bought Back 571604 Total Shares On Other Exchanges For Gbp9.5 Million On Dec 5

Share

Morgan Stanley Reiterates Bullish Outlook On US Stocks Due To Fed Rate Cut Expectations. Morgan Stanley Strategists Believe That The US Stock Market Faces A "bullish Outlook" Given Improved Earnings Expectations And Anticipated Fed Rate Cuts. They Expect Strong Corporate Earnings By 2026, And Anticipate The Fed Will Cut Rates Based On Lagging Or Mildly Weak Labor Markets. They Expect The US Consumer Discretionary Sector And Small-cap Stocks To Continue To Outperform

Share

China's National Development And Reform Commission Announced That Starting From 24:00 On December 8, The Retail Price Limit For Gasoline And Diesel In China Will Be Reduced By 55 Yuan Per Ton, Which Translates To A Reduction Of 0.04 Yuan Per Liter For 92-octane Gasoline, 0.05 Yuan Per Liter For 95-octane Gasoline, And 0.05 Yuan Per Liter For 0# Diesel

TIME
ACT
FCST
PREV
France Industrial Output MoM (SA) (Oct)

A:--

F: --

P: --
France Trade Balance (SA) (Oct)

A:--

F: --

P: --
Euro Zone Employment YoY (SA) (Q3)

A:--

F: --

P: --
Canada Part-Time Employment (SA) (Nov)

A:--

F: --

P: --

Canada Unemployment Rate (SA) (Nov)

A:--

F: --

P: --

Canada Full-time Employment (SA) (Nov)

A:--

F: --

P: --

Canada Labor Force Participation Rate (SA) (Nov)

A:--

F: --

P: --

Canada Employment (SA) (Nov)

A:--

F: --

P: --

U.S. PCE Price Index MoM (Sept)

A:--

F: --

P: --

U.S. Personal Income MoM (Sept)

A:--

F: --

P: --

U.S. Core PCE Price Index MoM (Sept)

A:--

F: --

P: --

U.S. PCE Price Index YoY (SA) (Sept)

A:--

F: --

P: --

U.S. Core PCE Price Index YoY (Sept)

A:--

F: --

P: --

U.S. Personal Outlays MoM (SA) (Sept)

A:--

F: --

P: --
U.S. 5-10 Year-Ahead Inflation Expectations (Dec)

A:--

F: --

P: --

U.S. Real Personal Consumption Expenditures MoM (Sept)

A:--

F: --

P: --
U.S. Weekly Total Rig Count

A:--

F: --

P: --

U.S. Weekly Total Oil Rig Count

A:--

F: --

P: --

U.S. Consumer Credit (SA) (Oct)

A:--

F: --

P: --
China, Mainland Foreign Exchange Reserves (Nov)

A:--

F: --

P: --

Japan Trade Balance (Oct)

A:--

F: --

P: --

Japan Nominal GDP Revised QoQ (Q3)

A:--

F: --

P: --

China, Mainland Imports YoY (CNH) (Nov)

A:--

F: --

P: --

China, Mainland Exports (Nov)

A:--

F: --

P: --

China, Mainland Imports (CNH) (Nov)

A:--

F: --

P: --

China, Mainland Trade Balance (CNH) (Nov)

A:--

F: --

P: --

China, Mainland Exports YoY (USD) (Nov)

A:--

F: --

P: --

China, Mainland Imports YoY (USD) (Nov)

A:--

F: --

P: --

Germany Industrial Output MoM (SA) (Oct)

A:--

F: --

P: --
Euro Zone Sentix Investor Confidence Index (Dec)

A:--

F: --

P: --

Canada National Economic Confidence Index

--

F: --

P: --

U.K. BRC Like-For-Like Retail Sales YoY (Nov)

--

F: --

P: --

U.K. BRC Overall Retail Sales YoY (Nov)

--

F: --

P: --

Australia Overnight (Borrowing) Key Rate

--

F: --

P: --

RBA Rate Statement
RBA Press Conference
Germany Exports MoM (SA) (Oct)

--

F: --

P: --

U.S. NFIB Small Business Optimism Index (SA) (Nov)

--

F: --

P: --

Mexico 12-Month Inflation (CPI) (Nov)

--

F: --

P: --

Mexico Core CPI YoY (Nov)

--

F: --

P: --

Mexico PPI YoY (Nov)

--

F: --

P: --

U.S. Weekly Redbook Index YoY

--

F: --

P: --

U.S. JOLTS Job Openings (SA) (Oct)

--

F: --

P: --

China, Mainland M1 Money Supply YoY (Nov)

--

F: --

P: --

China, Mainland M0 Money Supply YoY (Nov)

--

F: --

P: --

China, Mainland M2 Money Supply YoY (Nov)

--

F: --

P: --

U.S. EIA Short-Term Crude Production Forecast For The Year (Dec)

--

F: --

P: --

U.S. EIA Natural Gas Production Forecast For The Next Year (Dec)

--

F: --

P: --

U.S. EIA Short-Term Crude Production Forecast For The Next Year (Dec)

--

F: --

P: --

EIA Monthly Short-Term Energy Outlook
U.S. API Weekly Gasoline Stocks

--

F: --

P: --

U.S. API Weekly Cushing Crude Oil Stocks

--

F: --

P: --

U.S. API Weekly Crude Oil Stocks

--

F: --

P: --

U.S. API Weekly Refined Oil Stocks

--

F: --

P: --

South Korea Unemployment Rate (SA) (Nov)

--

F: --

P: --

Japan Reuters Tankan Non-Manufacturers Index (Dec)

--

F: --

P: --

Japan Reuters Tankan Manufacturers Index (Dec)

--

F: --

P: --

Japan Domestic Enterprise Commodity Price Index MoM (Nov)

--

F: --

P: --

Japan Domestic Enterprise Commodity Price Index YoY (Nov)

--

F: --

P: --

China, Mainland PPI YoY (Nov)

--

F: --

P: --

Q&A with Experts
    • All
    • Chatrooms
    • Groups
    • Friends
    Connecting
    .
    .
    .
    Type here...
    Add Symbol or Code

      No matching data

      All
      Trump Updates
      Recommend
      Stocks
      Cryptocurrencies
      Central Banks
      Featured News
      • All
      • Russia-Ukraine Conflict
      • Middle East Flashpoint
      • All
      • Russia-Ukraine Conflict
      • Middle East Flashpoint
      Search
      Products

      Charts Free Forever

      Chats Q&A with Experts
      Screeners Economic Calendar Data Tools
      Membership Features
      Data Warehouse Market Trends Institutional Data Policy Rates Macro

      Market Trends

      Market Sentiment Order Book Forex Correlations

      Top Indicators

      Charts Free Forever
      Markets

      News

      News Analysis 24/7 Columns Education
      From Institutions From Analysts
      Topics Columnists

      Latest Views

      Latest Views

      Trending Topics

      Top Columnists

      Latest Update

      Signals

      Copy Rankings Latest Signals Become a signal provider AI Rating
      Contests
      Brokers

      Overview Brokers Assessment Rankings Regulators News Claims
      Broker listing Forex Brokers Comparison Tool Live Spread Comparison Scam
      Q&A Complaint Scam Alert Videos Tips to Detect Scam
      More

      Business
      Events
      Careers About Us Advertising Help Center

      White Label

      Data API

      Web Plug-ins

      Affiliate Program

      Awards Institution Evaluation IB Seminar Salon Event Exhibition
      Vietnam Thailand Singapore Dubai
      Fans Party Investment Sharing Session
      FastBull Summit BrokersView Expo
      Recent Searches
        Top Searches
          Markets
          News
          Analysis
          User
          24/7
          Economic Calendar
          Education
          Data
          • Names
          • Latest
          • Prev

          View All

          No data

          Scan to Download

          Faster Charts, Chat Faster!

          Download App
          English
          • English
          • Español
          • العربية
          • Bahasa Indonesia
          • Bahasa Melayu
          • Tiếng Việt
          • ภาษาไทย
          • Français
          • Italiano
          • Türkçe
          • Русский язык
          • 简中
          • 繁中
          Open Account
          Search
          Products
          Charts Free Forever
          Markets
          News
          Signals

          Copy Rankings Latest Signals Become a signal provider AI Rating
          Contests
          Brokers

          Overview Brokers Assessment Rankings Regulators News Claims
          Broker listing Forex Brokers Comparison Tool Live Spread Comparison Scam
          Q&A Complaint Scam Alert Videos Tips to Detect Scam
          More

          Business
          Events
          Careers About Us Advertising Help Center

          White Label

          Data API

          Web Plug-ins

          Affiliate Program

          Awards Institution Evaluation IB Seminar Salon Event Exhibition
          Vietnam Thailand Singapore Dubai
          Fans Party Investment Sharing Session
          FastBull Summit BrokersView Expo

          Crypto's Connections To The Rest Of The Financial System

          Winkelmann

          Forex

          Cryptocurrency

          Summary:

          Cryptocurrency markets have surged in recent years, in part fuelled by the Trump administration's pro-crypto stance which has encouraged wider acceptance among financial institutions.

          Key points:

          · Soaring crypto markets highlight mainstream finance links
          · Regulators worry run on stablecoins could hit stability
          · Stock market, bank exposure to crypto small but growing

          Cryptocurrency markets have surged in recent years, in part fuelled by the Trump administration's pro-crypto stance which has encouraged wider acceptance among financial institutions.

          With a total value of $3.2 trillion and around $197 billion of trading volume per day, cryptocurrencies represent a small part of global markets, crypto tracker CoinGecko estimates.

          But regulators and investors are still worried about whether any problems in the lightly regulated crypto world could spill over into the wider financial system.

          The biggest cryptocurrency, bitcoin, fell below $90,000 for the first time since April this week, and some $1.2 trillion has been wiped off the value of all cryptocurrencies in six weeks.

          Bitcoin, generally moves in line with broader risk appetite. Its correlation with the S&P 500 on a one-month rolling basis this week was 0.84, its strongest in six weeks, LSEG data shows. Correlation is measured from -1 to 1.

          Here's where crypto and mainstream markets intersect.

          STABLECOIN RESERVES

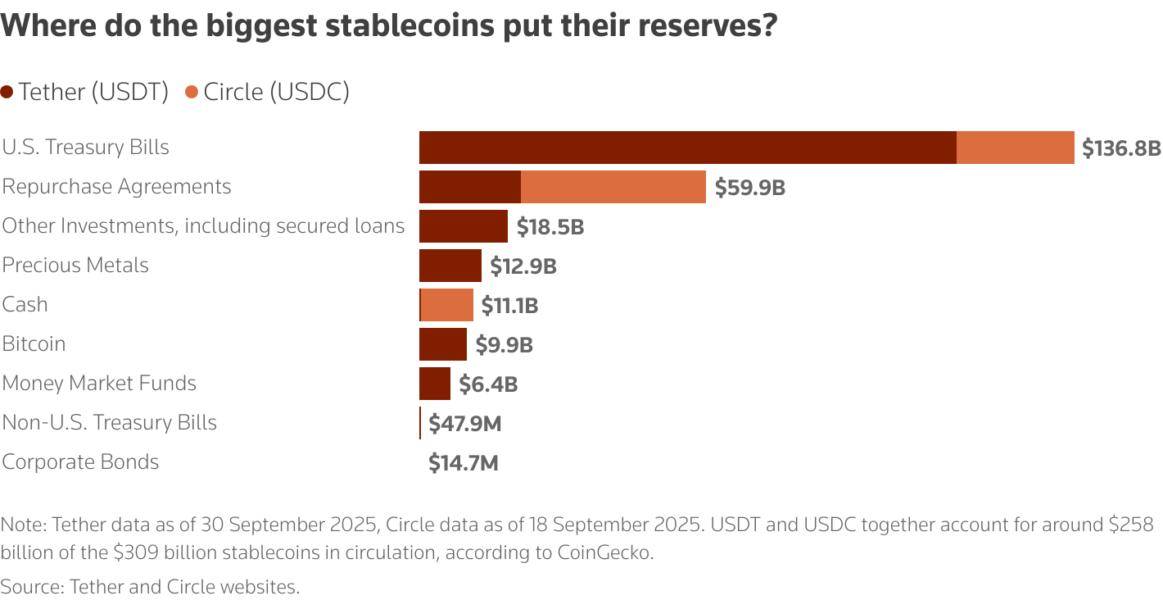
          Stablecoins are cryptocurrencies pegged to a real-world currency, usually the U.S. dollar. Stablecoin issuers hold reserves to match the number of tokens they have created, and say that token-holders can swap their stablecoins back into dollars on demand.

          Financial stability experts warn that a rush of redemption requests would cause a run on these reserves, affecting banks where cash is deposited, or even the assets that the reserves are invested in.

          The stablecoin market is dominated by El Salvador-based Tether, which has around $181 billion in reserves, of which $112 billion is held in U.S. Treasuries. Rival Circle holds $24 billion in U.S. Treasuries.

          Thomson ReutersWhere do the biggest stablecoins put their reserves?

          CRYPTO-RELATED STOCKS

          Crypto stocks have soared in 2025, and more crypto companies have gone public. But pure players remain a tiny part of the overall market.

          The market cap of stocks in the "blockchain and cryptocurrency" and "cryptocurrency mining" category is $225 billion, just 1.8% of the global equities market, LSEG data shows.

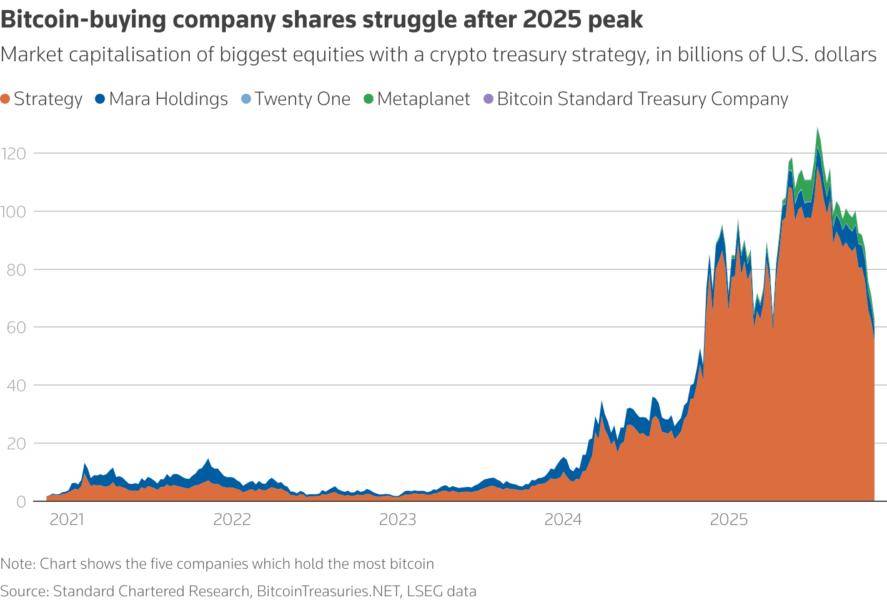
          This excludes so-called crypto treasury companies, whose business model is to buy and hold crypto. While the bitcoin buyers include major players like Strategy, dozens of penny stocks have this year been taken over by crypto enthusiasts to bet on rising prices.

          Standard Chartered estimates that a bitcoin price below $90,000 leaves half of these companies' corporate treasuries holding bitcoin worth less than they paid for it.

          Four of the 173 new U.S. public listings in 2025 have been crypto companies, raising a combined $1.2 billion, around 3.3% of the total funds raised from U.S. IPOs, LSEG said.

          Thomson ReutersBitcoin-buying company shares struggle after 2025 peak

          BANK EXPOSURE TO CRYPTO

          Banks gain exposure to the crypto world by taking on crypto-linked clients, holding stablecoin reserves, or offering crypto-related services such as asset custody.

          Some small banks specialise in crypto, concentrating the risk, as seen in 2023 when crypto-focused U.S. bank Silvergate Capital collapsed after customers pulled deposits.

          U.S. regulators this year made it easier for banks to engage with crypto-related activities, pressuring regulators elsewhere to rethink their approach.

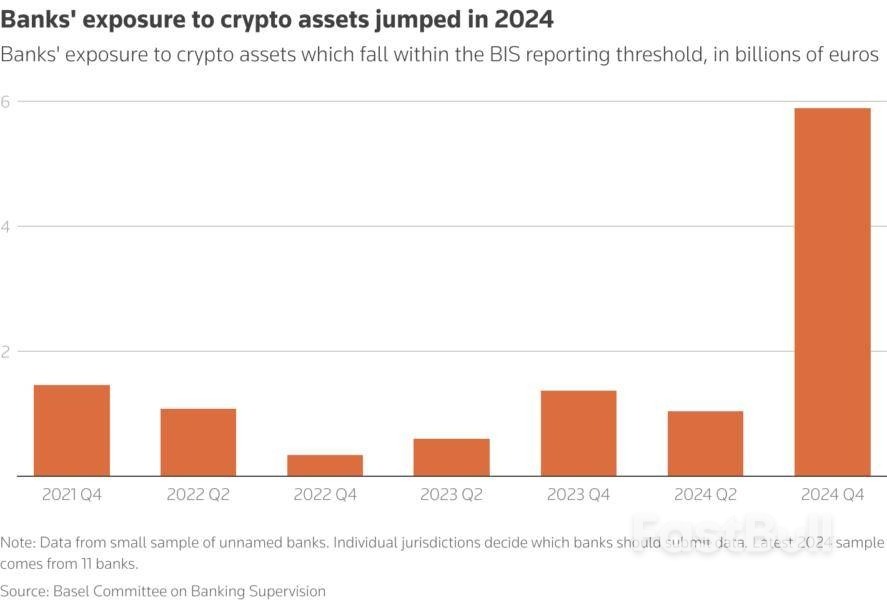
          Data on banks' exposure is hard to find, but what is available suggests it is small but growing.

          The European Central Bank said in a May review that significant institutions in the euro zone provided 4.7 billion euros worth of crypto asset custody services in 2024, up from 400 million euros in 2023.

          Basel Committee on Banking Supervision data shows 5.9 billion euros worth of prudential exposure to crypto in the second half of 2024, among banks from countries which volunteered data.

          Thomson ReutersBanks' exposure to crypto assets jumped in 2024

          CRYPTO INVESTMENT FUNDS

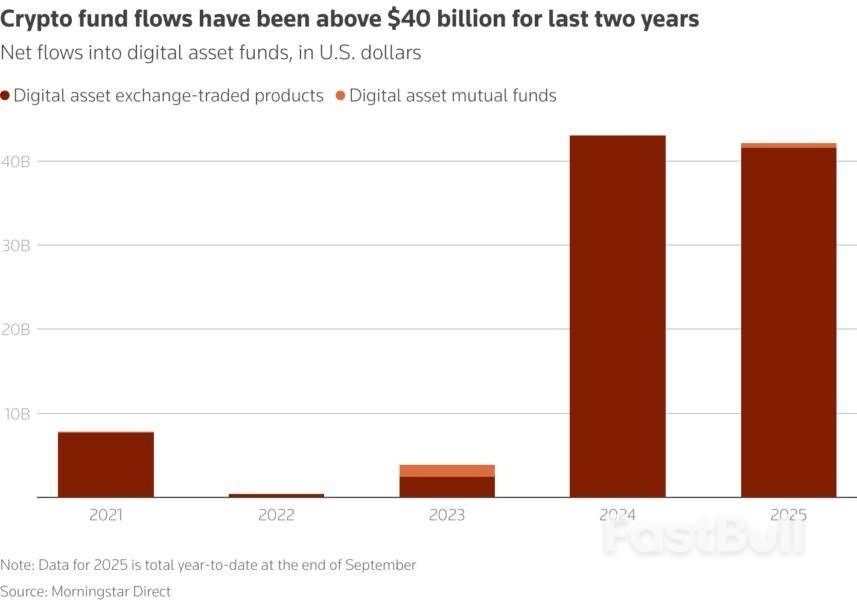
          The January 2024 decision by U.S. regulators to allow bitcoin exchange-traded funds unleashed a new wave of buyers, including institutional investors such as sovereign wealth funds and pension funds pouring money into crypto.

          The number of digital asset exchange-traded products worldwide has surged to 367 in 2025, up from 104 in 2021, according to Morningstar Direct data.

          Still, with $222.3 billion in assets under management, crypto ETPs are tiny compared to the $17.4 trillion managed by the world's non-crypto ETPs, Morningstar estimates.

          Thomson ReutersCrypto fund flows have been above $40 billion for last two years

          Source: TradingView

          Risk Warnings and Disclaimers
          You understand and acknowledge that there is a high degree of risk involved in trading. Following any strategies or investment methods may lead to potential losses. The content on the site is provided by our contributors and analysts for information purposes only. You are solely responsible for determining whether any trading assets, securities, strategy, or any other product is suitable for investing based on your own investment objectives and financial situation.
          Add to Favorites
          Share

          Euro Area Business Activity Remains Solid as EUR/USD Hovers Near Key Levels

          Adam

          Forex

          Provisional PMI data for November shows that business activity in the eurozone is still growing strongly, and companies are feeling optimistic about the upcoming year.
          However, there are some mixed signals: the growth of new orders has slowed down, and businesses stopped hiring new workers after a brief increase in October.
          Financially, companies are facing higher expenses. Their operating costs rose at the fastest speed in eight months, largely due to higher prices in manufacturing. Despite these rising costs, businesses only raised their own prices slightly, the smallest increase for customers in over a year.
          Euro Area Business Activity Remains Solid as EUR/USD Hovers Near Key Levels_1

          For all market-moving economic releases and events, see the MarketPulse Economic Calendar.

          The eurozone economy continued to show solid growth in November, although the momentum remains uneven across sectors.
          Overall Activity: The Composite PMI Output Index posted at 52.4, signaling a solid monthly rise in business activity, marking the 11th consecutive month of growth. This rate of expansion is among the sharpest seen in the last two and a half years.
          Sector Divide: Growth was driven almost entirely by the service sector, which expanded at its fastest pace in a year and a half. In contrast, manufacturing production increased only slightly, tying for the slowest rate in the current nine-month growth sequence.
          New Orders: While new orders rose for the fourth month in a row, the rate of growth slowed down. This was largely due to weak international demand, as export orders (including trade within the eurozone) decreased again.
          On the inflation front, input costs rose at the fastest rate since March, but output price inflation eased to its lowest level in just over a year. Business sentiment edged higher in November, signaling improving confidence despite softer demand indicators.

          Euro Area Q3 Negotiated Wages

          The European Central Bank's survey of negotiated wages for the third quarter came in well below expectations with a print of 1.87% YoY vs estimates of 2.45%. The ECB and market participants had been hoping for a better number which would have shown that real wages are rising which would lead to solid demand in 2026.
          This will now be something the ECB will monitor moving forward and lines up with some of the concerns around demand raised by the PMI data.

          Technical Analysis - EUR/USD

          Looking at EUR/USD from a technical standpoint, the pair appears on course to print a fresh lower low.
          EUR/USD has largely been driven by US Dollar developments of late and the one concern may hinge on the price action of the US Dollar Index.
          The Dollar index has peaked above the psychological 100.00 mark but has printed what looks like a double top pattern.
          If the Dollar index begins to drop this could scupper the move for EUR/USD to print a fresh lower low and EUR/USD coil revisit the recent swing high at 1.1650.
          EUR/USD Daily Chart, November 21, 2025
          Euro Area Business Activity Remains Solid as EUR/USD Hovers Near Key Levels_2
          Support
          1.1500
          1.1450 (key pivot level)
          1.1405 (200-day MA)
          Resistance
          1.1585
          1.1650
          1.1700

          Looking Ahead

          Later in the day we have several central bank officials are scheduled to speak today, most notably ECB President Christine Lagarde at a conference in Frankfurt. Since the event focuses on the benefits of investing in Europe, Lagarde may discuss the idea of strengthening the Euro's role on the world stage. Recent reports suggest the ECB is considering a plan to let central banks outside the eurozone access Euros more easily.
          This strategy is designed to make countries more comfortable using the Euro for international trade, similar to a method China has used for its currency and to boost the Euro's global standing.

          Source: marketpulse

          Risk Warnings and Disclaimers
          You understand and acknowledge that there is a high degree of risk involved in trading. Following any strategies or investment methods may lead to potential losses. The content on the site is provided by our contributors and analysts for information purposes only. You are solely responsible for determining whether any trading assets, securities, strategy, or any other product is suitable for investing based on your own investment objectives and financial situation.
          Add to Favorites
          Share

          BCA On The State Of Geopolitics: ’Trump Tests Allies … Allies Test Trump’

          James Whitman

          Political

          Geopolitical tensions are rising even as the United States under President Donald Trump pursues negotiations with Russia and China, according to BCA Research.

          In a new report, the firm's Chief Geopolitical Strategist Matt Gertken said U.S. talks with both powers "have triggered a spike in EU–Russia tensions and Sino–Japanese tensions," with Europe, China and Japan facing "temporary hits to their exports and economies," while the U.S. remains "relatively aloof" from the fallout.

          BCA Research warned that "Russia–NATO tensions point to a near-term military incident and spike in volatility," even as diplomatic channels remain open.

          The firm stated that the U.S. and Russia are working on a new peace proposal for Ukraine, described as a "28-point plan devised between President Trump's top negotiator Steve Witkoff and his Russian counterpart, Kirill Dimitriev."

          The plan reportedly covers the war, Ukraine's security guarantees, European security and the future of U.S.–Russia relations.

          Despite cutting its ceasefire odds from 65% to 55% in October, BCA Research said a truce remains "more likely than not over the coming 12 months."

          Russia, Gertken argued, has incentives to wind down the conflict as President Vladimir Putin faces "peak" approval levels that are "likely to fall going forward."

          Declaring victory and stabilizing the economy is "the only chance to prevent it from collapsing to destabilizing lows," according to BCA.

          Economic pressures are said to be mounting. BCA Research noted that Russian oil production is down 10% from its pre-COVID peak, natural gas output is down 15%, and China's imports of Russian oil have fallen 27% since 2024. India has also signaled it may curtail Russian imports to secure U.S. tariff relief.

          Against this backdrop, BCA Research advised investors to "stay overweight U.S. assets and long Japanese yen."

          Source: Investing

          Risk Warnings and Disclaimers
          You understand and acknowledge that there is a high degree of risk involved in trading. Following any strategies or investment methods may lead to potential losses. The content on the site is provided by our contributors and analysts for information purposes only. You are solely responsible for determining whether any trading assets, securities, strategy, or any other product is suitable for investing based on your own investment objectives and financial situation.
          Add to Favorites
          Share

          AI Sell-Off Hits Asia: Nvidia Fails to Stop Global Tech Rout as Valuation Fears Deepen

          Gerik

          Economic

          Stocks

          Nvidia's Optimism Can't Stop Wall Street Reversal or Asian Tech Contagion

          Asian tech stocks plunged on November 21 as the AI-led rally unraveled, following a major intraday reversal on Wall Street. The Kospi dropped as much as 4.2%, the Taiwan Taiex fell 3.1% its deepest drop since April and Japan’s Nikkei 225 lost over 2%, led by sharp declines in chipmakers and AI-linked firms. This regional downturn echoed the collapse of confidence in the U.S., where Nvidia, despite strong earnings and a positive forecast, could not prevent the S&P 500 from hitting a two-month low.
          Nvidia shares fell 3.2% overnight, signaling that bullish fundamentals were insufficient to offset market-wide valuation anxiety. While Nvidia momentarily reassured investors, the rebound quickly faded, with selling pressure spilling into global markets and cryptocurrencies.

          AI Valuation Skepticism Fuels Sharp Rotation into Risk-Off Mode

          The magnitude of the pullback underscores a growing concern: that AI optimism may have inflated asset prices beyond their underlying earnings capacity. This concern is now causally linked to massive profit-taking and de-risking, particularly in sectors most exposed to the AI theme.
          Jung In Yun, CEO of Fibonacci Asset Management Global, argued the market is entering a defensive phase not due to a collapse in AI fundamentals, but from risk saturation. Investors are now waiting for further signals from the U.S. Federal Reserve, whose December rate policy remains a key pivot point for global liquidity and sentiment. If the Fed maintains a hawkish stance, risk assets especially high-beta AI stocks may face continued pressure.

          Key Asian Chipmakers Lead Market Decline

          The most significant losses were seen in Nvidia’s key Asian suppliers. TSMC at one point dropped 4.1%, while Samsung Electronics and SK Hynix plummeted 5.5% and 10% respectively. These companies have been prime beneficiaries of AI-driven demand for semiconductors and high-performance memory. However, their outsized gains earlier in the year have now turned them into leading targets during the current correction.
          Japan's SoftBank Group, which has positioned itself as an AI conglomerate, sank as much as 11%. Semiconductor equipment manufacturers such as Kioxia Holdings, Advantest, and Ibiden all fell more than 10%, indicating broad-based sectoral exposure.
          The downturn intensified after U.S.-based Sandisk dropped 20% on reports that Korean firms plan to expand chip production. This triggered a reassessment of future supply-demand balance in memory markets, undermining previously bullish expectations for NAND and DRAM prices.

          High-Flying Kospi Now Exposed to Downside Repricing

          South Korea’s benchmark index had surged more than 60% this year, one of the world’s top performers due to its AI concentration. However, this positioning has become a double-edged sword. The Kospi’s very strength driven by semiconductor, energy, and even nuclear-linked AI stocks now exposes it to amplified downside risk when sentiment turns.
          Amir Anvarzadeh, equity strategist at Asymmetric Advisors, remarked that while memory investments are likely to boom in 2026, the scale of this week's adjustment was unexpected. He emphasized that the memory segment, previously seen as a safe haven due to rising component prices, may no longer offer insulation in a broader market correction.

          AI Sentiment Correction Resets Global Risk Landscape

          The sharp reversal in both U.S. and Asian markets highlights the fragility of current AI-driven valuations. Despite strong earnings, investor psychology has shifted toward caution, with markets repricing risk amid concerns of over-exuberance. With tech-heavy indices like Kospi and Taiex deeply entrenched in AI narratives, they are now the most vulnerable to profit-taking.
          Unless the Fed signals dovish intent or macro data softens significantly, the rotation out of AI and into safer assets could persist. What started as a pause in momentum may now be evolving into a full-fledged sentiment reset. For now, the question is no longer whether AI is transformative but whether market valuations have raced too far ahead of fundamental delivery.

          Source: Bloomberg

          To stay updated on all economic events of today, please check out our Economic calendar
          Risk Warnings and Disclaimers
          You understand and acknowledge that there is a high degree of risk involved in trading. Following any strategies or investment methods may lead to potential losses. The content on the site is provided by our contributors and analysts for information purposes only. You are solely responsible for determining whether any trading assets, securities, strategy, or any other product is suitable for investing based on your own investment objectives and financial situation.
          Add to Favorites
          Share

          Bitcoin at $91,300: extreme fear spikes as big money buys the dip

          Adam

          Cryptocurrency

          Bitcoin is deep into its third 30 % correction of the cycle. After touching $89,310 on November 18, it now trades near $91,500. The Fear & Greed Index has collapsed to 10 —the lowest reading of the year — and sentiment feels entirely flushed.
          The alarm bells are understandable. Bitcoin has now broken levels it never lost earlier in the cycle. It has closed multiple times below three major thresholds: the Short-Term Holder realized price at $110,000, the 200-day moving average at $110,000, and the 365-day moving average at $102,000. In every previous cycle — 2014, 2018, 2022 — simultaneously losing these three levels marked the beginning of a multi-year bear market. That doesn’t guarantee we are in one now, but the risk is becoming increasingly difficult to ignore.

          Bitcoin market signals turn fragile

          Technically, the picture is fragile indeed. On the weekly chart, BTC has slipped below the lower Bollinger Band, with the stochastic oscillator deeply oversold, the MACD negative, and the RSI drifting toward 30. On the daily chart, the 50-day SMA has crossed below the 200-day — the classic death cross that signals fading momentum, even if it typically lags price.
          Support sits at $91,000–$90,000, with a stronger zone at $85,000–$84,000. Resistance remains at $96,000 and the psychological $100,000.
          Derivatives market echoes the sentiment. Thomas Young of Rumjog consultancy points out that bitcoin futures briefly flipped into backwardation — a situation where spot trades above futures. It’s rare and usually appears during stress events, forced de-risking, or capitulation. It is rare and generally emerges during stress, forced unwinding, or capitulation. Historically, backwardation has been a contrarian signal: either a reversal as panic exhausts, or a final washout that marks the bottom of the move.
          Context matters, though. In past cycles, these breakdowns followed vertical blow-off tops and months of euphoric distribution. Nothing like that occurred this time. There was no $200k mania, no media frenzy, no retail stampede. The ~$126k peak (if it was the peak) formed after a slow, institution-led grind. This is potentially good news for bitcoin, as institutions don’t appear ready to dump it just yet.

          Big players buy the dip

          One concern during this correction has been heavy selling from early bitcoin whales — entities holding at least 1,000 BTC. As Capriole fund’s Charles Edwards notes, 2025 has been a year where long-dormant whales, holding coins for seven years or more, have begun cashing out.
          Bitcoin at $91,300: extreme fear spikes as big money buys the dip_1
          Historically, when long-term whales sold in size, steeper declines usually followed. This cycle, however, a new dynamic is at play: large institutional buyers are absorbing the supply.
          CryptoQuant’s CEO argues that the sell-off reflects old holders rotating into new institutional ones. OG whales have been selling, but ETFs, MSTR, corporate treasuries, sovereign funds, pension funds, and multi-asset managers now provide constant inflows. “The cycle theory is dead until these liquidity channels stop running,” he writes.
          On-chain data from Glassnode shows the whale count spiking at the fastest pace since early 2024. After bottoming on October 26, whale numbers jumped from 1,353 to 1,391, signaling a wave of newly formed large holders.
          Bitcoin at $91,300: extreme fear spikes as big money buys the dip_2
          ETF flows are also holding up. Bloomberg ETF analyst Eric Balchunas notes that US Bitcoin ETFs saw $250m in outflows on Monday and $3bn over the past month —approximately 2.5% of assets. That still leaves 97.5% untouched and $23bn in net inflows this year — “not too bad,” considering the current extreme fear mood.Fresh liquidity continues to flow. Strategy Inc. (MSTR) launched its new euro-denominated 10% preferred stock, STRE, on November 3. Initially targeting €350m, the company ultimately raised $700m, extending its corporate-credit engine into Europe and reinforcing bitcoin-linked flows. El Salvador also joined the dip-buyers, adding another $100m to its national treasury on November 17.
          The market is clearly stressed. It is equally clear that large institutions are accumulating into that stress. As early adopters give way to Wall Street, the structure of the bitcoin market and the nature of its cycles are evolving.

          Source: marketscreener

          Risk Warnings and Disclaimers
          You understand and acknowledge that there is a high degree of risk involved in trading. Following any strategies or investment methods may lead to potential losses. The content on the site is provided by our contributors and analysts for information purposes only. You are solely responsible for determining whether any trading assets, securities, strategy, or any other product is suitable for investing based on your own investment objectives and financial situation.
          Add to Favorites
          Share

          U.S. Treasury Yields Dip as Market Awaits Fed Signals and Economic Clarity

          Gerik

          Economic

          Yields Ease Amid Mixed Economic Signals

          U.S. Treasury yields ticked lower on Friday morning as traders continued to assess the implications of recent economic data and awaited commentary from key Federal Reserve officials. The 10-year Treasury yield fell over 2 basis points to 4.075%, while the 2-year yield dropped more sharply by 5.3 basis points to 3.505%. The longer-dated 30-year yield also edged lower to 4.709%.
          These shifts reflect cautious positioning ahead of potentially pivotal insights from Fed officials and upcoming economic data prints, including the University of Michigan’s Consumer Sentiment Index and S&P Global’s Manufacturing PMI. The market is searching for clearer guidance on whether the Fed will maintain its current interest rate stance into early 2026 or pivot toward easing.

          September Jobs Data Complicates Fed Outlook

          Thursday’s delayed non-farm payrolls report painted a mixed picture. The U.S. added more jobs than forecast for September, suggesting underlying labor market resilience. However, the unemployment rate rose to 4.4% the highest since October 2021 highlighting possible soft spots in labor demand.
          The causal relationship between labor market data and Treasury yields is evident: better-than-expected job creation can push yields higher on fears of tighter monetary policy, but a simultaneous rise in unemployment introduces ambiguity, prompting modest declines in yields as traders hedge both inflation and recession risks.

          Rate Cut Odds Recede Further

          In response to the data, investor expectations for a December rate cut have declined. According to the CME FedWatch tool, markets now assign only a 35.1% probability of a cut next month, down sharply from previous estimates. This decline signals a growing belief that the Fed will keep rates on hold longer to ensure inflation continues its retreat toward the 2% target.
          The falling likelihood of a near-term rate cut is supporting short-term yields but keeping longer-term yields relatively contained, reflecting uncertainty around growth prospects and the eventual policy pivot.

          Upcoming Fed Speeches and Data May Steer Markets

          Markets are also watching for potential policy clues from scheduled appearances by Fed Governor Michael S. Barr and Vice Chair Philip N. Jefferson on Friday. While neither is expected to signal an imminent policy shift, their tone may influence expectations for early 2026.
          Alongside central bank rhetoric, Friday’s upcoming release of the University of Michigan Consumer Sentiment Index and S&P Global’s flash Manufacturing PMI will provide more granular insight into household confidence and industrial activity two areas that could either reinforce or challenge the Fed’s current pause.
          Friday’s modest decline in Treasury yields reflects a market caught between signs of economic resilience and emerging signs of slack. With the Fed expected to stay on the sidelines in December, traders are now parsing speeches and data for hints about the 2026 rate path. For now, bond markets are holding their breath, awaiting a clearer signal on whether disinflation, slowing growth, or a resurgent labor market will take the lead in shaping monetary policy.

          Source: CNBC

          To stay updated on all economic events of today, please check out our Economic calendar
          Risk Warnings and Disclaimers
          You understand and acknowledge that there is a high degree of risk involved in trading. Following any strategies or investment methods may lead to potential losses. The content on the site is provided by our contributors and analysts for information purposes only. You are solely responsible for determining whether any trading assets, securities, strategy, or any other product is suitable for investing based on your own investment objectives and financial situation.
          Add to Favorites
          Share

          Dollar hedging frenzy fades, bringing relief to greenback

          Adam

          Forex

          Just months after a U.S. tariff shock whacked the dollar, a rush by overseas investors to protect U.S. holdings from the sliding currency has slowed sharply - a vote of confidence that's helping the greenback recover from its worst rout in years.
          While analysts say investor hedging is higher than it has been historically, such activity has slowed from the period immediately after the April 2 "Liberation Day", when U.S. President Donald Trump announced sweeping trade tariffs.
          At that time, foreign investors holding U.S. assets were hit by tumbling stock and bond prices and a plummeting dollar. Nimble investors moved to hedge against a further dollar decline and the trend was expected to gain momentum. Instead, it has slowed, allowing the U.S. currency to stabilise.
          "The conversations we're having with clients now suggest that these (hedging) flows are less likely to come as imminently as the conversations we had back in May suggested they would," said David Leigh, Nomura's global head of FX and emerging markets.
          The dollar index , which tracks the greenback against other major currencies, has rallied nearly 4% since the end of June, when it was nursing losses of almost 11% after its biggest first-half dive since the early 1970s.
          Dollar hedging frenzy fades, bringing relief to greenback_1

          Chart shows the dollar index since mid 2024

          Data on hedging is limited and analysts extrapolate from scarce public figures and numbers compiled by banks and custodians.
          Analysis of client positioning by BNY, one of the world's largest custodians, shows they were very long U.S. assets in early 2025, suggesting they didn't anticipate much additional dollar weakness and were happy to operate without much hedging.
          That changed in April and hedging is now higher than normal, although lower than in late 2023 when markets began to anticipate Federal Reserve rate cuts.
          "The dollar diversification story this year is more talked about than actioned upon," said Geoff Yu, BNY's senior market strategist.
          Dollar hedging frenzy fades, bringing relief to greenback_2

          Chart uses BNY data showing their clients' dollar positioning

          Other giant custodians reported a similar picture.
          State Street Markets' analysis of the assets State Street has under custody and administration showed that as of end October, foreign equity managers’ hedging of their dollar holdings was 24%, a 4 percentage-point increase since February, but well below the 30%-plus hedge ratio they have seen in the past.
          They too said it had slowed in recent weeks.
          It varies by market too. A November National Australia Bank survey of Australian pension funds found "no material change in hedging behaviour towards U.S. equities".
          Danish central bank data, however, shows hedging by pension funds there has stabilised after increasing post-April.
          Columbia Threadneedle CIO William Davies said that the firm initially moved to protect its U.S. stock holdings against further dollar weakness but has since unwound some of its hedges, betting the currency won't decline further.
          NO SNOWBALL EFFECT
          Hedging itself causes currencies to move - adding protection against dollar downside to a previously unhedged position effectively involves selling the greenback, and vice versa.
          If combined with shifting interest rates, the effect can be dramatic - a dollar selloff can spark more hedging, sending it lower still.
          "People, earlier this year, were getting excited that this snowball effect would develop, though in the end it didn't really," said HSBC's Paul Mackel, global head of FX research.
          For next year, "it's something to keep an eye on, but it's not our baseline scenario".
          Still investor behaviour may be shifting. BlackRock estimates that 38% of flows into Europe, Middle East and Africa-listed U.S. equity exchange-traded products this year have been into those with FX hedges, a meaningful change from 2024 when 98% of flows were unhedged.
          COST, CORRELATIONS AND COMPLICATIONS
          Cost is also a factor, and depends on rate differentials and so varies by market. This may help explain some of the reluctance to hedge positions.
          Japanese investors pay around an annualised 3.7% to hedge against dollar weakness, estimates Van Luu, Russell Investments' global head of solutions strategy for fixed income and FX.
          This is a sizeable sum - if dollar/yen holds steady for a year, an investor is down 3.7% versus an unhedged peer. The equivalent cost for a euro-funded investor is around 2%.
          "I have a rule of thumb for euro investors, if the cost is around 1% they don't care much, but if it's 2% then it becomes a factor," Luu said.
          Asset correlations matter too. Traditionally the dollar strengthens when stocks fall, meaning overseas investors are effectively protected on their U.S. positions.
          That did not happen in April, contributing to the hedging rush. This month, the dollar held steady as stocks tumbled again.
          Dollar hedging frenzy fades, bringing relief to greenback_3

          Chart shows S&P 500 and dollar index, flagging times their moves have overlapped

          Change is also complicated for the many investors who aim to outperform a fixed benchmark if that benchmark is unhedged.
          Fidelity International recommends Europe-based investors move gradually towards hedging 50% of their dollar exposure, but Salman Ahmed, head of macro and strategic asset allocation, notes it is a "very involved" process which can require governance and benchmark changes.
          If interest rates move against the dollar and it starts to weaken again, and hedges become cheaper, pressure for change may build.
          "There's still lots of scope for dollar investments to be hedged, whether that comes to pass and how quickly is an open question," said Nomura's Leigh.
          "That's what the FX market's trying to get its head around."
          Reporting by Alun John and Naomi Rovnick; additional reporting by Elisa Martinuzzi; Editing by Dhara Ranasinghe and Kirsten Donovan

          Reuters: source

          Risk Warnings and Disclaimers
          You understand and acknowledge that there is a high degree of risk involved in trading. Following any strategies or investment methods may lead to potential losses. The content on the site is provided by our contributors and analysts for information purposes only. You are solely responsible for determining whether any trading assets, securities, strategy, or any other product is suitable for investing based on your own investment objectives and financial situation.
          Add to Favorites
          Share
          FastBull
          Copyright © 2025 FastBull Ltd

          728 RM B 7/F GEE LOK IND BLDG NO 34 HUNG TO RD KWUN TONG KLN HONG KONG

          TelegramInstagramTwitterfacebooklinkedin
          App Store Google Play Google Play
          Products
          Charts

          Chats

          Q&A with Experts
          Screeners
          Economic Calendar
          Data
          Tools
          Membership
          Features
          Function
          Markets
          Copy Trading
          Latest Signals
          Contests
          News
          Analysis
          24/7
          Columns
          Education
          Company
          Careers
          About Us
          Contact Us
          Advertising
          Help Center
          Feedback
          User Agreement
          Privacy Policy
          Business

          White Label

          Data API

          Web Plug-ins

          Poster Maker

          Affiliate Program

          Risk Disclosure

          The risk of loss in trading financial instruments such as stocks, FX, commodities, futures, bonds, ETFs and crypto can be substantial. You may sustain a total loss of the funds that you deposit with your broker. Therefore, you should carefully consider whether such trading is suitable for you in light of your circumstances and financial resources.

          No decision to invest should be made without thoroughly conducting due diligence by yourself or consulting with your financial advisors. Our web content might not suit you since we don't know your financial conditions and investment needs. Our financial information might have latency or contain inaccuracy, so you should be fully responsible for any of your trading and investment decisions. The company will not be responsible for your capital loss.

          Without getting permission from the website, you are not allowed to copy the website's graphics, texts, or trademarks. Intellectual property rights in the content or data incorporated into this website belong to its providers and exchange merchants.

          Not Logged In

          Log in to access more features

          FastBull Membership

          Not yet

          Purchase

          Become a signal provider
          Help Center
          Customer Service
          Dark Mode
          Price Up/Down Colors

          Log In

          Sign Up

          Position
          Layout
          Fullscreen
          Default to Chart
          The chart page opens by default when you visit fastbull.com