• Trade
  • Markets
  • Copy
  • Contests
  • 24/7
  • Calendar
  • Q&A
  • Chats
Screeners
SYMBOL
LAST
BID
ASK
HIGH
LOW
NET CHG.
%CHG.
SPREAD
SPX
S&P 500 Index
7022.96
7022.96
7022.96
7026.06
6967.98
+55.58
+ 0.80%
--
DJI
Dow Jones Industrial Average
48463.71
48463.71
48463.71
48709.01
48281.62
-72.27
-0.15%
--
IXIC
NASDAQ Composite Index
24016.01
24016.01
24016.01
24026.56
23672.26
+376.92
+ 1.59%
--
USDX
US Dollar Index
97.770
97.770
97.850
97.830
97.740
-0.060
-0.06%
--
EURUSD
Euro / US Dollar
1.18027
1.18027
1.18035
1.18091
1.17962
+0.00041
+ 0.03%
--
GBPUSD
Pound Sterling / US Dollar
1.35696
1.35696
1.35707
1.35753
1.35515
+0.00115
+ 0.08%
--
XAUUSD
Gold / US Dollar
4820.57
4820.57
4821.02
4837.50
4790.57
+30.00
+ 0.63%
--
WTI
Light Sweet Crude Oil
88.001
88.001
88.036
88.144
87.308
-0.240
-0.27%
--

Community Accounts

Signal Accounts
--
Profit Accounts
--
Loss Accounts
--
View More

Become a signal provider

Sell trading signals to earn additional income

View More

Guide to Copy Trading

Get started with ease and confidence

View More

Signal Accounts for Members

All Signal Accounts

Best Return
  • Best Return
  • Best P/L
  • Best MDD
Past 1W
  • Past 1W
  • Past 1M
  • Past 1Y

All Contests

  • All
  • Trump Updates
  • Recommend
  • Stocks
  • Cryptocurrencies
  • Central Banks
  • Featured News
Top News Only
Share

Australia's Unemployment Rate Remains At 4.3%, With A Substantial Increase In Full-time Jobs

Share

Japanese Finance Minister Satsuki Katayama: I Have Informed The G7 That They Are Closely Monitoring Exchange Rate Fluctuations

Share

The South Korean KOSPI Index Rose 2.00% On The Day

Share

The Shenzhen Component Index Rose 1%, The ChiNext Index Rose 1.6%, And The Shanghai Composite Index Rose 0.37%

Share

The Press Conference On China's First-quarter GDP Year-on-Year Growth, March Industrial Value-added Growth For Enterprises Above Designated Size, And March Retail Sales Of Consumer Goods Year-on-Year Will Be Held In Ten Minutes

Share

Hong Kong-listed Solid-state Battery Stocks Surged, With Longpan Technology Rising Nearly 20%, Ganfeng Lithium Up 4.4%, And Tianqi Lithium Up 4%

Share

Hong Kong-listed Lithium Battery Concept Stocks Rallied, With CATL Surging 10% During The Session To Hit A New High, Ganfeng Lithium And Tianqi Lithium Both Up Over 4%, And BYD Shares Up Over 3%

Share

The Main Cotton Futures Contract Rose More Than 2.00% Intraday, Currently Trading At 15,850.00 Yuan/ton

Share

CATL Shares Surged 10% Intraday, Hitting A New All-time High Since Its Listing, With A Total Market Capitalization Of HK$3.29 Trillion

Share

AI Application Stocks In Hong Kong Rose At The Opening Of Trading, With Maifushi Surging Over 12%, Kingdee International Gaining More Than 6%, Baidu And NetEase Rising Over 4%, Kingsoft Software Climbing Nearly 4%, And Alibaba, MINIMAX, And Zhipu Increasing By Over 2%

Share

Preview: The State Council Information Office To Hold A Press Conference On Promoting High-Quality Economic And Social Development During The 15th Five-Year Plan Period

Share

China's Three Major Stock Indices Opened Higher And Continued To Climb, With The ChiNext Index Up 1%, The Shenzhen Component Index Up 0.69%, And The Shanghai Composite Index Up 0.3%. The Titanium Dioxide Sector, Cloud Gaming, And Computing Power Leasing Led The Gains

Share

Hong Kong Stocks Opened Higher And Continued To Rise, With The Hang Seng Tech Index Up 2% And The Hang Seng Index Up 1%. CATL (Contemporary Amperex Technology Co., Limited) Led The Gains Among Constituent Stocks, Rising Nearly 9%

Share

The Main Methanol Futures Contract Rose 2.00% Intraday, Currently Trading At 3176.00 Yuan/ton

Share

According To The National Bureau Of Statistics, The Price Of Second-hand Residential Properties In Shenzhen Rose 0.4% Month-on-month In March (compared To -0.4% In The Previous Month) And Fell 7% Year-on-Year

Share

According To The National Bureau Of Statistics, The Price Of Second-hand Residential Properties In Guangzhou Rose 0.2% Month-on-month In March (compared To -0.5% In The Previous Month) And Fell 8.1% Year-on-Year

Share

According To The National Bureau Of Statistics, The Price Of Second-hand Homes In Shanghai Rose 0.4% Month-on-month In March (compared To 0.2% In The Previous Month) And Fell 6.2% Year-on-Year

Share

According To The National Bureau Of Statistics, The Price Of Second-hand Homes In Beijing Rose 0.6% Month-on-month In March (compared To 0.3% In The Previous Month) And Fell 8.3% Year-on-Year

Share

According To The National Bureau Of Statistics, The Price Of Newly Built Commercial Residential Buildings In Shenzhen Rose 0.2% Month-on-month In March (compared To -0.3% In The Previous Month) And Fell 5.5% Year-on-Year

Share

According To The National Bureau Of Statistics, The Price Of Newly Built Commercial Residential Buildings In Guangzhou Rose 0.3% Month-on-month In March (unchanged In The Previous Month) And Fell 4.7% Year-on-Year

TIME
ACT
FCST
PREV
U.S. MBA Mortgage Application Activity Index WoW

A:--

F: --

P: --

Brazil Retail Sales MoM (Feb)

A:--

F: --

P: --

U.S. NY Fed Manufacturing New Orders Index (Apr)

A:--

F: --

P: --

U.S. NY Fed Manufacturing Employment Index (Apr)

A:--

F: --

P: --

U.S. NY Fed Manufacturing Prices Received Index (Apr)

A:--

F: --

P: --

Canada Manufacturing Unfilled Orders MoM (Feb)

A:--

F: --

P: --

Canada Wholesale Inventory YoY (Feb)

A:--

F: --

P: --

Canada Wholesale Sales MoM (SA) (Feb)

A:--

F: --

P: --
U.S. NY Fed Manufacturing Index (Apr)

A:--

F: --

P: --

Canada Wholesale Inventory MoM (Feb)

A:--

F: --

P: --

Canada Wholesale Sales YoY (Feb)

A:--

F: --

P: --

Canada Manufacturing Inventory MoM (Feb)

A:--

F: --

P: --

U.S. Export Price Index MoM (Mar)

A:--

F: --

P: --
U.S. Import Price Index YoY (Mar)

A:--

F: --

P: --
U.S. Import Price Index MoM (Mar)

A:--

F: --

P: --
U.S. Export Price Index YoY (Mar)

A:--

F: --

P: --

Canada Manufacturing New Orders MoM (Feb)

A:--

F: --

P: --

U.S. NAHB Housing Market Index (Apr)

A:--

F: --

P: --

U.S. EIA Weekly Heating Oil Stock Changes

A:--

F: --

P: --

U.S. EIA Weekly Crude Demand Projected by Production

A:--

F: --

P: --

U.S. EIA Weekly Gasoline Stocks Change

A:--

F: --

P: --

U.S. EIA Weekly Crude Oil Imports Changes

A:--

F: --

P: --

U.S. EIA Weekly Crude Stocks Change

A:--

F: --

P: --

U.S. EIA Weekly Cushing, Oklahoma Crude Oil Stocks Change

A:--

F: --

P: --

BOE Gov Bailey Speaks
Australia Consumer Inflation Expectations (Apr)

A:--

F: --

P: --

Australia Employment (Mar)

A:--

F: --

P: --

Australia Unemployment Rate (SA) (Mar)

A:--

F: --

P: --

Australia Full-time Employment (SA) (Mar)

A:--

F: --

P: --

Australia Labor Force Participation Rate (SA) (Mar)

A:--

F: --

P: --

China, Mainland GDP YoY (Q1)

--

F: --

P: --

China, Mainland GDP (Q1)

--

F: --

P: --

China, Mainland GDP QoQ (SA) (Q1)

--

F: --

P: --

China, Mainland Urban Area Unemployment Rate (Mar)

--

F: --

P: --

China, Mainland GDP YoY (YTD) (Q1)

--

F: --

P: --

China, Mainland Industrial Output YoY (YTD) (Mar)

--

F: --

P: --

U.K. Services Index MoM

--

F: --

P: --

U.K. Construction Output MoM (SA) (Feb)

--

F: --

P: --

U.K. Trade Balance EU (SA) (Feb)

--

F: --

P: --

U.K. Trade Balance (SA) (Feb)

--

F: --

P: --

U.K. Industrial Output YoY (Feb)

--

F: --

P: --

U.K. GDP MoM (Feb)

--

F: --

P: --

U.K. Manufacturing Output YoY (Feb)

--

F: --

P: --

U.K. Manufacturing Output MoM (Feb)

--

F: --

P: --

U.K. Industrial Output MoM (Feb)

--

F: --

P: --

U.K. Monthly GDP 3M/3M Change (Feb)

--

F: --

P: --

U.K. Trade Balance (Feb)

--

F: --

P: --

U.K. Trade Balance Non-EU (SA) (Feb)

--

F: --

P: --

U.K. GDP YoY (SA) (Feb)

--

F: --

P: --

U.K. Construction Output YoY (Feb)

--

F: --

P: --

Euro Zone CPI YoY (Excl. Tobacco) (Mar)

--

F: --

P: --

Canada Existing Home Sales MoM (Mar)

--

F: --

P: --

Euro Zone Core CPI Final MoM (Mar)

--

F: --

P: --

U.S. Weekly Initial Jobless Claims (SA)

--

F: --

P: --

U.S. Philadelphia Fed Manufacturing Employment Index (Apr)

--

F: --

P: --

U.S. Weekly Continued Jobless Claims (SA)

--

F: --

P: --

U.S. Initial Jobless Claims 4-Week Avg. (SA)

--

F: --

P: --

U.S. Philadelphia Fed Business Activity Index (SA) (Apr)

--

F: --

P: --

New York Federal Reserve President Williams delivered a speech.
U.S. Industrial Output MoM (SA) (Mar)

--

F: --

P: --

U.S. Capacity Utilization MoM (SA) (Mar)

--

F: --

P: --

Q&A with Experts
    • All
    • Chatrooms
    • Groups
    • Friends
    Kung Fu flag
    srinivas
    Good morning 4830, It is a clear buy signal for gold
    @srinivasokay. I'll fixate my attention on this
    rawa ronte flag
    srinivas
    Good morning 4830, It is a clear buy signal for gold
    @srinivasoke gass oke gass
    Kung Fu flag
    rawa ronte
    @srinivasoke gass oke gass
    @rawa rontehey, where have you been? Long time...
    Kung Fu flag
    srinivas
    it will break 4869
    @srinivasit's gonna go below 4820 for the low
    srinivas flag
    Kung Fu
    @srinivasit's gonna go below 4820 for the low
    @Kung Fu4869 is the first target and the next will reach 4921
    srinivas flag
    so it is a long movement
    Kung Fu flag
    srinivas
    @Kung Fu4869 is the first target and the next will reach 4921
    @srinivasyes, I agree. This is talking about the general intraday outlook. Correct?
    3792768 flag
    4827干多了
    Kung Fu flag
    3792768
    4827干多了
    @Visitor3792768okay. Nice one. It'll still drop
    srinivas flag
    Kung Fu
    @srinivasyes, I agree. This is talking about the general intraday outlook. Correct?
    @Kung Fu it will work and any one shorting gold will surprise themselves
    Kung Fu flag
    srinivas
    @Kung Fu it will work and any one shorting gold will surprise themselves
    @srinivaslet's see how it goes. It's already below the 4830 you suggested was the buy entry price
    Kung Fu flag
    Kung Fu
    @srinivasit's gonna go below 4820 for the low
    @srinivastold you it's gonna go below 4820
    srinivas flag
    Kung Fu
    @srinivaslet's see how it goes. It's already below the 4830 you suggested was the buy entry price
    @Kung Fu sweep happened, now comes the push...
    Kung Fu flag
    srinivas
    @Kung Fu sweep happened, now comes the push...
    @srinivasinitially you said it was gonna buy from 4830
    Kung Fu flag
    srinivas
    @Kung Fu sweep happened, now comes the push...
    @srinivasI think it's still gonna push further south
    srinivas flag
    Kung Fu
    @srinivasinitially you said it was gonna buy from 4830
    @Kung Fuyes i am long from 4830 and i will buy again fter 8 minutes
    srinivas flag
    i know it is a buy
    Kung Fu flag
    srinivas
    @Kung Fuyes i am long from 4830 and i will buy again fter 8 minutes
    @srinivas4811 is very likely gonna be next stop
    Charizard flag
    man these arguments makes it hard to work out where it's really going.
    Kung Fu flag
    Charizard
    man these arguments makes it hard to work out where it's really going.
    @Charizardthey're not arguments. I give stats, so to say
    Type here...
    Add Symbol or Code

      No matching data

      All
      Trump Updates
      Recommend
      Stocks
      Cryptocurrencies
      Central Banks
      Featured News
      • All
      • Russia-Ukraine Conflict
      • Middle East Flashpoint
      • All
      • Russia-Ukraine Conflict
      • Middle East Flashpoint
      Search
      Products

      Charts Free Forever

      Chats Q&A with Experts
      Screeners Economic Calendar Data Tools
      Membership Features
      Data Warehouse Market Trends Institutional Data Policy Rates Macro

      Market Trends

      Market Sentiment Order Book Forex Correlations

      Top Indicators

      Charts Free Forever
      Markets

      News

      24/7 Analysis Education

      Latest Views

      Latest Update

      Signals

      Copy Rankings Latest Signals Become a signal provider AI Rating
      Contests
      Brokers

      Overview Brokers Assessment Rankings Regulators News Claims
      Broker listing Forex Brokers Comparison Tool Live Spread Comparison Scam
      Q&A Complaint Scam Alert Videos Tips to Detect Scam
      More

      Business
      Events
      Careers About Us Advertising Help Center

      White Label

      Broker API

      Data API

      Web Plug-ins

      Affiliate Program

      Awards Institution Evaluation IB Seminar Salon Event Exhibition
      Vietnam Thailand Singapore Dubai
      Fans Party Investment Sharing Session
      FastBull Summit BrokersView Expo
      Recent Searches
        Top Searches
          Markets
          Analysis
          User
          24/7
          Economic Calendar
          Education
          Data
          • Names
          • Latest
          • Prev

          View All

          No data

          Scan to Download

          Faster Charts, Chat Faster!

          Download App
          English
          • English
          • Español
          • العربية
          • Bahasa Indonesia
          • Bahasa Melayu
          • Tiếng Việt
          • ภาษาไทย
          • Français
          • Italiano
          • Türkçe
          • Русский язык
          • 简中
          • 繁中
          Open Account
          Search
          Products
          Charts Free Forever
          Markets
          News
          Signals

          Copy Rankings Latest Signals Become a signal provider AI Rating
          Contests
          Brokers

          Overview Brokers Assessment Rankings Regulators News Claims
          Broker listing Forex Brokers Comparison Tool Live Spread Comparison Scam
          Q&A Complaint Scam Alert Videos Tips to Detect Scam
          More

          Business
          Events
          Careers About Us Advertising Help Center

          White Label

          Broker API

          Data API

          Web Plug-ins

          Affiliate Program

          Awards Institution Evaluation IB Seminar Salon Event Exhibition
          Vietnam Thailand Singapore Dubai
          Fans Party Investment Sharing Session
          FastBull Summit BrokersView Expo

          CIBC Lifts Gold Forecast to $6,000 on Fed and Dollar Calls

          Winkelmann

          Traders' Opinions

          Central Bank

          Political

          Commodity

          Forex

          Economic

          Summary:

          CIBC predicts sharp gold and silver surges, driven by geopolitical uncertainty and dollar weakness.

          Despite recent volatility shaking the metals market, analysts at Canadian bank CIBC are doubling down on their bullish outlook for gold and silver, expecting prices to climb significantly by year-end.

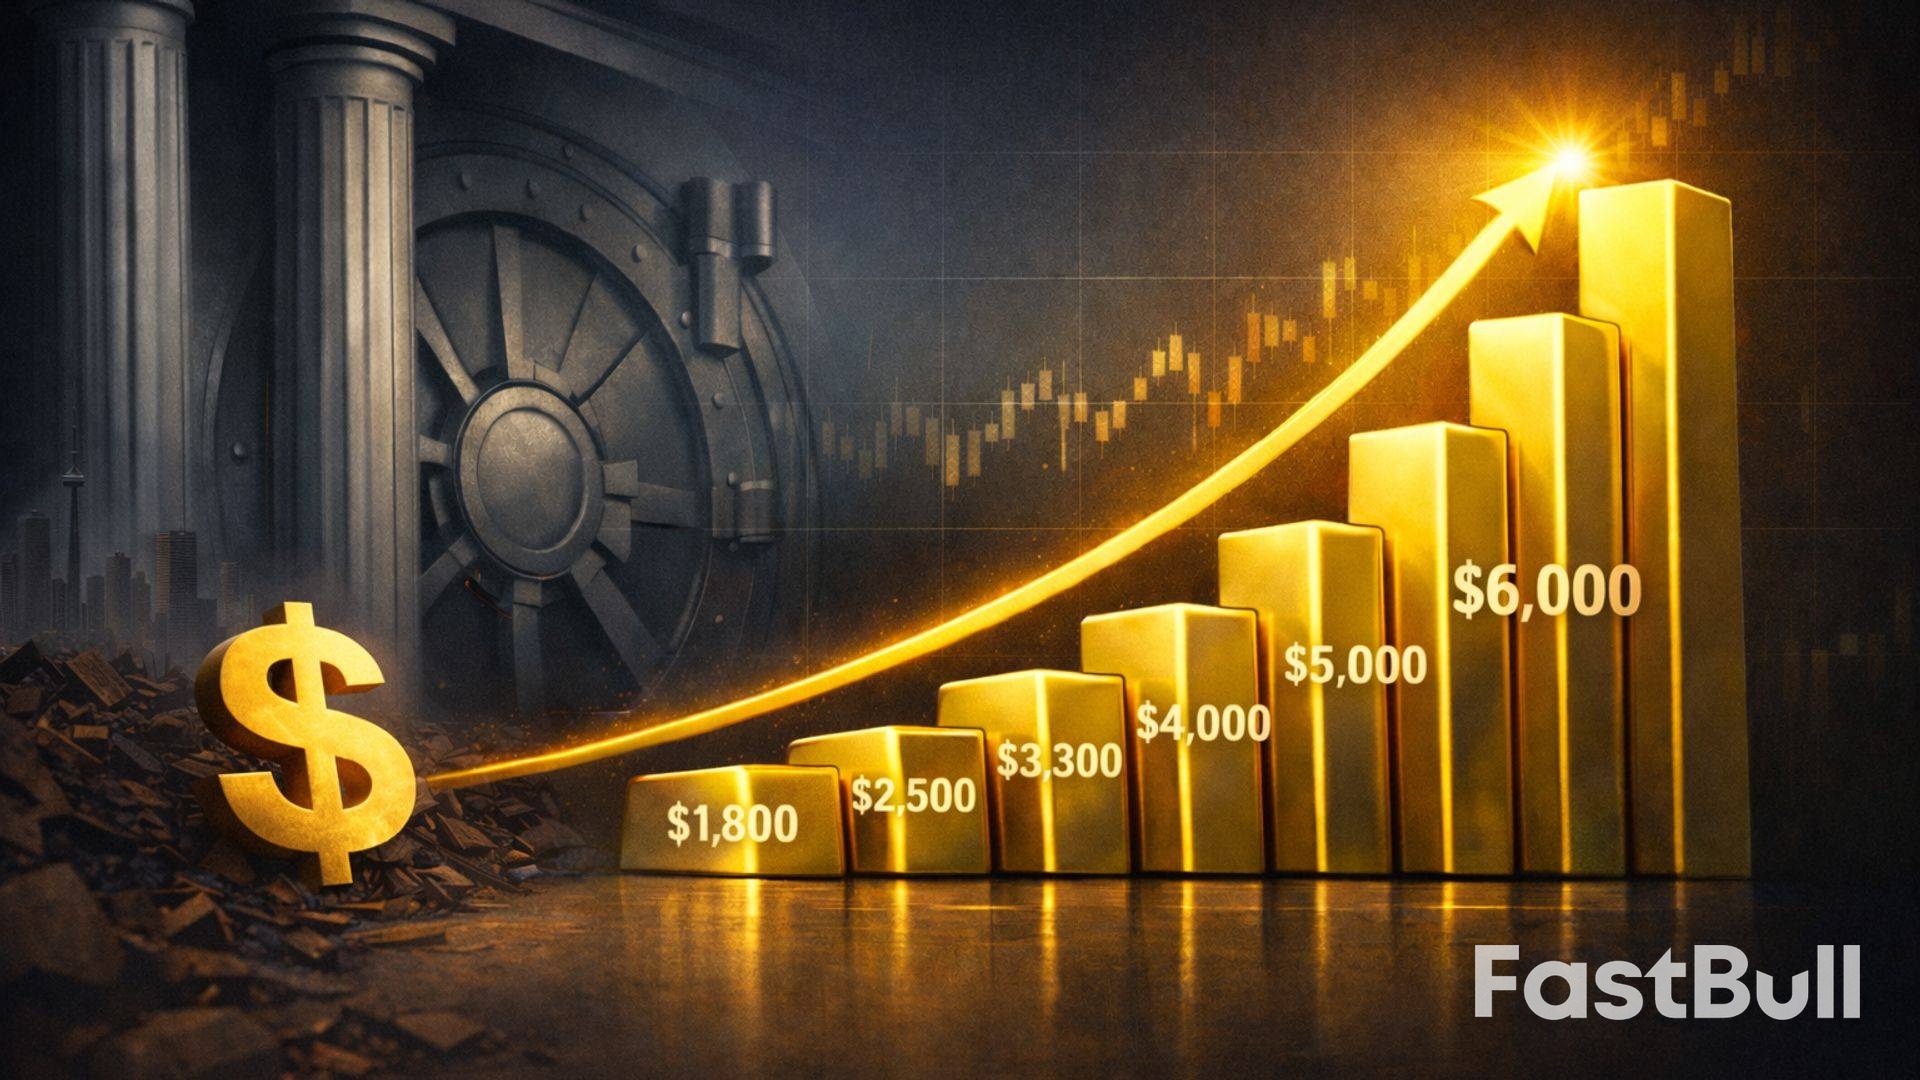
          In a recent report, CIBC’s commodity analysts sharply raised their gold price forecast, projecting an average of $6,000 per ounce this year. This marks a substantial increase from their previous estimate of $4,500 per ounce. The bank sees a continued uptrend, with prices potentially peaking at an average of $6,500 an ounce in 2027.

          The bullish call comes as gold encounters fresh resistance at the $5,000 level and enters a consolidation phase. Spot gold was last trading at $4,863.10 an ounce. For silver, CIBC forecasts an average price of around $105 an ounce this year, rising to $120 an ounce in the next.

          Why CIBC Remains Bullish: Core Catalysts

          According to the bank's analysts, the fundamental drivers that supported precious metals in 2025 are still firmly in place, even with the recent price correction. Two factors stand out:

          • Persistent Geopolitical Uncertainty: This is expected to continue fueling safe-haven demand for gold.

          • Anticipated U.S. Dollar Weakness: This is viewed as a key tailwind that will push gold prices higher.

          Analysts noted that "dollar debasement is likely to persist" as central banks and investors react to heightened uncertainty by quietly shifting allocations away from U.S. treasuries. They also anticipate that rate cuts and ongoing tension between the Federal Reserve and the White House will exert further pressure on the dollar.

          Decoding the Next Fed Chair: A "Dove in Hawk's Clothing"?

          CIBC noted that gold's recent selloff from record highs was triggered by President Donald Trump's announcement that he would nominate Kevin Warsh to replace Jerome Powell as head of the Federal Reserve.

          Markets reacted negatively, expecting Warsh, a former Federal Reserve Governor, to tighten monetary policy. However, CIBC analysts describe Trump's pick as a "dove in hawk's clothing," suggesting the market’s initial reaction was misplaced.

          Their report states, "Mr. Warsh is seemingly more aligned with a dovish stance than last week's negative market reaction would imply." The analysts point out that Warsh has previously argued for tightening the Fed's balance sheet as a method to control inflation, which would then allow for lower interest rates for "Main Street." More recently, he has supported Trump's government efficiency initiatives as another path to temper inflation and enable lower rates.

          Ultimately, CIBC believes that "it is unlikely that any candidate would do anything but guide the Federal Reserve Board to lower rates in 2026."

          The Bigger Picture: A Global Shift from Fiat

          Beyond U.S. monetary policy, CIBC points to the broader trend of global fiat currency debasement as a long-term catalyst for gold demand.

          The report argues that with U.S. Treasuries—the traditional safe-haven asset—no longer considered "risk-free," both investors and central banks are actively seeking alternatives. The options are slim, as most Western economies face near-record debt-to-GDP ratios and are choosing to inflate rather than restrain their way out of the problem.

          This environment has eroded investor confidence in fiat currencies, a trend that has directly fueled a "flight to safety" into gold.

          To stay updated on all economic events of today, please check out our Economic calendar
          Risk Warnings and Disclaimers
          You understand and acknowledge that there is a high degree of risk involved in trading. Following any strategies or investment methods may lead to potential losses. The content on the site is provided by our contributors and analysts for information purposes only. You are solely responsible for determining whether any trading assets, securities, strategy, or any other product is suitable for investing based on your own investment objectives and financial situation.
          Add to Favorites
          Share
          FastBull
          Copyright © 2026 FastBull Ltd

          728 RM B 7/F GEE LOK IND BLDG NO 34 HUNG TO RD KWUN TONG KLN HONG KONG

          TelegramInstagramTwitterfacebooklinkedin
          App Store Google Play Google Play
          Products
          Charts

          Chats

          Q&A with Experts
          Screeners
          Economic Calendar
          Data
          Tools
          Membership
          Features
          Function
          Markets
          Copy Trading
          Latest Signals
          Contests
          24/7
          Analysis
          Education
          Company
          Careers
          About Us
          Contact Us
          Advertising
          Help Center
          Feedback
          User Agreement
          Privacy Policy
          Personal Information Protection Statement
          Business

          White Label

          Broker API

          Data API

          Web Plug-ins

          Poster Maker

          Affiliate Program

          Risk Disclosure

          The risk of loss in trading financial instruments such as stocks, FX, commodities, futures, bonds, ETFs and crypto can be substantial. You may sustain a total loss of the funds that you deposit with your broker. Therefore, you should carefully consider whether such trading is suitable for you in light of your circumstances and financial resources.

          No decision to invest should be made without thoroughly conducting due diligence by yourself or consulting with your financial advisors. Our web content might not suit you since we don't know your financial conditions and investment needs. Our financial information might have latency or contain inaccuracy, so you should be fully responsible for any of your trading and investment decisions. The company will not be responsible for your capital loss.

          Without getting permission from the website, you are not allowed to copy the website's graphics, texts, or trademarks. Intellectual property rights in the content or data incorporated into this website belong to its providers and exchange merchants.

          Not Logged In

          Log in to access more features

          Connect Broker
          Become a signal provider
          Help Center
          Customer Service
          Dark Mode
          Price Up/Down Colors

          Log In

          Sign Up

          Position
          Layout
          Fullscreen
          Default to Chart
          The chart page opens by default when you visit fastbull.com