

Markets
News
Analysis
User
24/7
Economic Calendar
Education
Data
- Names
- Latest
- Prev


Signal Accounts for Members
All Signal Accounts
All Contests
 France Industrial Output MoM (SA) (Oct)
A:--
F: --
France Trade Balance (SA) (Oct)A:--
F: --
 Euro Zone Employment YoY (SA) (Q3)
A:--
F: --
 Canada Part-Time Employment (SA) (Nov)
A:--
F: --
P: --
Canada Unemployment Rate (SA) (Nov)A:--
F: --
P: --
Canada Full-time Employment (SA) (Nov)A:--
F: --
P: --
Canada Labor Force Participation Rate (SA) (Nov)A:--
F: --
P: --
Canada Employment (SA) (Nov)A:--
F: --
P: --
 U.S. PCE Price Index MoM (Sept)
A:--
F: --
P: --
U.S. Personal Income MoM (Sept)A:--
F: --
P: --
U.S. Core PCE Price Index MoM (Sept)A:--
F: --
P: --
U.S. PCE Price Index YoY (SA) (Sept)A:--
F: --
P: --
U.S. Core PCE Price Index YoY (Sept)A:--
F: --
P: --
U.S. Personal Outlays MoM (SA) (Sept)A:--
F: --
U.S. 5-10 Year-Ahead Inflation Expectations (Dec)A:--
F: --
P: --
U.S. Real Personal Consumption Expenditures MoM (Sept)A:--
F: --
U.S. Weekly Total Rig CountA:--
F: --
P: --
U.S. Weekly Total Oil Rig CountA:--
F: --
P: --
U.S. Consumer Credit (SA) (Oct)A:--
F: --
 China, Mainland Foreign Exchange Reserves (Nov)
A:--
F: --
P: --
 Japan Trade Balance (Oct)
A:--
F: --
P: --
Japan Nominal GDP Revised QoQ (Q3)A:--
F: --
P: --
China, Mainland Imports YoY (CNH) (Nov)A:--
F: --
P: --
China, Mainland Exports (Nov)A:--
F: --
P: --
China, Mainland Imports (CNH) (Nov)A:--
F: --
P: --
China, Mainland Trade Balance (CNH) (Nov)A:--
F: --
P: --
China, Mainland Exports YoY (USD) (Nov)A:--
F: --
P: --
China, Mainland Imports YoY (USD) (Nov)A:--
F: --
P: --
 Germany Industrial Output MoM (SA) (Oct)
A:--
F: --
Euro Zone Sentix Investor Confidence Index (Dec)A:--
F: --
P: --
Canada National Economic Confidence Index--
F: --
P: --
 U.K. BRC Like-For-Like Retail Sales YoY (Nov)
--
F: --
P: --
U.K. BRC Overall Retail Sales YoY (Nov)--
F: --
P: --
 Australia Overnight (Borrowing) Key Rate
--
F: --
P: --
RBA Rate Statement RBA Press Conference Germany Exports MoM (SA) (Oct)--
F: --
P: --
U.S. NFIB Small Business Optimism Index (SA) (Nov)--
F: --
P: --
 Mexico 12-Month Inflation (CPI) (Nov)
--
F: --
P: --
Mexico Core CPI YoY (Nov)--
F: --
P: --
Mexico PPI YoY (Nov)--
F: --
P: --
U.S. Weekly Redbook Index YoY--
F: --
P: --
U.S. JOLTS Job Openings (SA) (Oct)--
F: --
P: --
China, Mainland M1 Money Supply YoY (Nov)--
F: --
P: --
China, Mainland M0 Money Supply YoY (Nov)--
F: --
P: --
China, Mainland M2 Money Supply YoY (Nov)--
F: --
P: --
U.S. EIA Short-Term Crude Production Forecast For The Year (Dec)--
F: --
P: --
U.S. EIA Natural Gas Production Forecast For The Next Year (Dec)--
F: --
P: --
U.S. EIA Short-Term Crude Production Forecast For The Next Year (Dec)--
F: --
P: --
EIA Monthly Short-Term Energy Outlook U.S. API Weekly Gasoline Stocks--
F: --
P: --
U.S. API Weekly Cushing Crude Oil Stocks--
F: --
P: --
U.S. API Weekly Crude Oil Stocks--
F: --
P: --
U.S. API Weekly Refined Oil Stocks--
F: --
P: --
 South Korea Unemployment Rate (SA) (Nov)
--
F: --
P: --
Japan Reuters Tankan Non-Manufacturers Index (Dec)--
F: --
P: --
Japan Reuters Tankan Manufacturers Index (Dec)--
F: --
P: --
Japan Domestic Enterprise Commodity Price Index MoM (Nov)--
F: --
P: --
Japan Domestic Enterprise Commodity Price Index YoY (Nov)--
F: --
P: --
China, Mainland PPI YoY (Nov)--
F: --
P: --

No matching data
Latest Views
Latest Views
Trending Topics
Top Columnists
Latest Update
White Label
Data API
Web Plug-ins
Affiliate Program
View All
No data
The Commonwealth Bank of Australia (CBA) is set to cut 45 jobs in a move toward greater artificial intelligence integration, drawing sharp criticism from the Finance Sector Union (FSU)...
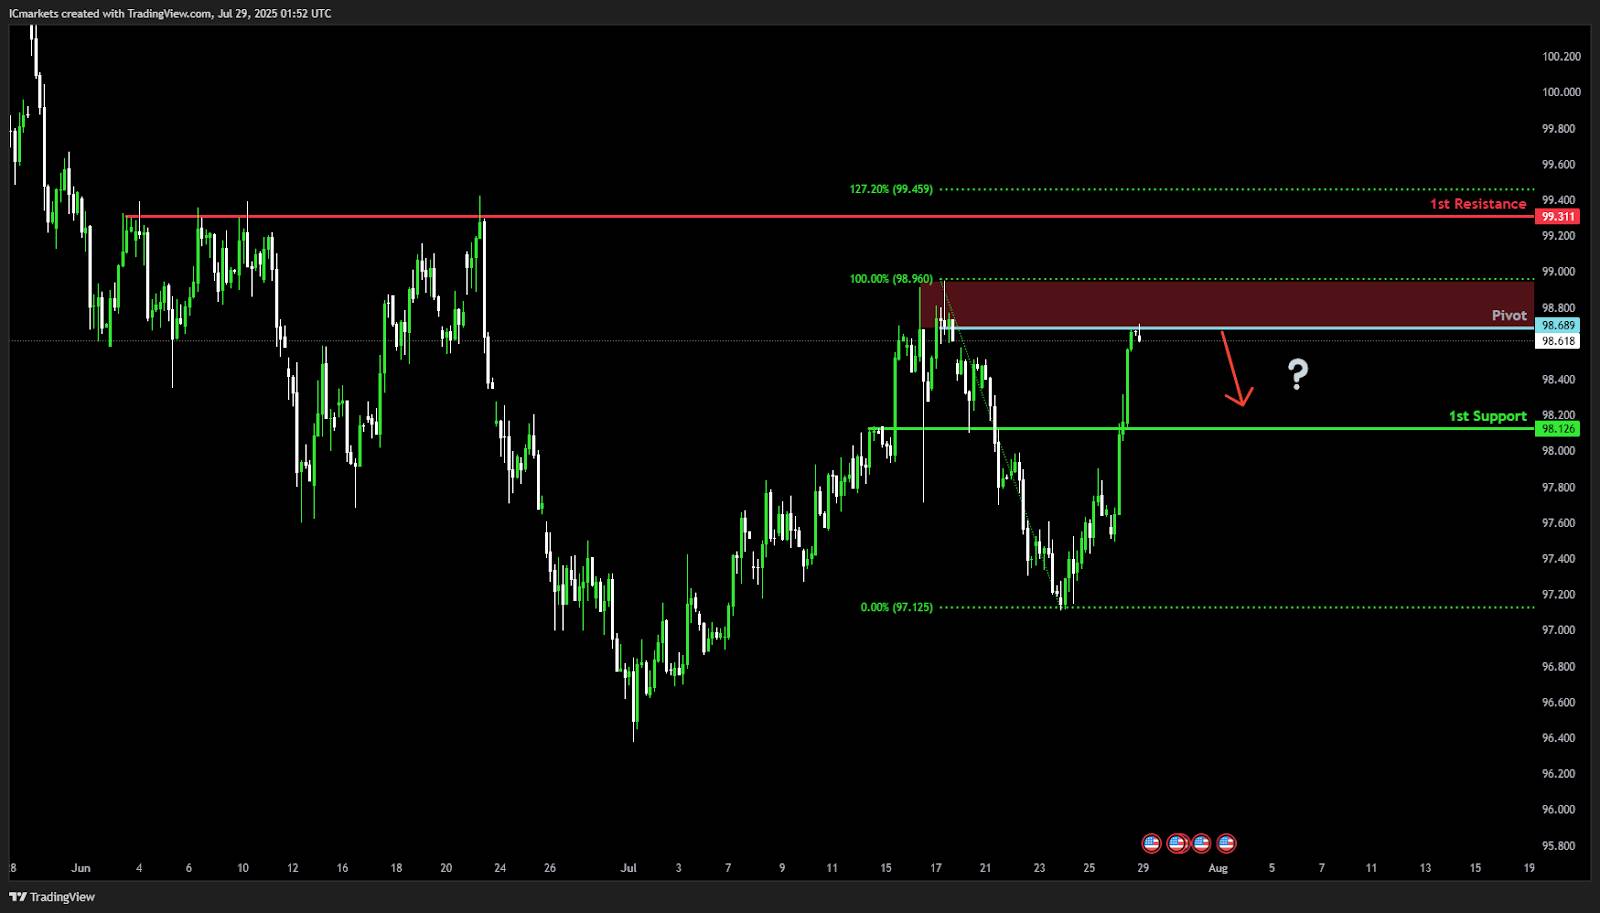
DXY (U.S. Dollar Index):
Potential Direction: Bearish
Overall momentum of the chart: Bearish
The price could make a bearish reversal from the pivot and drop towards the 1st support.
Pivot: 98.68Supporting reasons: Identified as an overlap resistance that aligns with the 50% Fibonacci retracement, indicating a potential area where selling interests could pick up to resume the downtrend.
1st support: 98.12
Supporting reasons: Identified as a pullback support, indicating a potential area where the price could again stabilize.
1st resistance: 99.31Supporting reasons: Identified as a multi-swing high resistance, indicating a potential area that could halt any further upward movement.
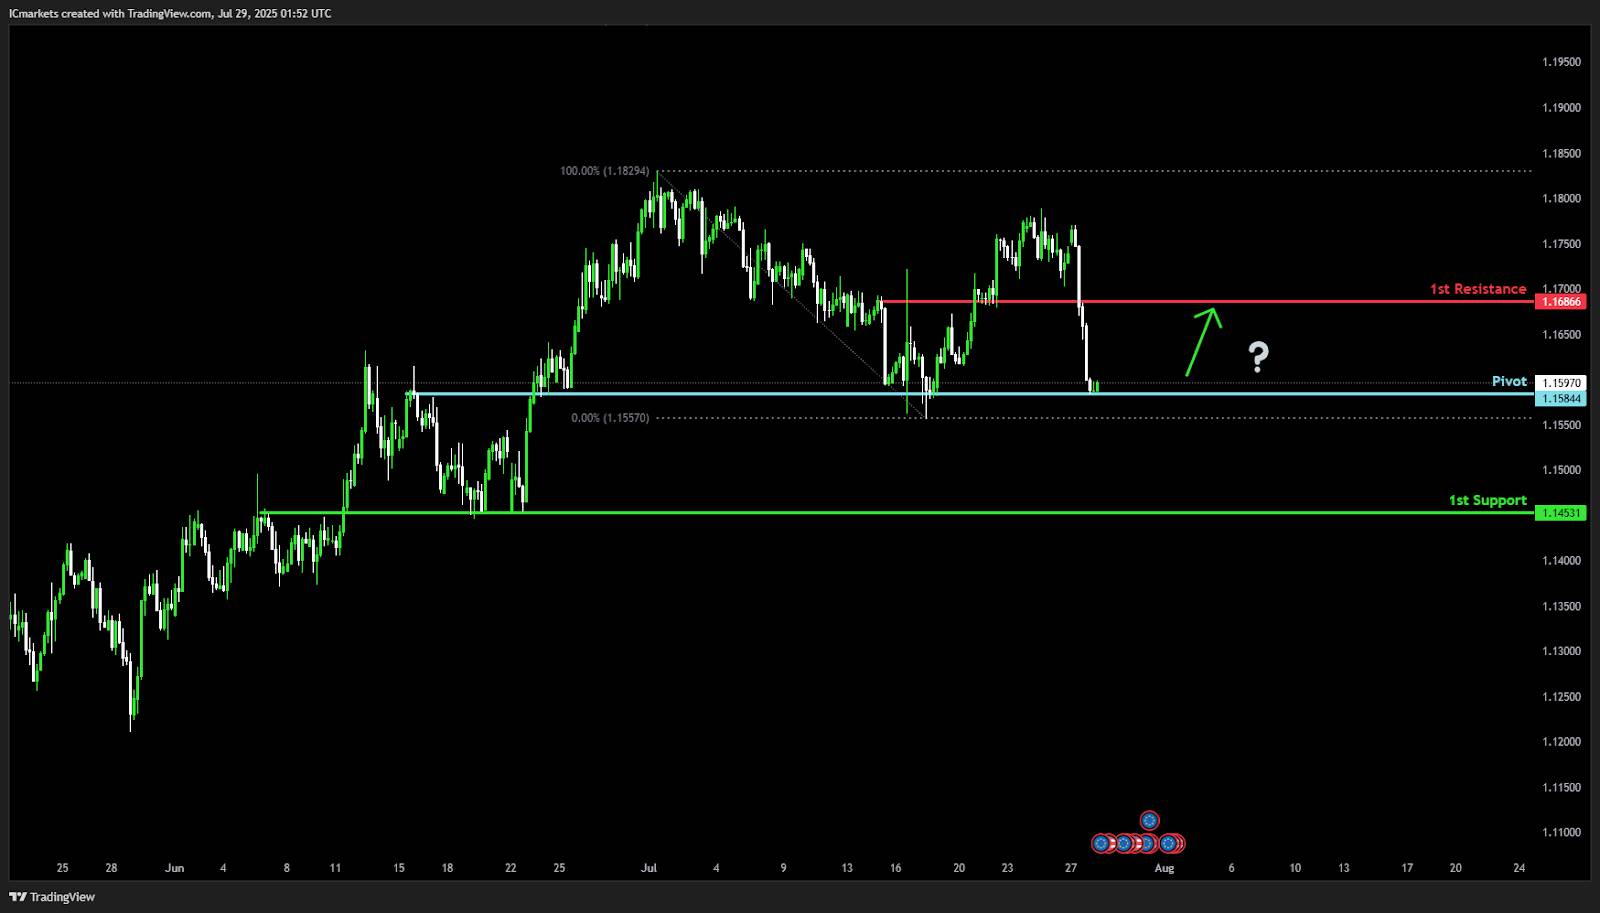
EUR/USD:
Potential Direction: Bullish
Overall momentum of the chart: Bullish
The price could make a bullish bounce off the pivot and rise toward the 1st resistance. Pivot: 1.1584Supporting reasons: Identified as an overlap support, indicating a potential area where buying interest could pick up.
1st support: 1.1453Supporting reasons: Identified as an overlap support, indicating a potential level where the price could stabilize once again.
1st resistance: 1.1686Supporting reasons: Identified as a pullback resistance, indicating a potential level that could cap further upward movement.
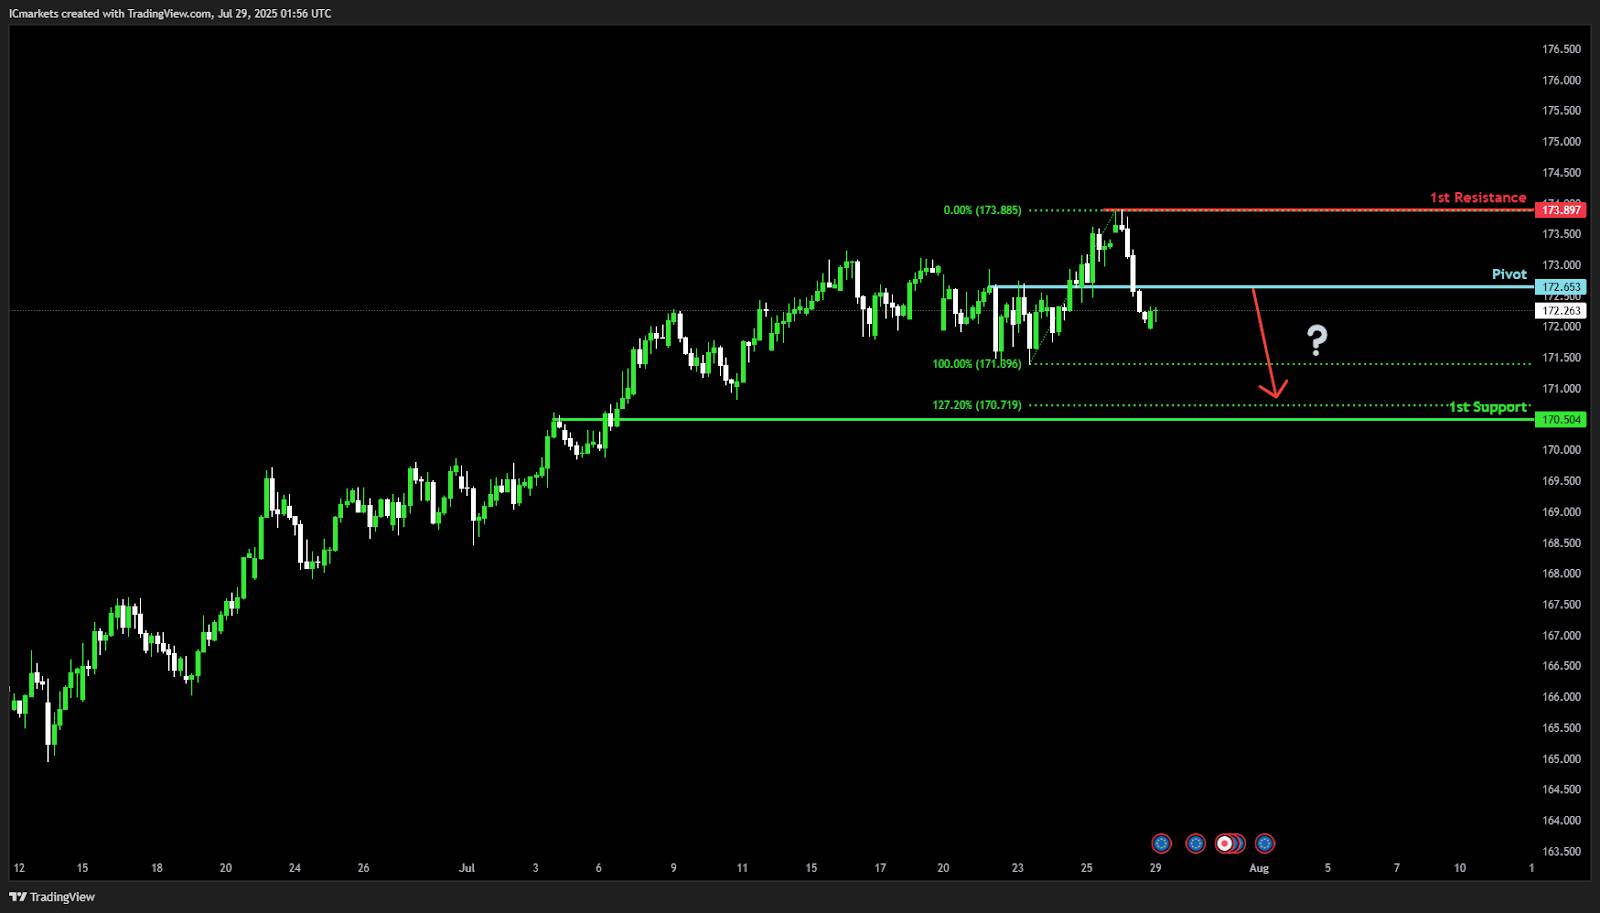
EUR/JPY:
Potential Direction: Bearish
Overall momentum of the chart: Bullish
The price is rising toward the pivot and could make a bearish reversal off this level and drop toward the 1st support.Pivot: 172.65
Supporting reasons: Identified as a pullback resistance, indicating a potential area where selling pressures could intensify.
1st support: 170.50Supporting reasons: Identified as a pullback support that aligns clsoely with the 127.2% Fibonacco extesnion, indicating a potential area where the price could again stabilize.
1st resistance: 173.89Supporting reasons: Identified as a swing high resistance, indicating a potential level that could cap further upward movement.
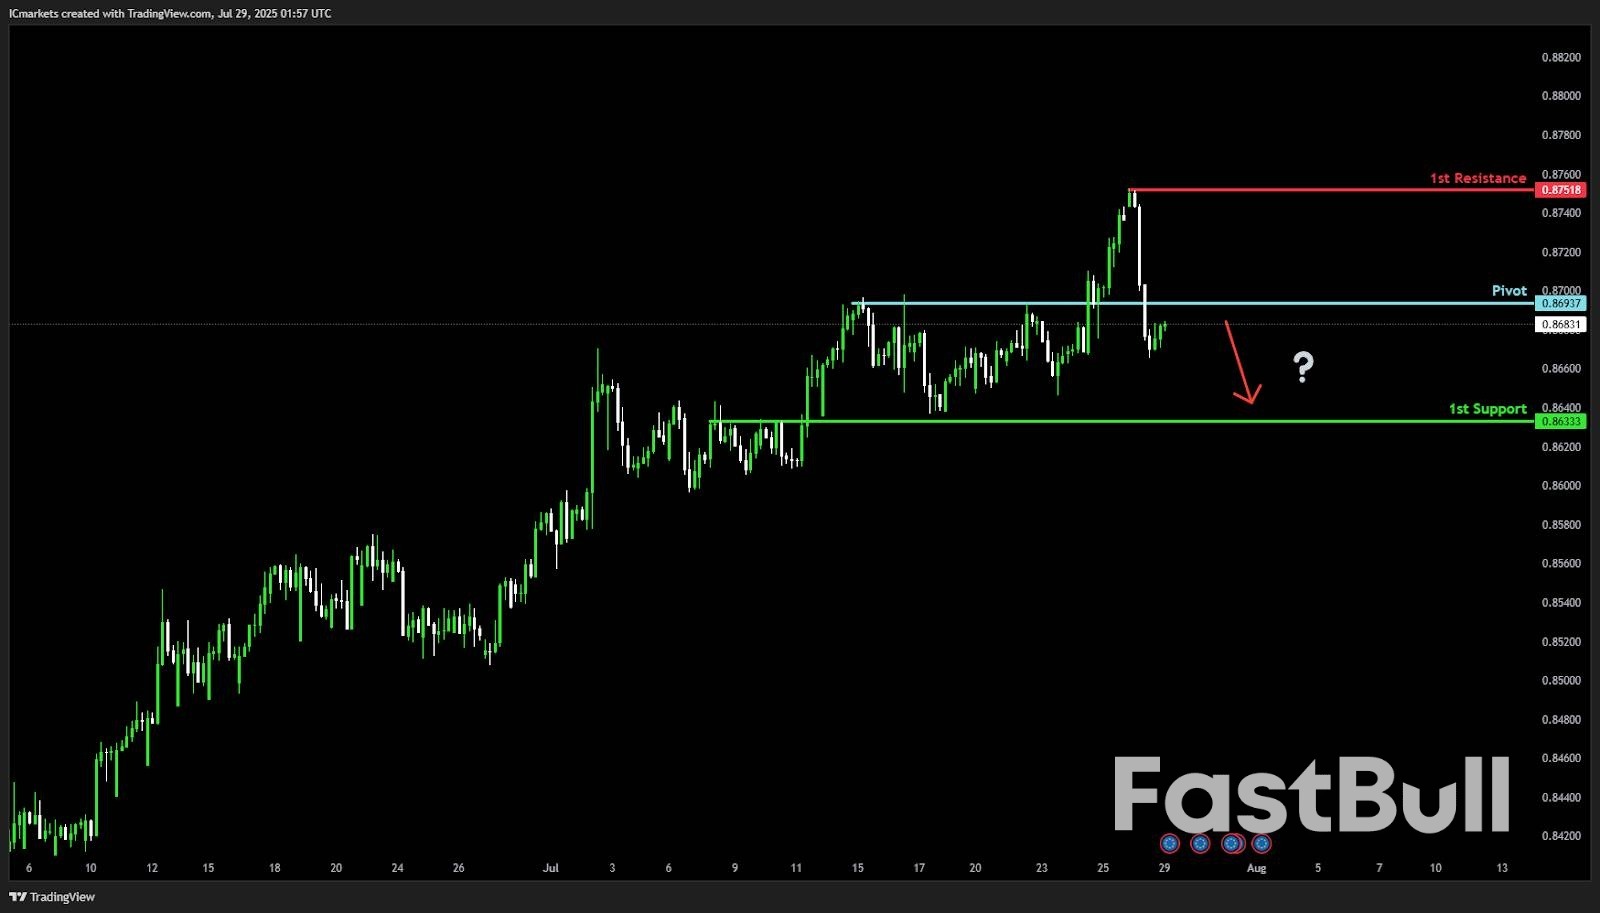
EUR/GBP:
Potential Direction: BearishOverall momentum of the chart: Bullish
The price is rising toward the pivot and could make a bearish reversal off this level and drop toward the 1st support.Pivot: 0.8693
Supporting reasons: Identified as a pullback resistance, indicating a potential area where selling pressures could intensify.
1st support: 0.8633Supporting reasons: Identified as an overlap support, indicating a potential area where the price could stabilize once more.
1st resistance: 0.8751Supporting reasons: Identified as a swing high resistance, indicating a potential level that could cap further upward movement.
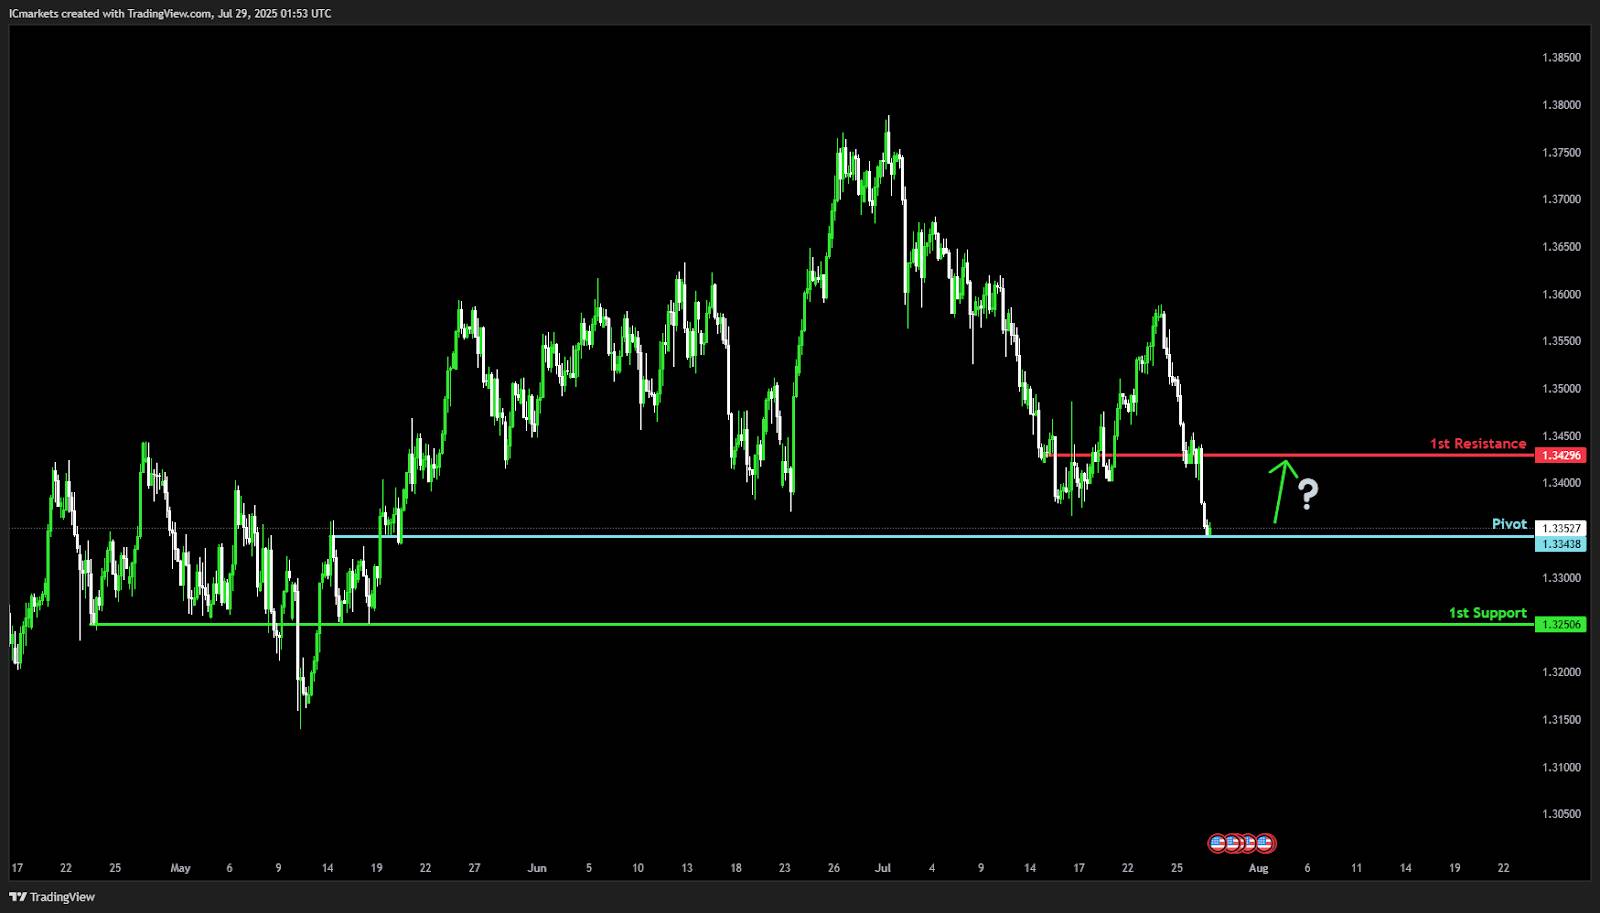
GBP/USD:
Potential Direction: BullishOverall momentum of the chart: Bullish
The price could make a bullish bounce off the pivot and rise toward the 1st resistance. Pivot: 1.3343Supporting reasons: Identified as an overlap support, indicating a potential area where buying interest could pick up.
1st support: 1.3250Supporting reasons: Identified as an overlap support, indicating a potential area where the price could stabilize once more.
1st resistance: 1.3429Supporting reasons: Identified as a pullback resistance, indicating a potential level that could halt further upward movement.
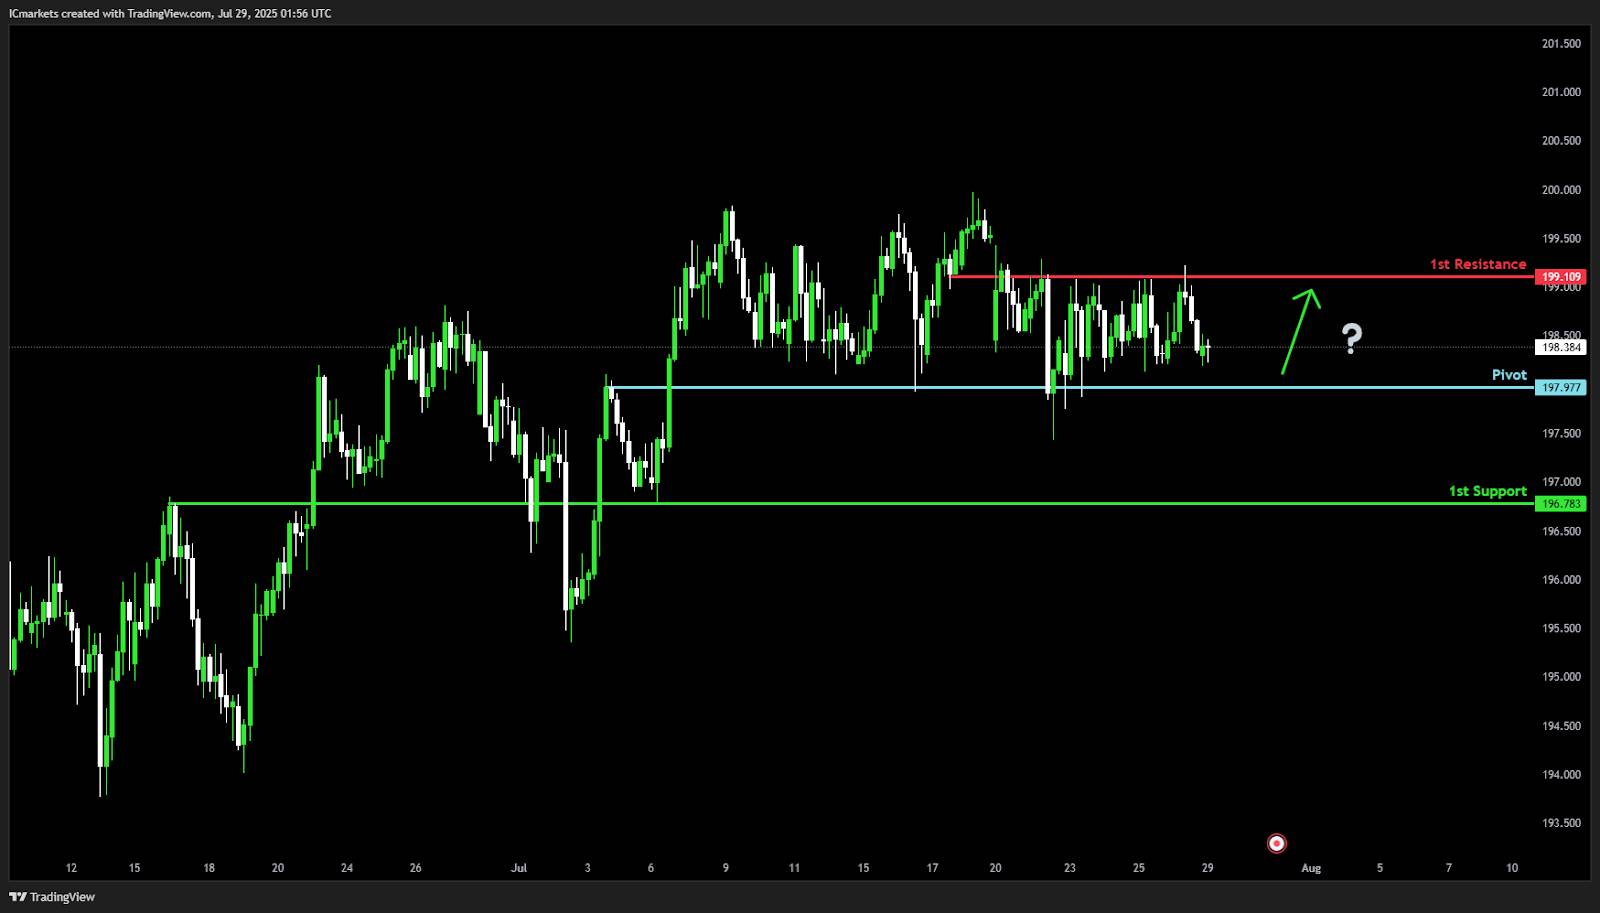
GBP/JPY:
Potential Direction: Bullish
Overall momentum of the chart: Bullish
The price could make a bullish bounce off the pivot to rise toward the 1st resistance.
Pivot: 197.97Supporting reasons: Identified as an overlap support, indicating a potential area where selling interests could pick up to stage a rebound.
1st support: 196.78Supporting reasons: Identified as an overlap support, indicating a potential level where the price could stabilize once more.
1st resistance: 199.10Supporting reasons: Identified as an overlap resistance, indicating a potential level that could halt further upward movement.
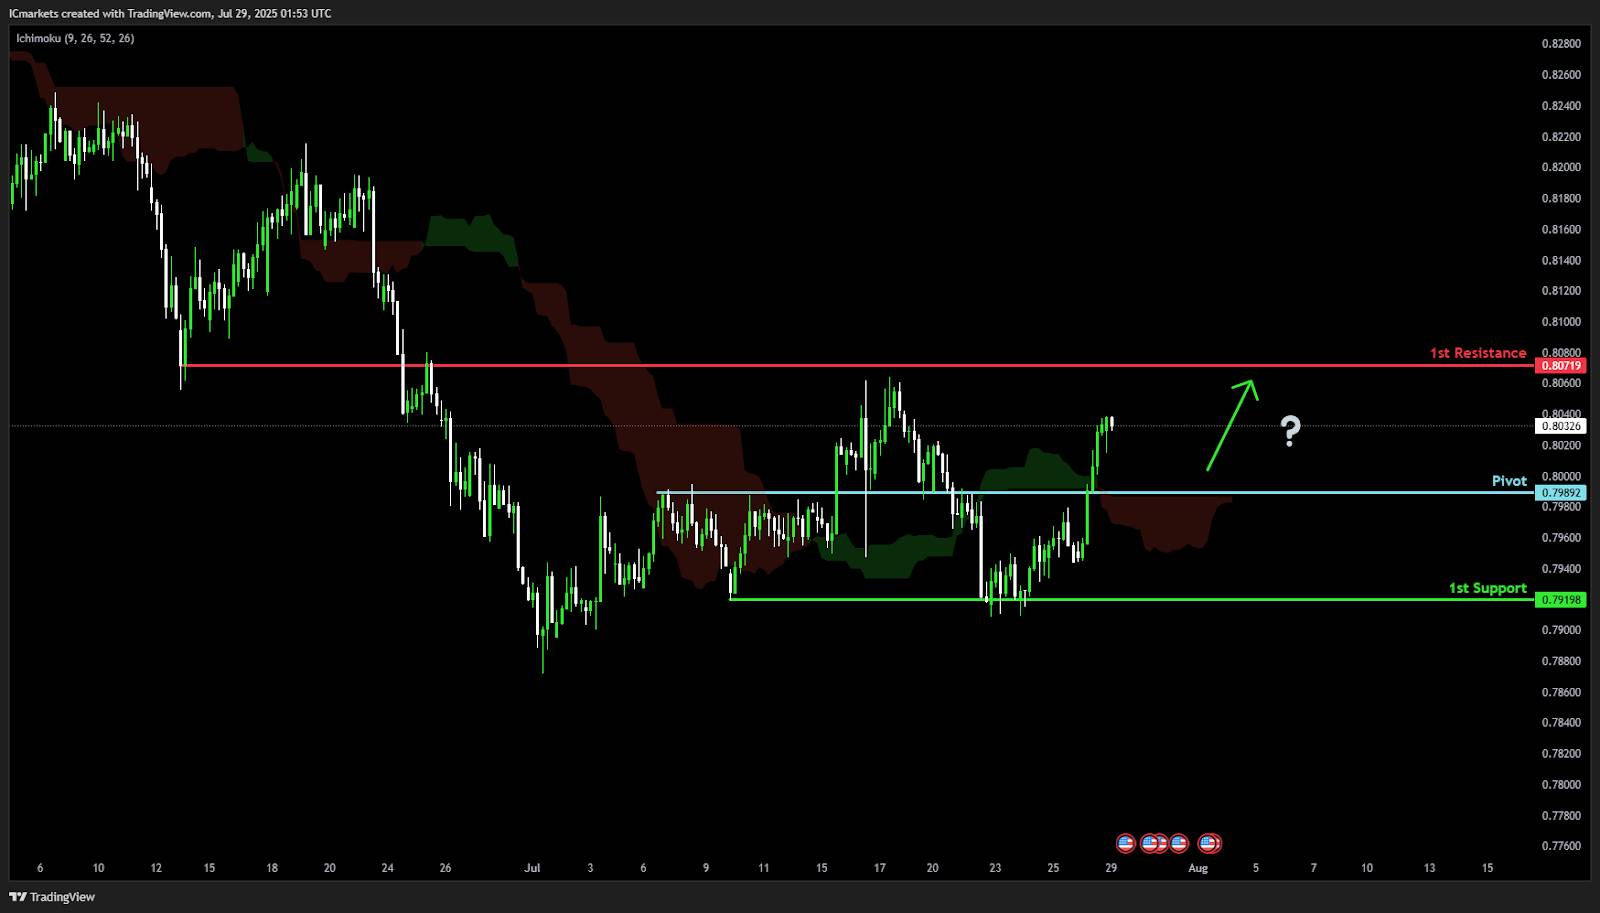
USD/CHF:
Potential Direction: Bullish
Overall momentum of the chart: Bearish
The price could make a bullish bounce off the pivot to rise toward the 1st resistance. Additionally, the price is above the Ichimoku Cloud, which adds further significance to the strength of the bullish momentum.
Pivot: 0.7989Supporting reasons: Identified as a pullback support, indicating a potential area where selling interests could pick up to stage a rebound.
1st support: 0.7919Supporting reasons: Identified as a swing low support, indicating a potential level where the price could stabilize once again.
1st resistance: 0.8071Supporting reasons: Identified as an overlap resistance, indicating a potential level that could cap further upward movement.
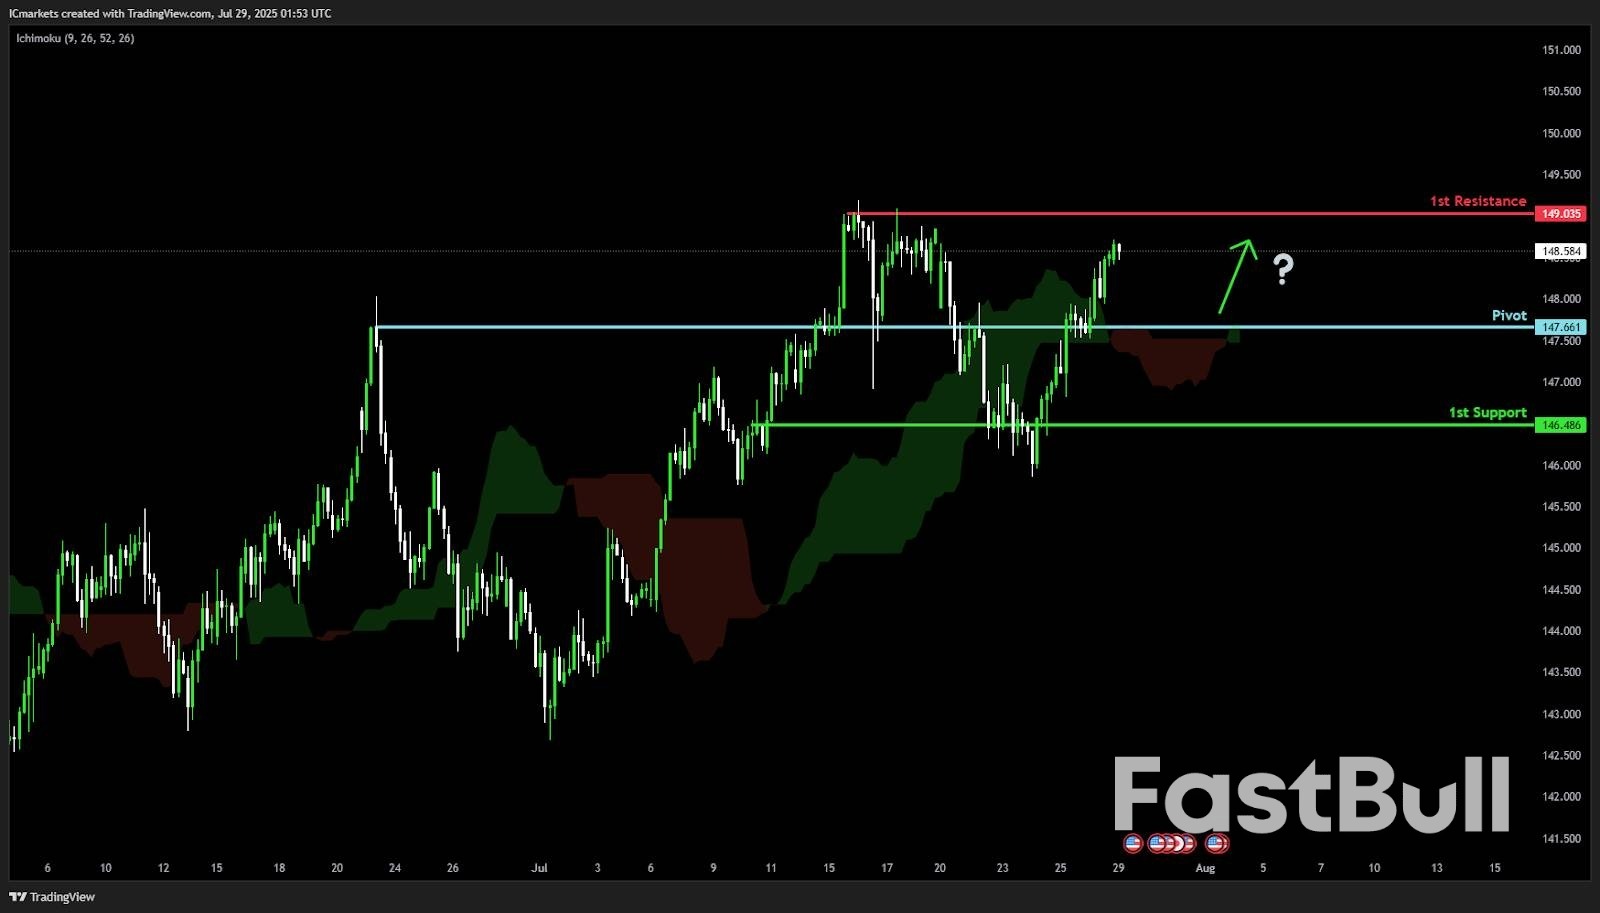
USD/JPY:
Potential Direction: Bullish
Overall momentum of the chart: Bullish
The price could make a bullish bounce off the pivot and rise toward the 1st resistance. Additionally, the price is above the Ichimoku Cloud, which adds further significance to the strength of the bullish momentum.
Pivot: 147.66
Supporting reasons: Identified as an overlap support, indicating a potential area where buying interests could pick up to resume the uptrend.
1st support: 146.48Supporting reasons: Identified as a pullback support, suggesting a potential area where the price could stabilize once more.
1st resistance: 149.03Supporting reasons: Identified as a swing high resistance that aligns closely with the 61.8% Fiboancco retracement, indicating a potential level that could cap further upward movement.
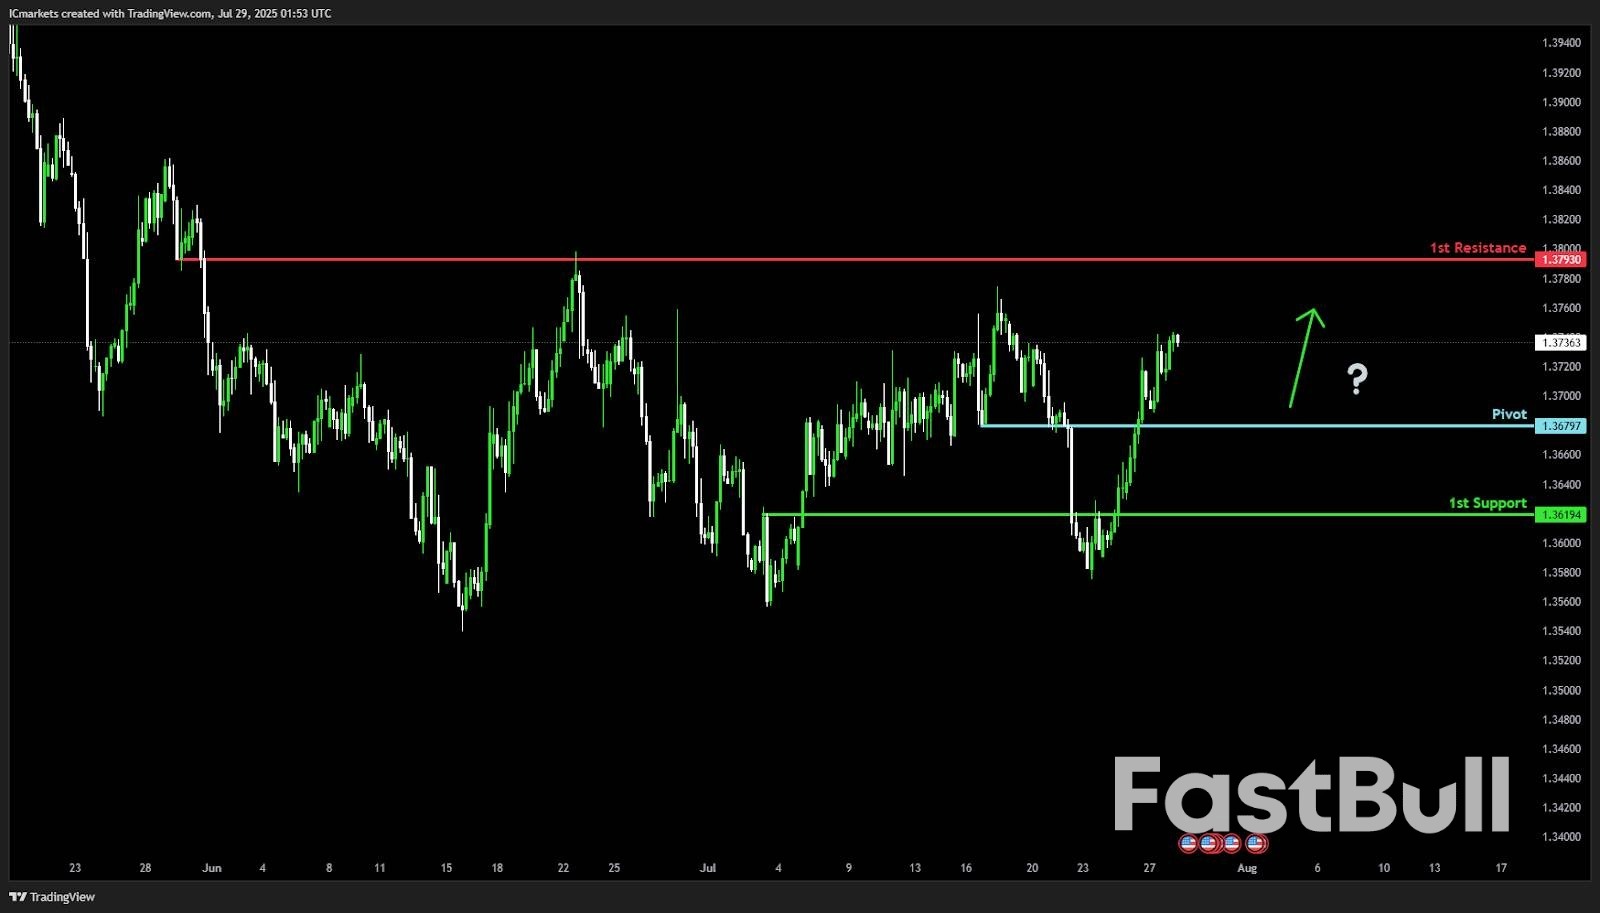
USD/CAD:
Potential Direction: Bullish
Overall momentum of the chart: Bearish
The price could potentially make a bullish bounce off the pivot and rise toward the 1st resistance,
Pivot: 1.3679
Supporting reasons: Identified as a pullback support, indicating a potential area where buying interests could pick up to resume the uptrend.
1st support: 1.3619
Supporting reasons: Identified as a pullback support, indicating a key level where the price could stabilize once more.
1st resistance: 1.3793
Supporting reasons: Identified as an overlap resistance, indicating a potential area that could halt any further upward movement.
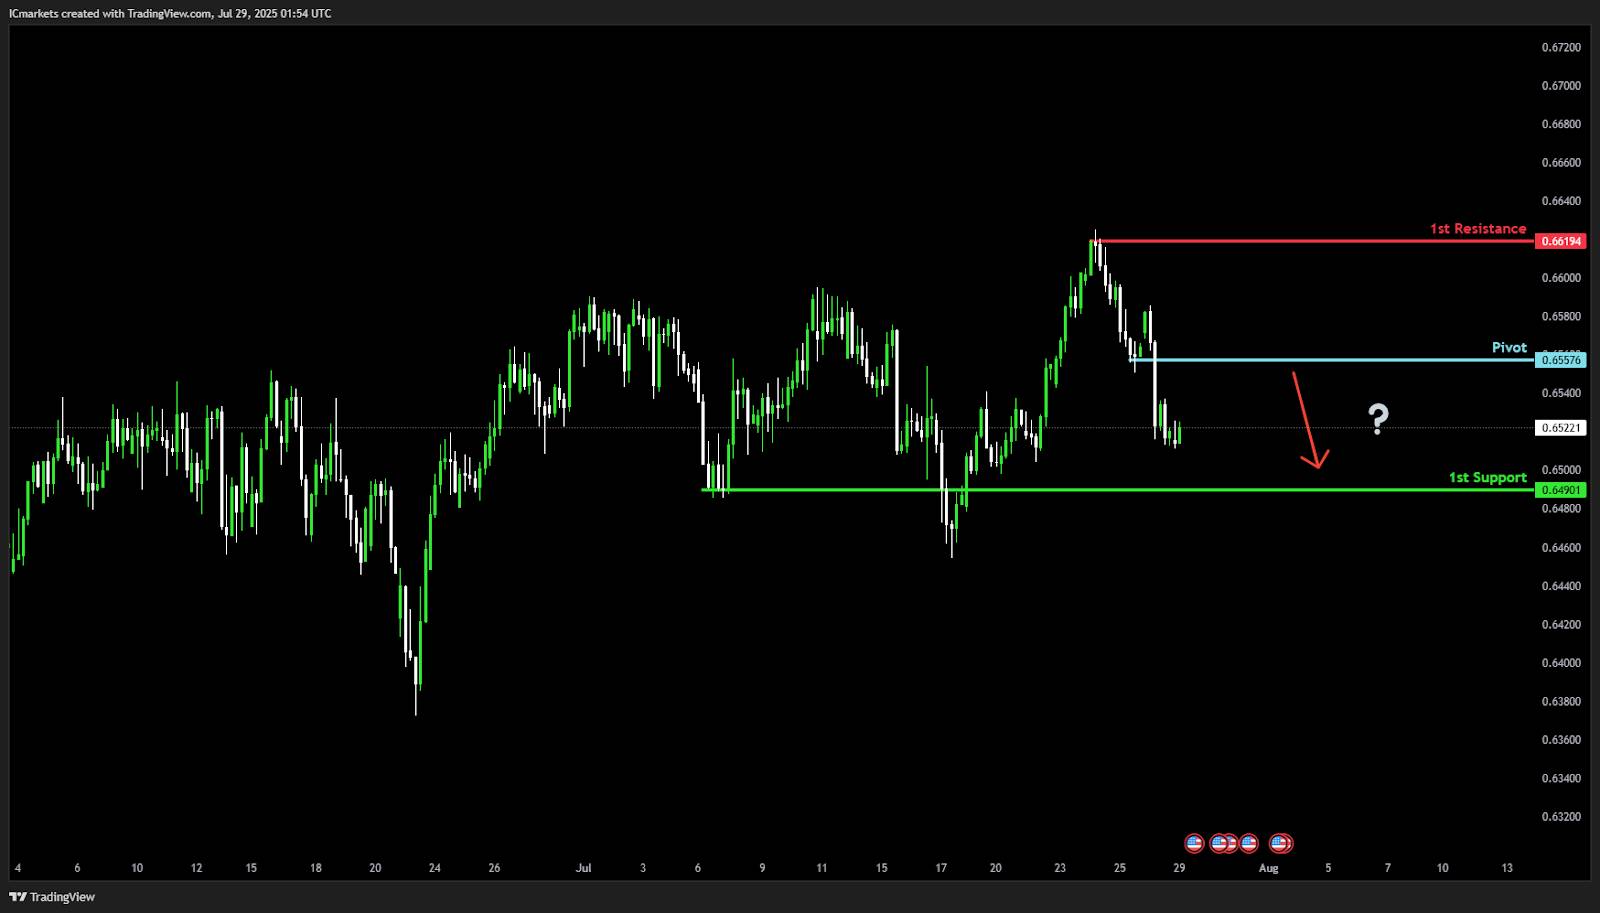
AUD/USD:
Potential Direction: Bearish
Overall momentum of the chart: Bullish
The price is rising toward the pivot and could make a bearish reversal off this level and drop toward the 1st support.Pivot: 0.6557
Supporting reasons: Identified as a pullback resistance, indicating a potential area where selling pressures could intensify.
1st support: 0.6490
Supporting reasons: Identified as a pullback support, indicating a key level where the price could stabilize once more.
1st resistance:0.6619Supporting reasons: Identified as a swing high resistance, indicating a potential area that could halt any further upward movement.
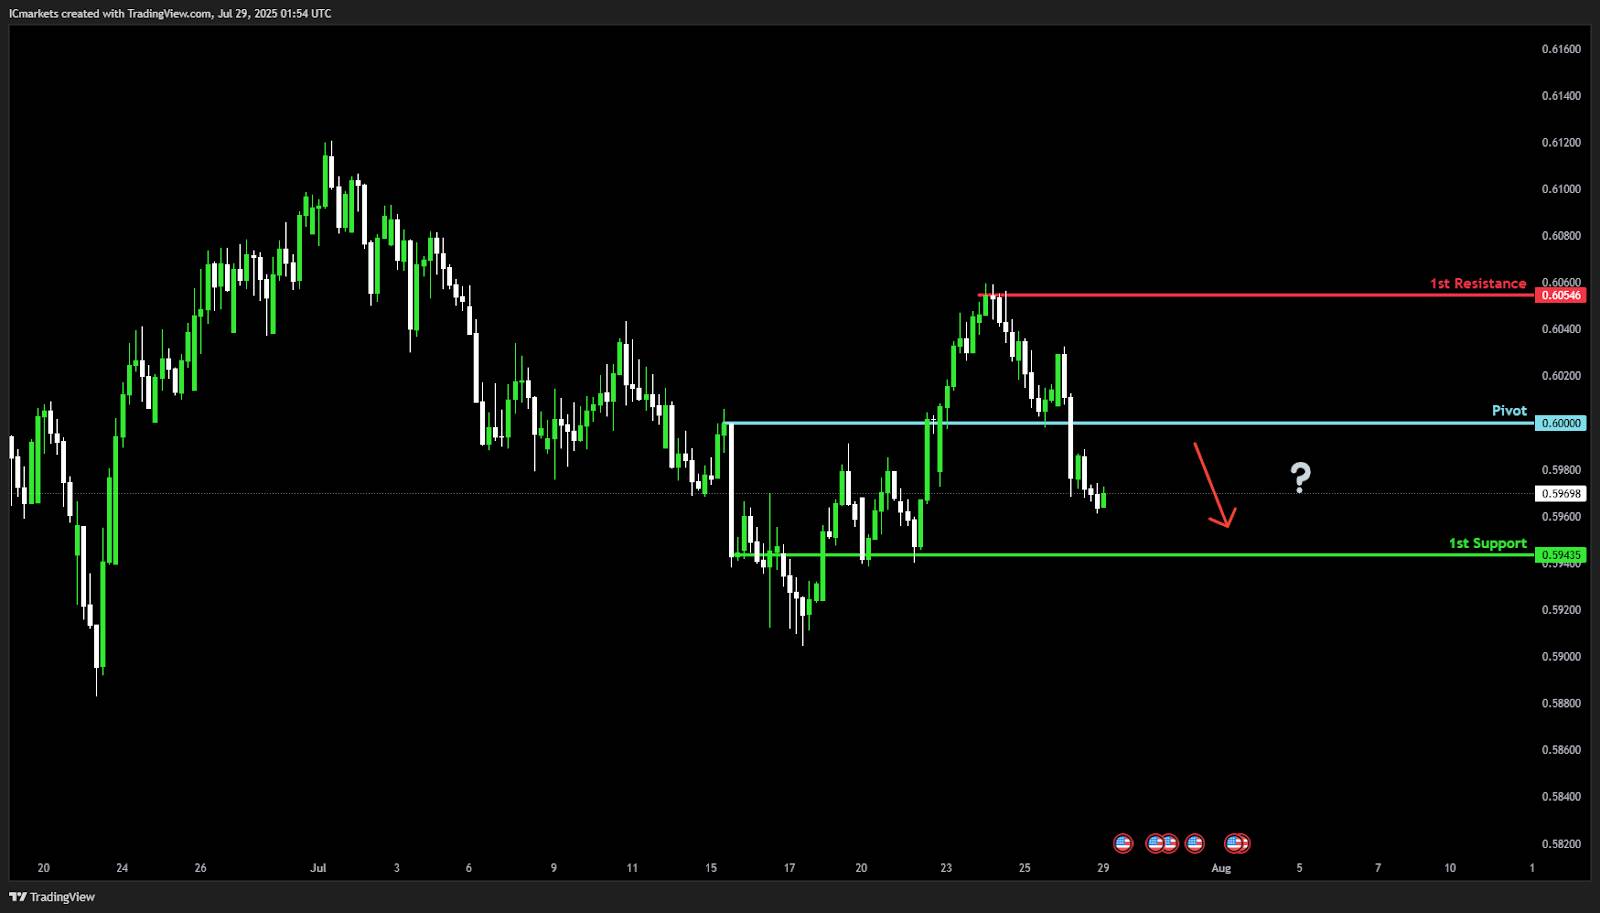
NZD/USD
Potential Direction: Bearish
Overall momentum of the chart: Bullish
The price is rising toward the pivot and could make a bearish reversal off this level and drop toward the 1st support.Pivot: 0.6000
Supporting reasons: Identified as a pullback resistance, indicating a potential area where selling pressures could intensify.
1st support: 0.5943
Supporting reasons: Identified as an overlap support, suggesting a potential area where the price could stabilize once more.
1st resistance: 0.6054
Supporting reasons: Identified as a swing high resistance, indicating a potential area that could halt any further upward movement.
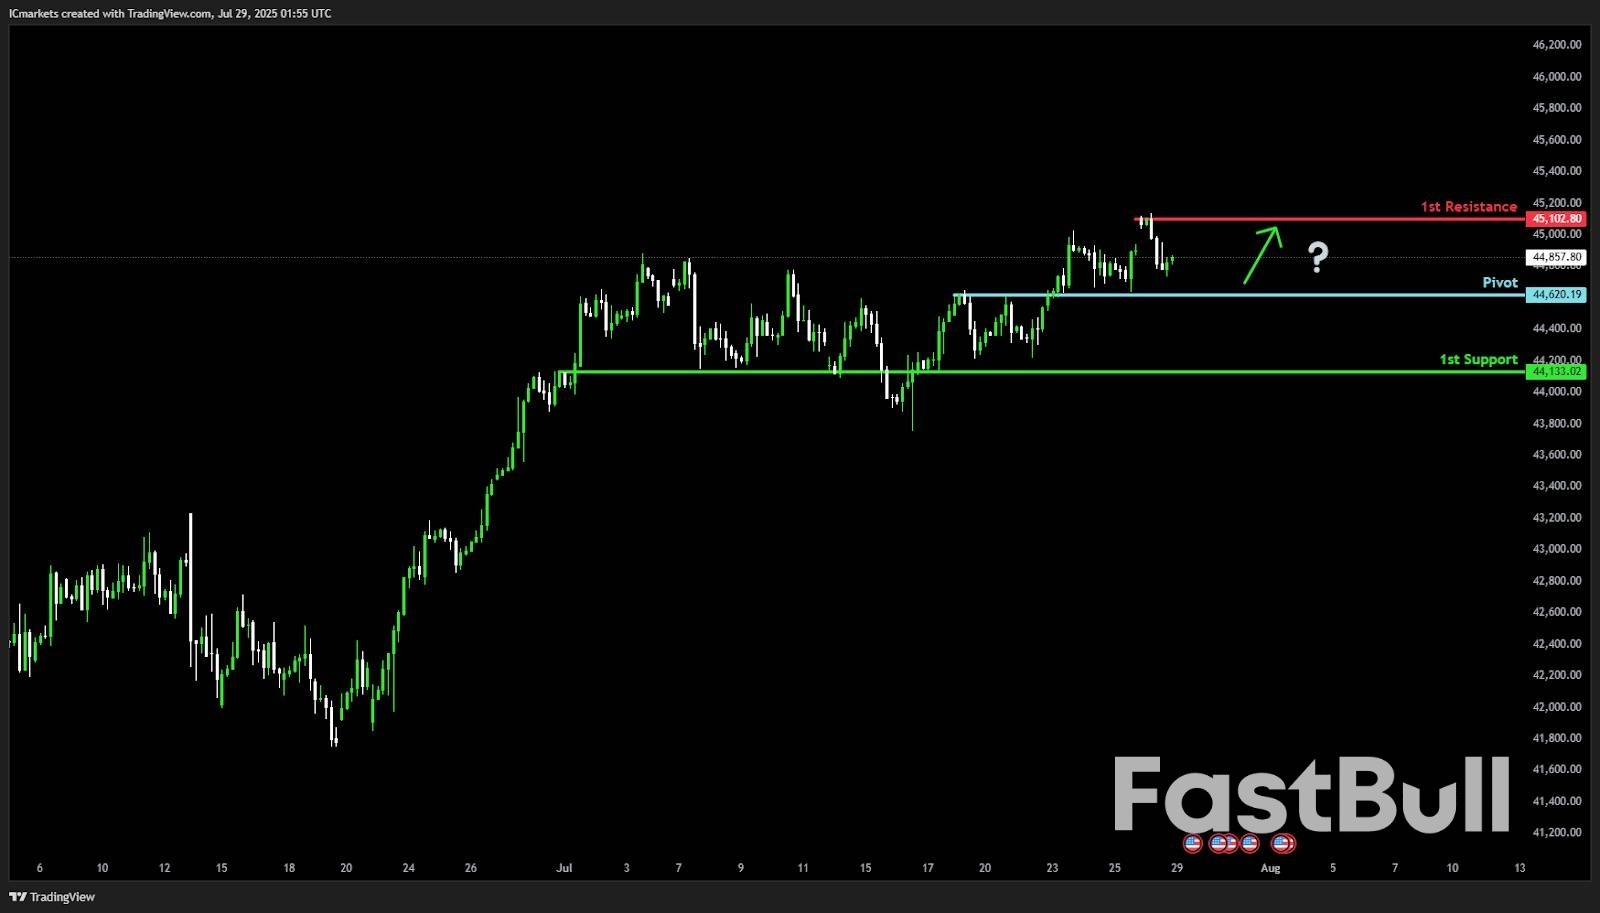
US30 :
Potential Direction: Bullish
Overall momentum of the chart: Bullish
The price is falling toward the pivot and could make a bullish bounce off this level and rise toward the 1st resistance.
Pivot: 44,620.19
Supporting reasons: Identified as an overlap support, indicating a potential area where buying interests could pick up to resume the uptrend.
1st support: 44,133.02
Supporting reasons: Identified as an overlap support, suggesting a potential area where the price could stabilize once again.
1st resistance: 45,102.80
Supporting reasons: Identified as a swing high resistance t indicating a potential area that could halt any further upward movement.
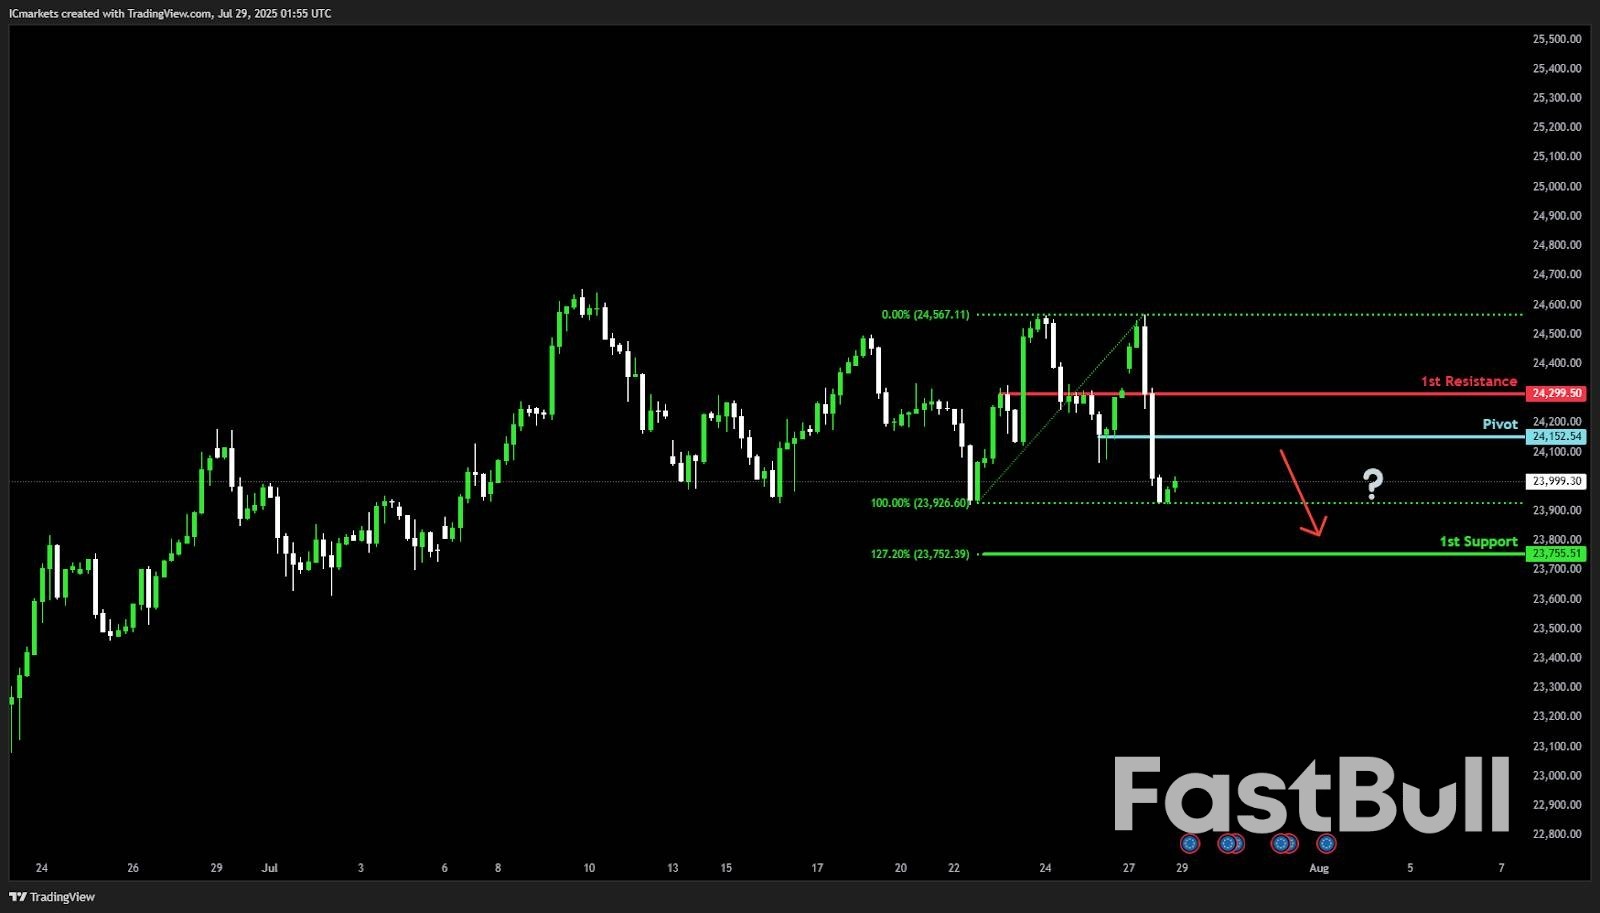
DE40 :
Potential Direction: Bearish
Overall momentum of the chart: Bullish
The price is rising toward the pivot and could make a bearish reversal off this level and drop toward the 1st support.Pivot: 24,152.54
Supporting reasons: Identified as a pullback resistance, indicating a potential area where selling pressures could intensify..
1st support: 23,755.51
Supporting reasons: Identified as a support that is supported by the 127.2% Fibonacci extension, indicating a key level where the price could stabilize once more.
1st resistance: 24,299.50Supporting reasons: Identified as a pullback resistance, indicating a potential area that could halt any further upward movement.
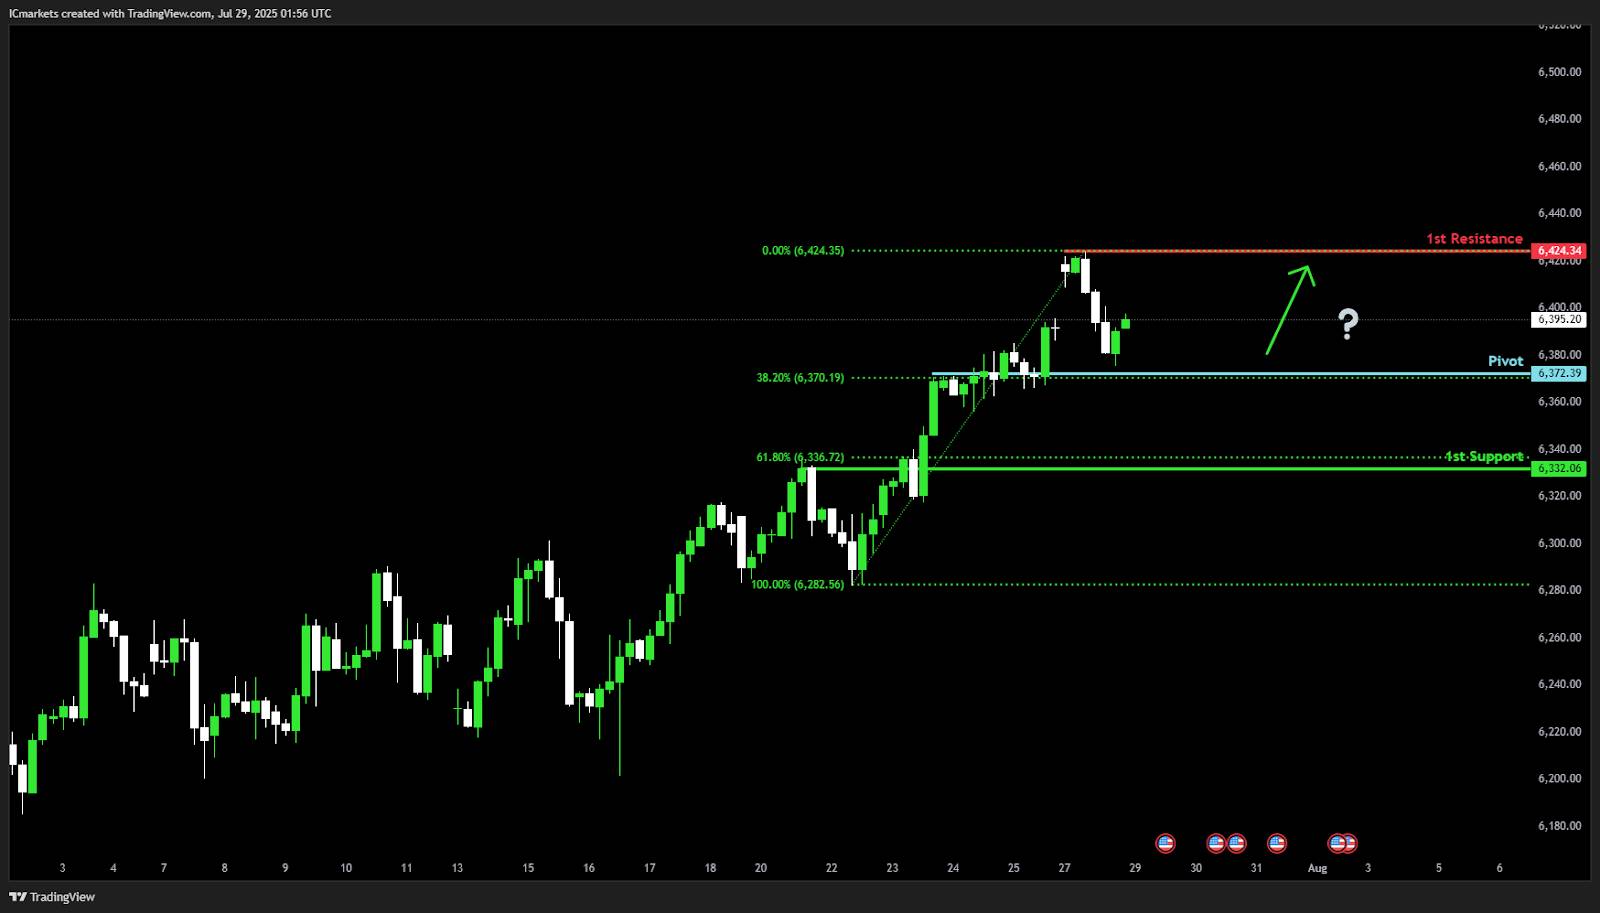
US500 :
Potential Direction: Bullish
Overall momentum of the chart: Bullish
The price could fall toward the pivot and potentially make a bullish bounce off this level to rise toward the 1st resistance.
Pivot: 6,372.39
Supporting reasons: Identified as a pullback support that aligns with the 38.2% Fibonacco retracement, indicating a potential area where buying interests could pick up to resume the uptrend.
1st support: 6,332.06
Supporting reasons: Identified as a pullback support that aligns with the 61.8% Fibonacci retracement, indicating a potential level where the price could stabilize once again.
1st resistance: 6,424.34
Supporting reasons: Identified as a swing high resistance, indicating a potential area that could halt any further upward movement.
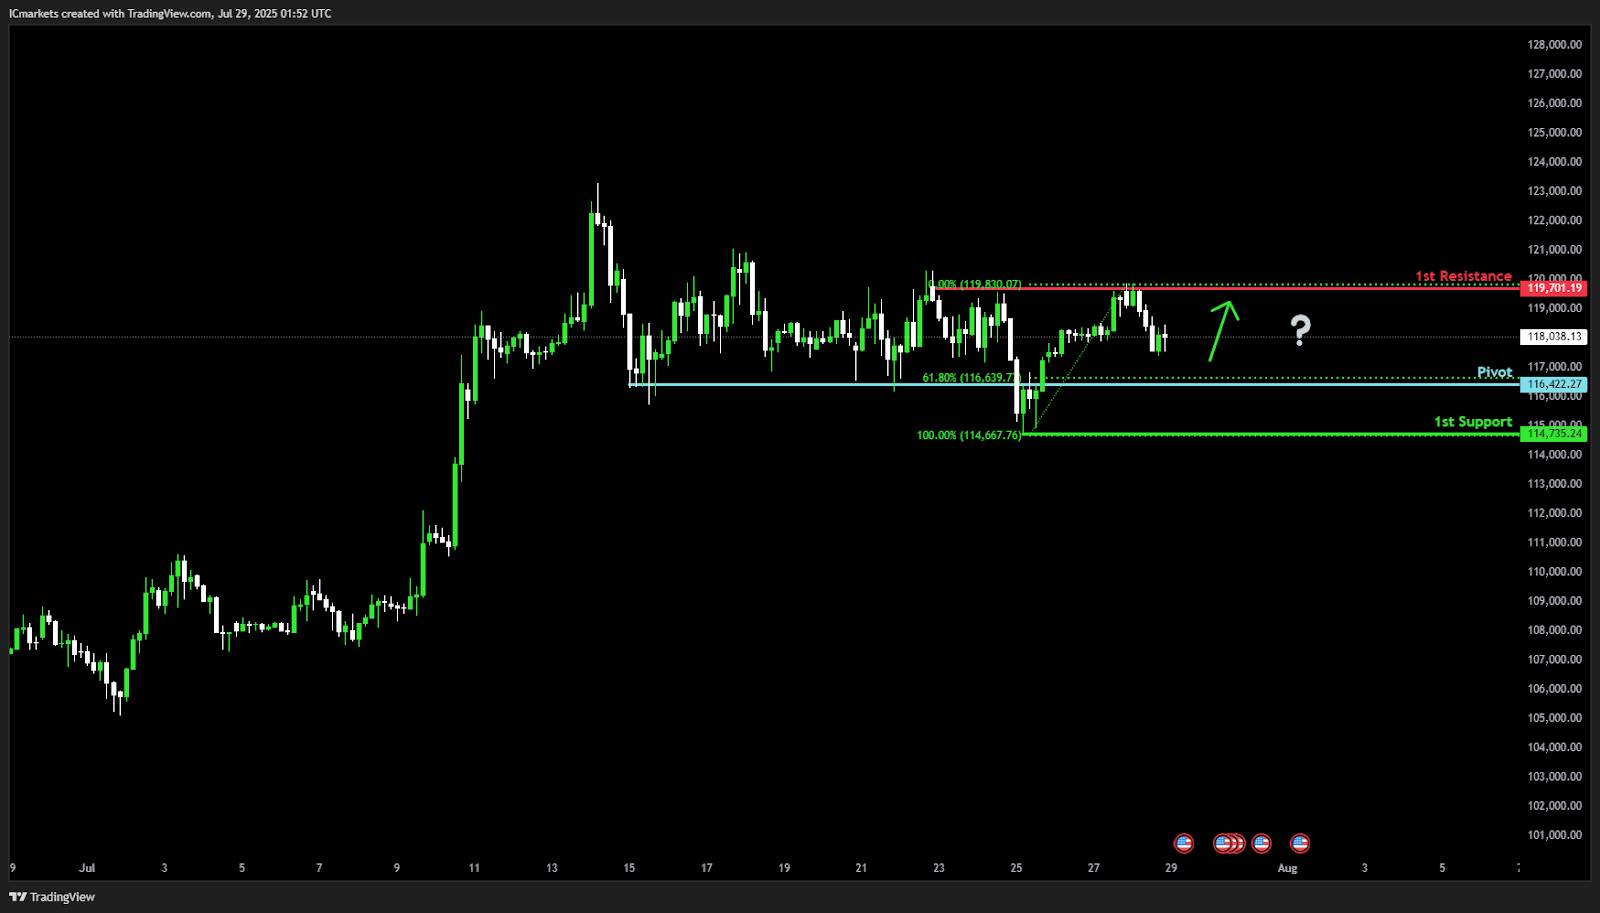
BTC/USD :
Potential Direction: Bullish
Overall momentum of the chart: Bullish
The price is falling toward the pivot and could make a bullish rise toward the 1st resistance.
Pivot: 116,422.27
Supporting reasons: Identified as a pullback support that aligns with the 61.8% Fibonacci retracement, indicating a potential area where buying interests could pick up to resume the uptrend.
1st support: 114,735.24
Supporting reasons: Identified as a swing low support, indicating a potential level where the price could stabilize once more.
1st resistance: 119,701.19
Supporting reasons: Identified as a swing high resistance, indicating a potential area that could halt any further upward movement.
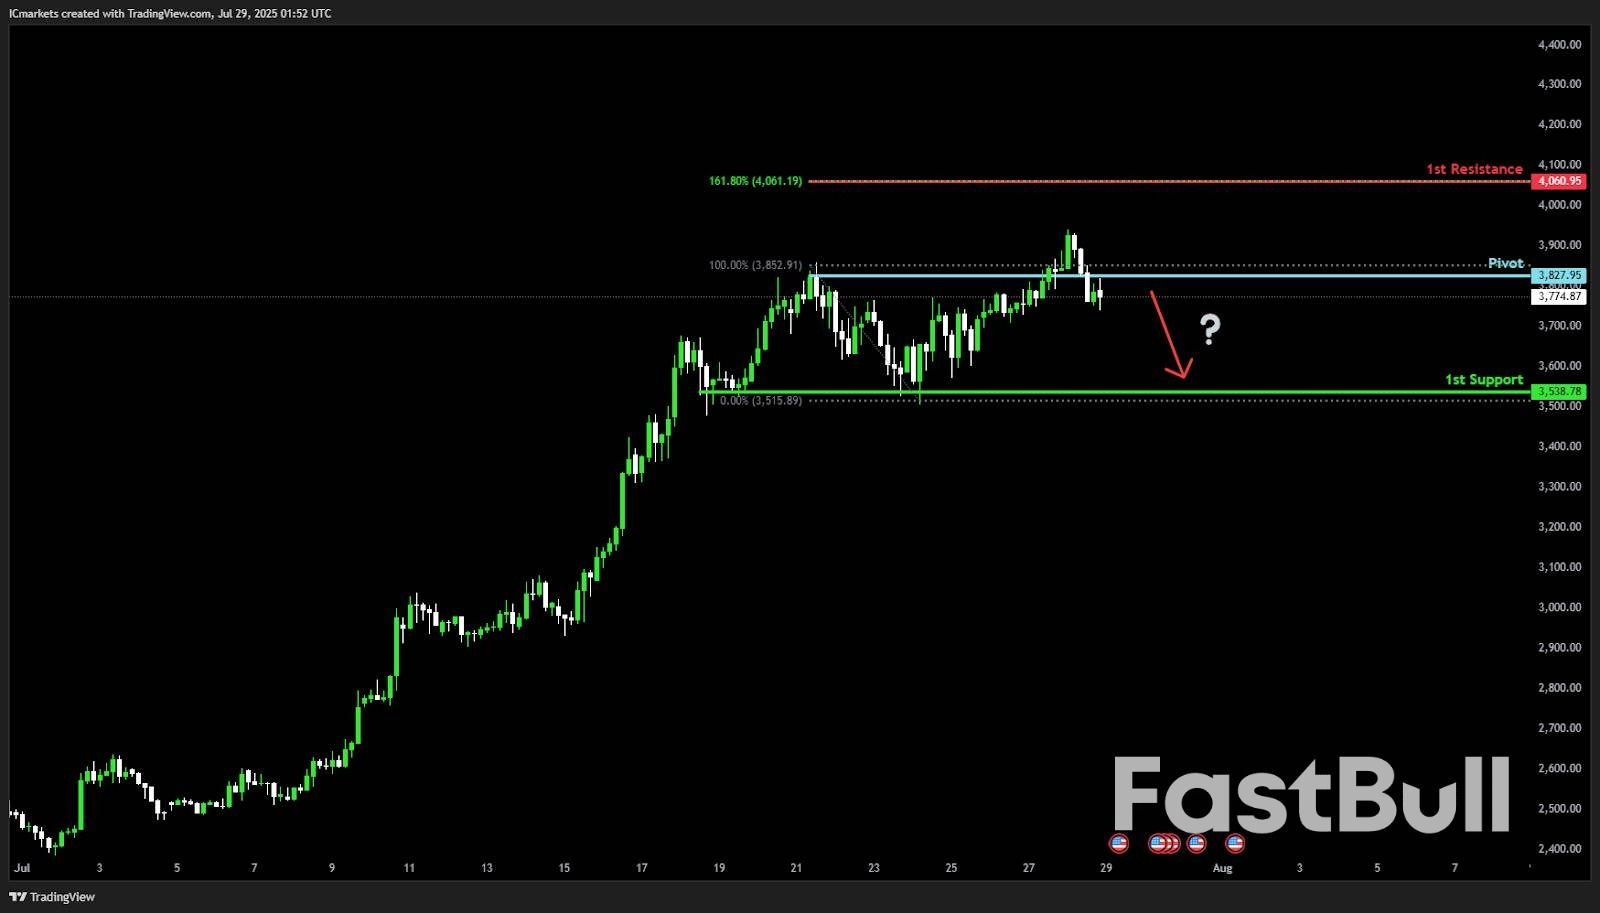
ETH/USD:
Potential Direction: Bearish
Overall momentum of the chart: Bullish
The price could make a bullish rise toward the 1st resistance.
Pivot: 3,827.95
Supporting reasons: Identified as a pullback resistance, indicating a potential area where selling pressures could intensify.
1st support: 3,538.78
Supporting reasons: Identified as a multi-swing low support, indicating a potential level where the price could stabilize once more.
1st resistance: 4,096.95Supporting reasons: Identified as a resistance that is supported by the 161.8% Fibonacci extension, indicating a potential area that could halt any further upward movement.
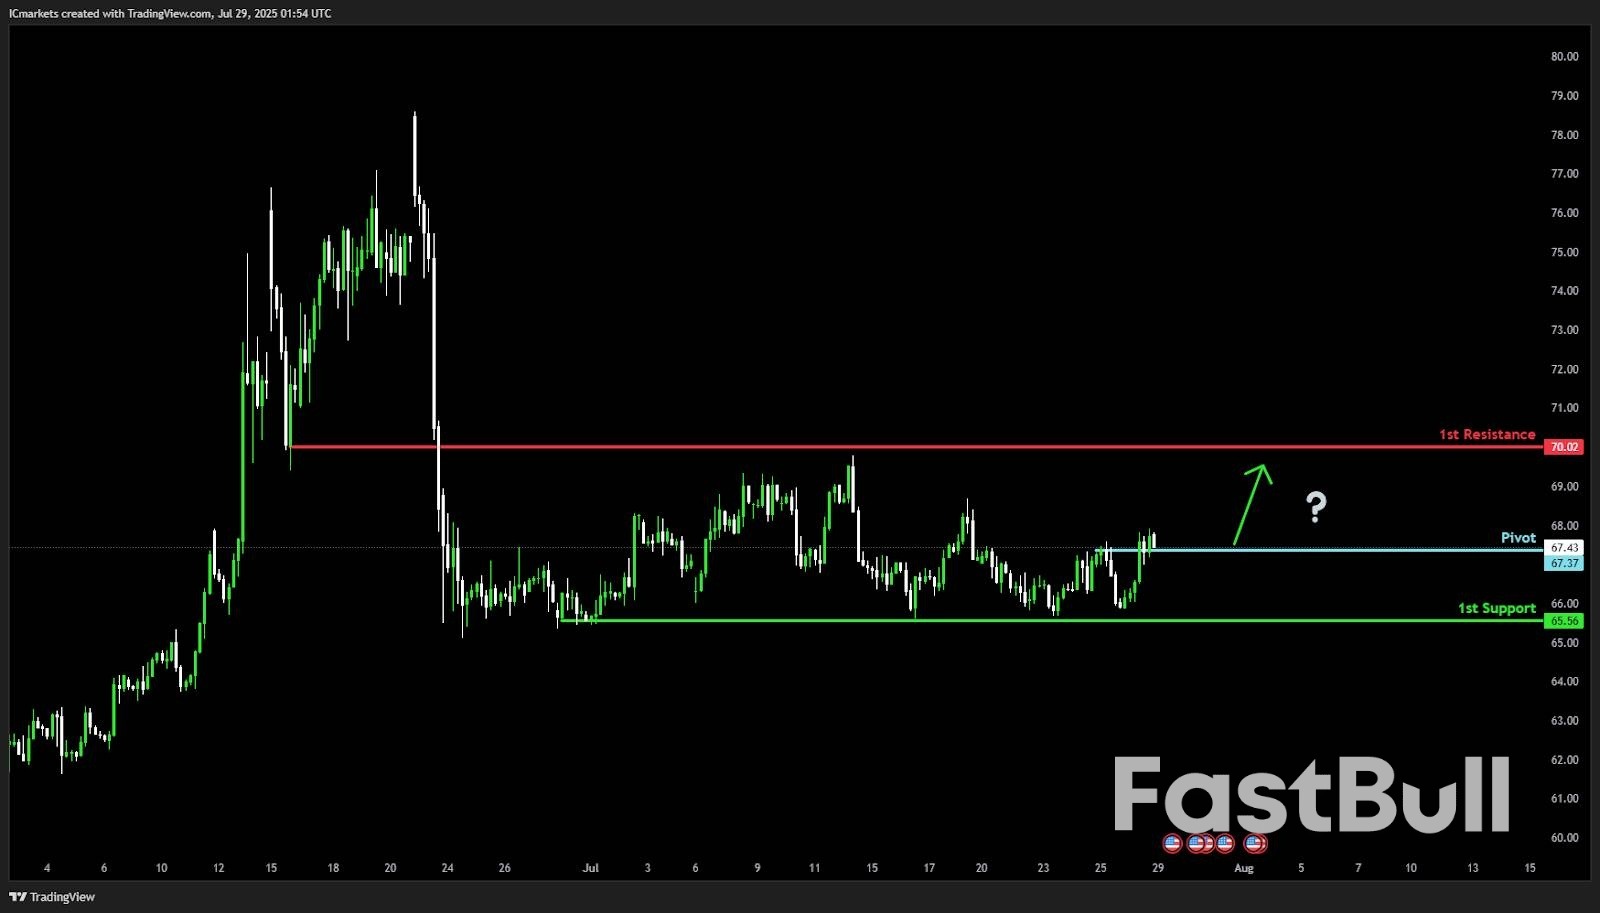
WTI/USD :
Potential Direction: Bullish
Overall momentum of the chart: Bullish
The price could make a bullish bounce off the pivot to rise toward the 1st resistance.
Pivot: 67.37Supporting reasons: Identified as a pullback support, indicating a potential area where selling interests could pick up to stage a rebound.
1st support: 65.56Supporting reasons: Identified as a multi-swing swing low support, indicating a key level where the price could stabilize once more.
1st resistance: 70.02Supporting reasons: Identified as a pullback resistance, indicating a potential area that could halt any further upward movement.
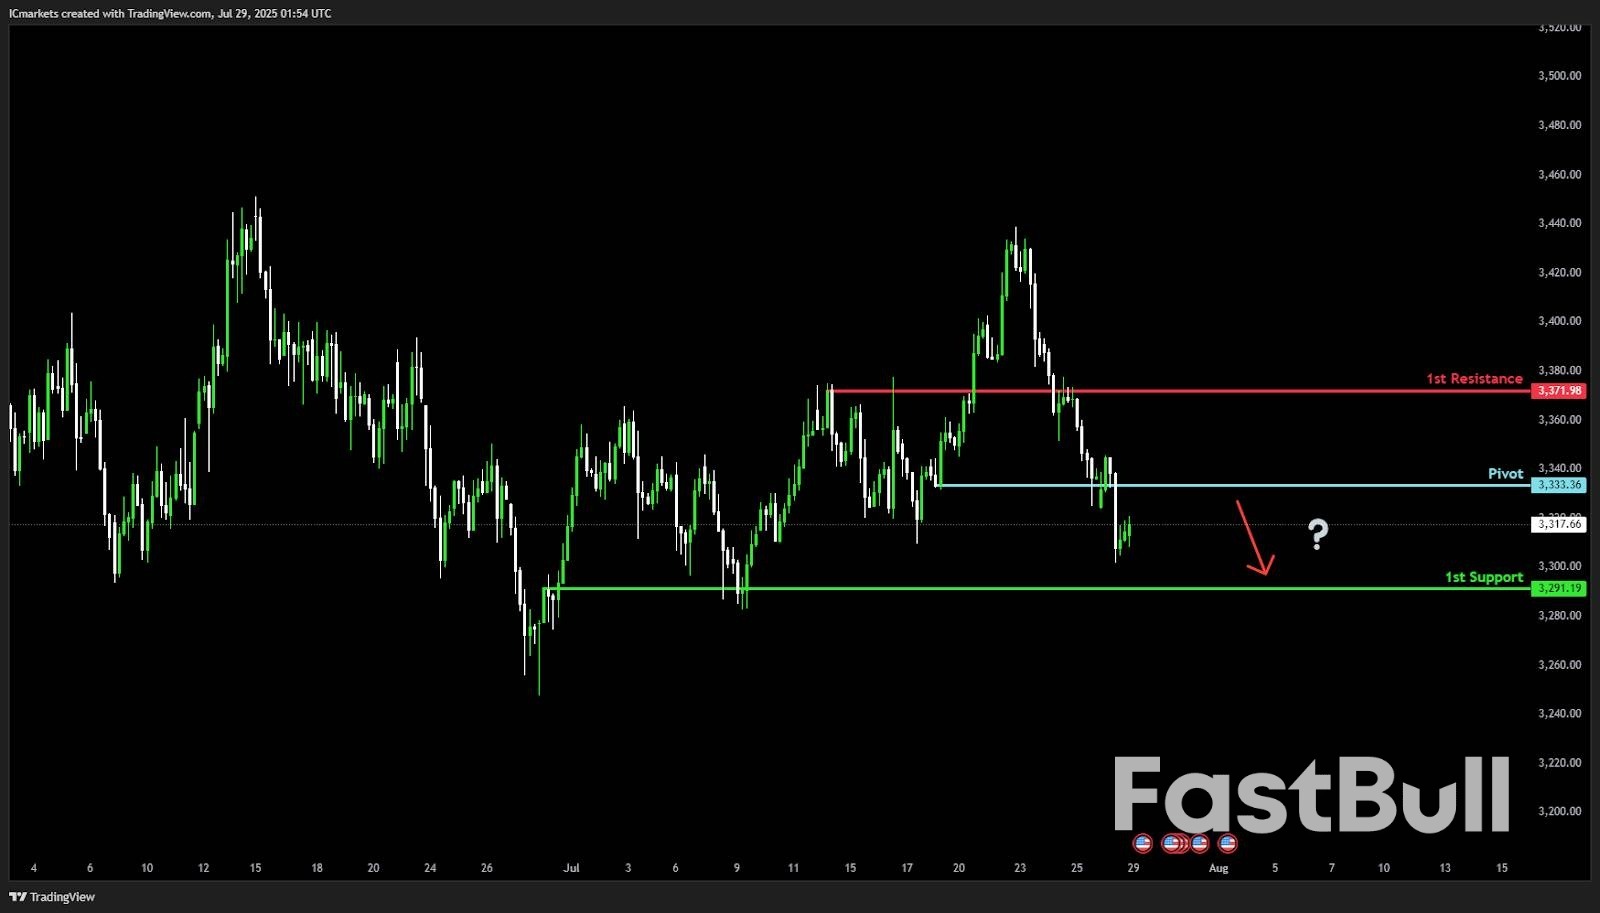
XAU/USD :
Potential Direction: Bearish
Overall momentum of the chart: Bullish
The price could make a bearish reversal off the pivot and drop toward the 1st support.Pivot: 3,333.36
Supporting reasons: Identified as a pullback resistance, indicating a potential area where selling pressures could intensify.
1st support: 3,291.19Supporting reasons: Identified as an overlap support, indicating a key level where the price could stabilize once more.
1st resistance: 3,371.98Supporting reasons: Identified as a swing high resistance, indicating a potential area that could halt any further upward movement.
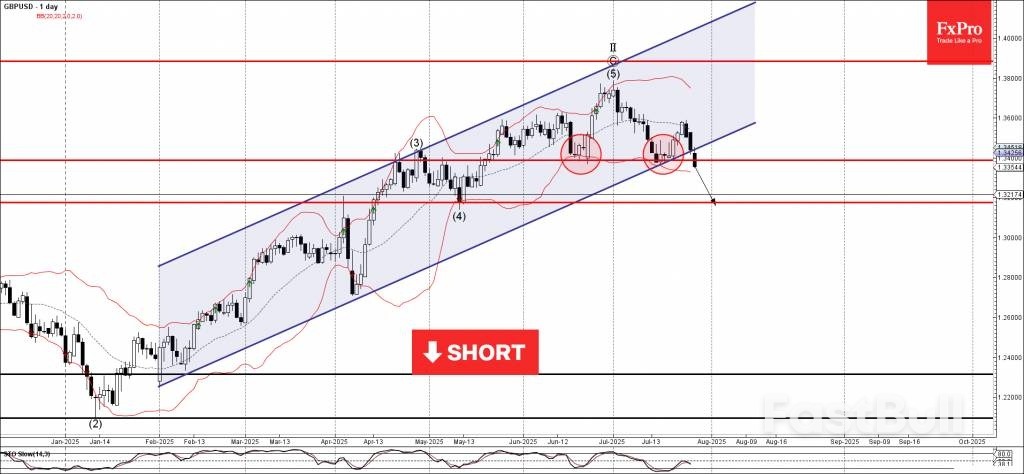
GBPUSD: ⬇️ Sell
– GBPUSD broke support zone
– Likely fall to support level 1.3175
GBPUSD currency pair recently broke the support zone between the support level 1.3385 (which has been reversing the price from June) and the support trendline of the daily up channel from January.The breakout of this support zone should accelerate the active intermediate impulse wave (1) from the start of July.
GBPUSD currency pair can be expected to fall to the next support level 1.3175 (former multi-month low from May, low of the earlier correction (4)).
728 RM B 7/F GEE LOK IND BLDG NO 34 HUNG TO RD KWUN TONG KLN HONG KONG


White Label
Data API
Web Plug-ins
Poster Maker
Affiliate Program
The risk of loss in trading financial instruments such as stocks, FX, commodities, futures, bonds, ETFs and crypto can be substantial. You may sustain a total loss of the funds that you deposit with your broker. Therefore, you should carefully consider whether such trading is suitable for you in light of your circumstances and financial resources.
No decision to invest should be made without thoroughly conducting due diligence by yourself or consulting with your financial advisors. Our web content might not suit you since we don't know your financial conditions and investment needs. Our financial information might have latency or contain inaccuracy, so you should be fully responsible for any of your trading and investment decisions. The company will not be responsible for your capital loss.
Without getting permission from the website, you are not allowed to copy the website's graphics, texts, or trademarks. Intellectual property rights in the content or data incorporated into this website belong to its providers and exchange merchants.
Not Logged In
Log in to access more features

FastBull Membership
Not yet
Purchase


Log In
Sign Up


