• Trade
  • Markets
  • Copy
  • Contests
  • News
  • 24/7
  • Calendar
  • Q&A
  • Chats
Trending
Screeners
SYMBOL
LAST
BID
ASK
HIGH
LOW
NET CHG.
%CHG.
SPREAD
SPX
S&P 500 Index
6901.01
6901.01
6901.01
6903.47
6833.46
+14.33
+ 0.21%
--
DJI
Dow Jones Industrial Average
48704.00
48704.00
48704.00
48756.34
48099.46
+646.26
+ 1.34%
--
IXIC
NASDAQ Composite Index
23593.85
23593.85
23593.85
23606.70
23308.95
-60.30
-0.25%
--
USDX
US Dollar Index
98.450
98.530
98.450
98.500
98.260
+0.130
+ 0.13%
--
EURUSD
Euro / US Dollar
1.17258
1.17265
1.17258
1.17459
1.17192
-0.00125
-0.11%
--
GBPUSD
Pound Sterling / US Dollar
1.33645
1.33652
1.33645
1.33997
1.33631
-0.00210
-0.16%
--
XAUUSD
Gold / US Dollar
4342.93
4343.34
4342.93
4345.97
4264.56
+63.64
+ 1.49%
--
WTI
Light Sweet Crude Oil
57.282
57.312
57.282
58.011
57.186
-0.359
-0.62%
--

Community Accounts

Signal Accounts
--
Profit Accounts
--
Loss Accounts
--
View More

Become a signal provider

Sell trading signals to earn additional income

View More

Guide to Copy Trading

Get started with ease and confidence

View More

Signal Accounts for Members

All Signal Accounts

Best Return
  • Best Return
  • Best P/L
  • Best MDD
Past 1W
  • Past 1W
  • Past 1M
  • Past 1Y

All Contests

  • All
  • Trump Updates
  • Recommend
  • Stocks
  • Cryptocurrencies
  • Central Banks
  • Featured News
Top News Only
Share

Cleveland Fed President Hammack: Would Like More Visibility Into Private Credit

Share

Cleveland Fed President Hammack: Private Credit Does Not Appear Large Enough Now To Create Systemic Risks

Share

Federal Reserve's Hammack: "Inflationary Pressures Coming Solely From Tariffs" Is Not Obvious

Share

Homeland Security Terminating Temporary Protected Status For Ethiopia -Federal Register

Share

Cleveland Fed President Hammack: Will Be Watching Carefully To See If Inflation Moderates And Jobs Stabilize

Share

Cleveland Fed President Hammack: Would Prefer For Fed Policy To Be A Little More Restrictive Than Current Level

Share

Cleveland Fed President Hammack: Right Now Fed Policy Is Right Around Neutral

Share

Cleveland Fed President Hammack: Fed's Decision This Week Was Complicated

Share

Federal Reserve's Hammack: The Federal Reserve Spends A Lot Of Time Studying AI

Share

Russian Government Has Extended Deferral Of Tax And Contribution Payments For Coal Companies Until March 2026

Share

Cleveland Fed President Hammack: Local Contacts Describe Low Hire, Low Fire Job Sector

Share

Fed Data - USA Effective Federal Funds Rate At 3.64 Percent On 11 December On $99 Billion In Trades Versus 3.89 Percent On $98 Billion On 10 December

Share

Cleveland Fed President Hammack: Has Every Confidence Next Fed Chair Will Be Focused On 2% Inflation Target

Share

Cleveland Fed President Hammack: Seeing Some Softening On Labor Side Of Economy

Share

Cleveland Fed President Hammack: Is Committed To Achieving Fed's 2% Inflation Target, Price Pressures Have Been Too High

Share

Cleveland Fed President Hammack: Weaker Dollar This Year Was Not About Moving Away From Currency

Share

Cleveland Fed President Hammack: Novel That A Fed Governor Retained A Connection To White House

Share

Cleveland Fed President Hammack: Independent Central Banks Deliver Better Outcomes

Share

Cleveland Fed President Hammack: 'Very Grateful' Government Data Is Returning

Share

Chicago Fed President Goolsbee: Take Some Comfort In Market-Based Measures Of Inflation, A Source Of Optimism About The Path Of Price Increases

TIME
ACT
FCST
PREV
U.K. Trade Balance Non-EU (SA) (Oct)

A:--

F: --

P: --

U.K. Trade Balance (Oct)

A:--

F: --

P: --

U.K. Services Index MoM

A:--

F: --

P: --

U.K. Construction Output MoM (SA) (Oct)

A:--

F: --

P: --

U.K. Industrial Output YoY (Oct)

A:--

F: --

P: --

U.K. Trade Balance (SA) (Oct)

A:--

F: --

P: --

U.K. Trade Balance EU (SA) (Oct)

A:--

F: --

P: --

U.K. Manufacturing Output YoY (Oct)

A:--

F: --

P: --

U.K. GDP MoM (Oct)

A:--

F: --

P: --

U.K. GDP YoY (SA) (Oct)

A:--

F: --

P: --

U.K. Industrial Output MoM (Oct)

A:--

F: --

P: --

U.K. Manufacturing Output MoM (Oct)

A:--

F: --

P: --

U.K. Monthly GDP 3M/3M Change (Oct)

A:--

F: --

P: --

U.K. Construction Output YoY (Oct)

A:--

F: --

P: --

France HICP Final MoM (Nov)

A:--

F: --

P: --

China, Mainland Outstanding Loans Growth YoY (Nov)

A:--

F: --

P: --

China, Mainland M2 Money Supply YoY (Nov)

A:--

F: --

P: --

China, Mainland M0 Money Supply YoY (Nov)

A:--

F: --

P: --

China, Mainland M1 Money Supply YoY (Nov)

A:--

F: --

P: --

India CPI YoY (Nov)

A:--

F: --

P: --

India Deposit Gowth YoY

A:--

F: --

P: --

Brazil Services Growth YoY (Oct)

A:--

F: --

P: --

Mexico Industrial Output YoY (Oct)

A:--

F: --

P: --

Russia Trade Balance (Oct)

A:--

F: --

P: --

Philadelphia Fed President Henry Paulson delivers a speech
Canada Building Permits MoM (SA) (Oct)

A:--

F: --

P: --

Canada Wholesale Sales YoY (Oct)

A:--

F: --

P: --

Canada Wholesale Inventory MoM (Oct)

A:--

F: --

P: --

Canada Wholesale Inventory YoY (Oct)

A:--

F: --

P: --

Canada Wholesale Sales MoM (SA) (Oct)

A:--

F: --

P: --

Germany Current Account (Not SA) (Oct)

A:--

F: --

P: --

U.S. Weekly Total Rig Count

--

F: --

P: --

U.S. Weekly Total Oil Rig Count

--

F: --

P: --

Japan Tankan Large Non-Manufacturing Diffusion Index (Q4)

--

F: --

P: --

Japan Tankan Small Manufacturing Outlook Index (Q4)

--

F: --

P: --

Japan Tankan Large Non-Manufacturing Outlook Index (Q4)

--

F: --

P: --

Japan Tankan Large Manufacturing Outlook Index (Q4)

--

F: --

P: --

Japan Tankan Small Manufacturing Diffusion Index (Q4)

--

F: --

P: --

Japan Tankan Large Manufacturing Diffusion Index (Q4)

--

F: --

P: --

Japan Tankan Large-Enterprise Capital Expenditure YoY (Q4)

--

F: --

P: --

China, Mainland Industrial Output YoY (YTD) (Nov)

--

F: --

P: --

China, Mainland Urban Area Unemployment Rate (Nov)

--

F: --

P: --

Saudi Arabia CPI YoY (Nov)

--

F: --

P: --

Euro Zone Industrial Output YoY (Oct)

--

F: --

P: --

Euro Zone Industrial Output MoM (Oct)

--

F: --

P: --

Canada Existing Home Sales MoM (Nov)

--

F: --

P: --

Euro Zone Total Reserve Assets (Nov)

--

F: --

P: --

Canada National Economic Confidence Index

--

F: --

P: --

Canada New Housing Starts (Nov)

--

F: --

P: --

U.S. NY Fed Manufacturing Employment Index (Dec)

--

F: --

P: --

U.S. NY Fed Manufacturing Index (Dec)

--

F: --

P: --

Canada Core CPI YoY (Nov)

--

F: --

P: --

Canada Manufacturing Unfilled Orders MoM (Oct)

--

F: --

P: --

Canada Manufacturing New Orders MoM (Oct)

--

F: --

P: --

Canada Core CPI MoM (Nov)

--

F: --

P: --

Canada Manufacturing Inventory MoM (Oct)

--

F: --

P: --

Canada CPI YoY (Nov)

--

F: --

P: --

Canada CPI MoM (Nov)

--

F: --

P: --

Canada CPI YoY (SA) (Nov)

--

F: --

P: --

Canada Core CPI MoM (SA) (Nov)

--

F: --

P: --

Canada CPI MoM (SA) (Nov)

--

F: --

P: --

Q&A with Experts
    • All
    • Chatrooms
    • Groups
    • Friends
    Connecting
    .
    .
    .
    Type here...
    Add Symbol or Code

      No matching data

      All
      Trump Updates
      Recommend
      Stocks
      Cryptocurrencies
      Central Banks
      Featured News
      • All
      • Russia-Ukraine Conflict
      • Middle East Flashpoint
      • All
      • Russia-Ukraine Conflict
      • Middle East Flashpoint

      Search
      Products

      Charts Free Forever

      Chats Q&A with Experts
      Screeners Economic Calendar Data Tools
      Membership Features
      Data Warehouse Market Trends Institutional Data Policy Rates Macro

      Market Trends

      Market Sentiment Order Book Forex Correlations

      Top Indicators

      Charts Free Forever
      Markets

      News

      News Analysis 24/7 Columns Education
      From Institutions From Analysts
      Topics Columnists

      Latest Views

      Latest Views

      Trending Topics

      Top Columnists

      Latest Update

      Signals

      Copy Rankings Latest Signals Become a signal provider AI Rating
      Contests
      Brokers

      Overview Brokers Assessment Rankings Regulators News Claims
      Broker listing Forex Brokers Comparison Tool Live Spread Comparison Scam
      Q&A Complaint Scam Alert Videos Tips to Detect Scam
      More

      Business
      Events
      Careers About Us Advertising Help Center

      White Label

      Data API

      Web Plug-ins

      Affiliate Program

      Awards Institution Evaluation IB Seminar Salon Event Exhibition
      Vietnam Thailand Singapore Dubai
      Fans Party Investment Sharing Session
      FastBull Summit BrokersView Expo
      Recent Searches
        Top Searches
          Markets
          News
          Analysis
          User
          24/7
          Economic Calendar
          Education
          Data
          • Names
          • Latest
          • Prev

          View All

          No data

          Scan to Download

          Faster Charts, Chat Faster!

          Download App
          English
          • English
          • Español
          • العربية
          • Bahasa Indonesia
          • Bahasa Melayu
          • Tiếng Việt
          • ภาษาไทย
          • Français
          • Italiano
          • Türkçe
          • Русский язык
          • 简中
          • 繁中
          Open Account
          Search
          Products
          Charts Free Forever
          Markets
          News
          Signals

          Copy Rankings Latest Signals Become a signal provider AI Rating
          Contests
          Brokers

          Overview Brokers Assessment Rankings Regulators News Claims
          Broker listing Forex Brokers Comparison Tool Live Spread Comparison Scam
          Q&A Complaint Scam Alert Videos Tips to Detect Scam
          More

          Business
          Events
          Careers About Us Advertising Help Center

          White Label

          Data API

          Web Plug-ins

          Affiliate Program

          Awards Institution Evaluation IB Seminar Salon Event Exhibition
          Vietnam Thailand Singapore Dubai
          Fans Party Investment Sharing Session
          FastBull Summit BrokersView Expo

          Big Week Ends With Big Doubts

          Swissquote

          Stocks

          Commodity

          Summary:

          The S&P 500 continued to push higher yesterday as the US 2-year yield wavered around the 3.50% mark following a Federal Reserve (Fed) rate cut earlier this week that was ultimately perceived as not that hawkish after all.

          The S&P 500 continued to push higher yesterday as the US 2-year yield wavered around the 3.50% mark following a Federal Reserve (Fed) rate cut earlier this week that was ultimately perceived as not that hawkish after all. The cut is especially boosting the non-tech pockets of the market.

          The S&P 500's equal-weight index is catching up with the tech-heavy, market-cap-weighted version, suggesting further upside potential from a rotation out of growth and into value. Normally, the tech and growth-heavy sectors react more to changes in borrowing costs because more of their future revenue gets discounted to today. But sky-high valuations in tech mean they've become less reactive to the rate cut. Investors clearly have bigger concerns.

          The Nasdaq 100 failed to eke out gains after the Fed cut, as a more-than-10% slump in Oracle shares dampened sentiment across tech and dragged broader AI names lower. Nvidia, for example, lost more than 1.5% on worries about the circularity of AI deals — and for being situated at the centre of the largest AI loop to date: the one surrounding OpenAI.

          If it's any comfort, OpenAI announced a $1bn deal with Disney yesterday. Under the agreement, Disney will invest $1bn in OpenAI, and OpenAI will allow Sora users to generate short videos using more than 200 Disney, Marvel, Pixar and Star Wars characters. You might remain sceptical, but this is an interesting revenue channel for OpenAI, as content creators may be willing to spend more on Sora — which has faded somewhat since launch — because these characters can boost engagement and monetisation on platforms like YouTube.

          This announcement is encouraging for those wondering how companies will monetise AI without relying heavily on advertising. The OpenAI–Disney partnership offers an alternative to flooding chatbots with ads — something that would make them feel as annoying as Facebook's feed. It doesn't have the same scale as ad revenue (Facebook earned $51.24 bn last quarter, with roughly $50.1 bn coming from advertising), but it does illustrate how OpenAI turns its models into dollars. The company has commercial deals across a wide range of industries. There is Microsoft, where Copilot uses OpenAI's intelligence. There is Eli Lilly — a major pharma company — working with OpenAI on AI-enabled R&D and drug discovery. There are commerce-related partnerships, such as Walmart's integration that lets users buy products through ChatGPT's conversational interface. OpenAI previously supported Shopify and Etsy with chat-commerce capabilities in exchange for fees. And it has an enterprise partnership with Databricks to embed OpenAI models into its platform. OpenAI needs a continuous flow of such deals to justify its lofty valuation and those of its partners, but the negative press often feels disproportionate for a company that fundamentally changed how we interact with machines only three years ago.

          Now, none of this answers whether "this is a bubble". The internet outlived the dot-com crisis even as countless companies disappeared. But it does show how far AI capabilities can extend across industries and clients — from Microsoft and Eli Lilly to Walmart and Disney — and how productivity gains, in blue-collar sectors, could support long-term demand.

          Turning to individual earnings, Broadcom reported very strong results yesterday. Revenue jumped 28% to $18 bn, and earnings surpassed expectations thanks to surging AI-chip demand. The company disclosed $73 bn in AI-related orders already booked, issued an upbeat Q1 revenue outlook of $19 bn, and raised its dividend by 10%. Not bad. The problem is that expectations were simply too high, and after an initial uptick the stock fell more than 4% in after-hours trading as investors focused on margin pressures and profit dynamics in AI.

          So we're back to square one. Taken together, Oracle and Broadcom reminded the market that while AI demand remains strong, leveraged investments and uncertain monetisation paths are preventing investors from adding exposure at current valuations.

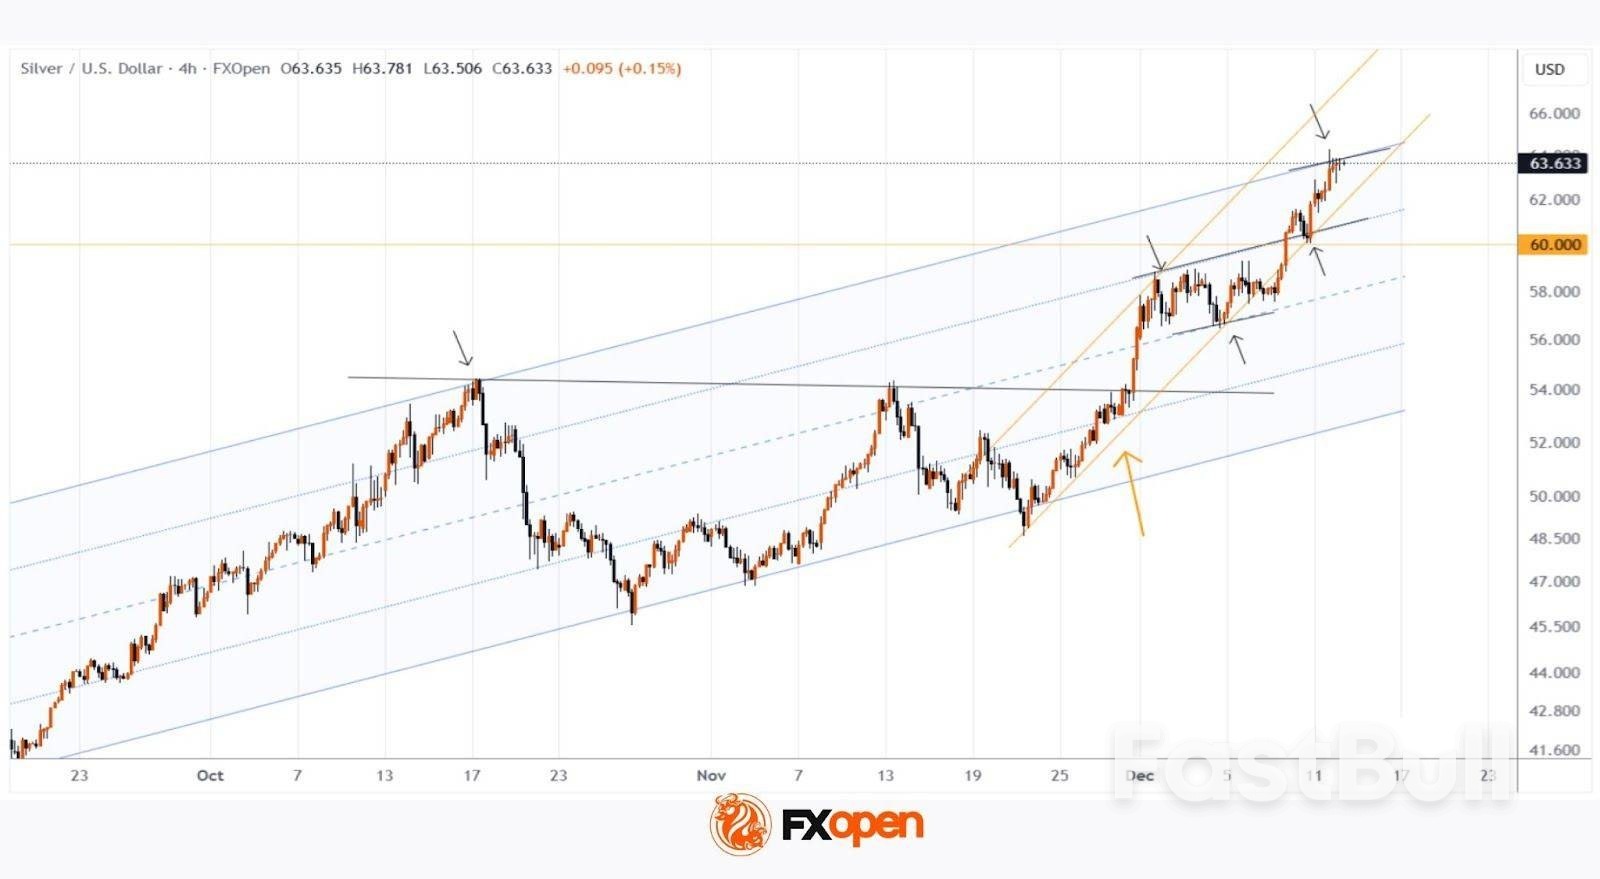
          Investors instead seem to prefer gold, silver, and copper. Gold is back in a solid uptrend after the October correction, supported by lower US yields and a softer dollar. Silver and copper benefit from the same bullish factors— plus tight supply conditions. Oil bulls, by contrast, remain impossible to cheer up. Despite earlier geopolitical tensions, WTI continues to test the $58 level on the downside, pressured by ample supply from the US, OPEC, and non-OPEC producers, even as the US dollar index falls below its 100-day moving average.

          This week ends on a dovish note for the Fed, a positive one for Treasuries, metals, and value stocks, and a negative one for the dollar, oil, and tech stocks. Next week's US CPI release — the first one since the shutdown — will either confirm or challenge the post-Fed trend. The last headline figure pointed to 3% inflation, still above the Fed's 2% target. A sufficiently soft CPI print would likely reinforce the recent price action into year-end and could deliver fresh all-time highs in some indices, especially the smaller and non-tech ones. A stronger reading could cool risk appetite and revive concerns that the Fed may not be able to cut rates next year if inflation remains sticky.

          Source: Swissquote Bank SA

          Risk Warnings and Disclaimers
          You understand and acknowledge that there is a high degree of risk involved in trading. Following any strategies or investment methods may lead to potential losses. The content on the site is provided by our contributors and analysts for information purposes only. You are solely responsible for determining whether any trading assets, securities, strategy, or any other product is suitable for investing based on your own investment objectives and financial situation.
          Add to Favorites
          Share

          EURUSD Surges Above 1.1700

          Winkelmann

          Forex

          Economic

          The EURUSD rate has risen above the 1.1700 level. The euro received support from the Fed's rate cut and slowing inflation in the eurozone.

          EURUSD forecast: key trading points

          · Market focus: Germany's consumer inflation for November remained at 2.3%
          · Current trend: an upward impulse is observed
          · EURUSD forecast for 12 December 2025: 1.1800 or 1.1650

          Fundamental analysis

          The US Federal Reserve implemented an expected 25-basis-point rate cut, while simultaneously signaling a likely pause in January as policymakers await additional data to assess the economic outlook.

          Meanwhile, investors have reduced expectations for further policy easing by the ECB after officials indicated that additional rate cuts may not be necessary in 2026.

          ECB President Christine Lagarde stated that the central bank will raise its eurozone growth forecasts next week, as the economy continues to demonstrate resilience despite ongoing trade tensions.

          EURUSD technical analysis

          On the H4 chart, EURUSD quotes continue to strengthen, rising above the 1.1700 level. The Alligator indicator has also turned upward following the price, suggesting that the euro's advance may continue in the near term. The key support area is located around 1.1650.

          Within the short-term EURUSD outlook, if bulls manage to maintain control, further growth toward the 1.1800 level and above is quite possible. If bears manage to regain the initiative, a pullback toward support at 1.1650 may occur.

          Summary

          The EURUSD price has risen above the 1.1700 mark. The ECB does not plan to cut interest rates in the near future.

          EURUSD 2026-2027 forecast: key market trends and future predictions

          This article provides the EURUSD forecast for 2026 and 2027 and highlights the main factors determining the direction of the pair's movements. We will apply technical analysis, take into account the opinions of leading experts, large banks, and financial institutions, and study AI-based forecasts. This comprehensive insight into EURUSD predictions should help investors and traders make informed decisions.

          Gold (XAUUSD) forecast 2026 and beyond: expert insights, price predictions, and analysis

          Dive deep into the Gold (XAUUSD) price outlook for 2026 and beyond, combining technical analysis, expert forecasts, and key macroeconomic factors. It explains the drivers behind gold's recent surge, explores potential scenarios including a move toward 4,500 to 5,000 USD per ounce, and highlights why the metal remains a strong hedge during global uncertainty.

          Source: RoboForex

          To stay updated on all economic events of today, please check out our Economic calendar
          Risk Warnings and Disclaimers
          You understand and acknowledge that there is a high degree of risk involved in trading. Following any strategies or investment methods may lead to potential losses. The content on the site is provided by our contributors and analysts for information purposes only. You are solely responsible for determining whether any trading assets, securities, strategy, or any other product is suitable for investing based on your own investment objectives and financial situation.
          Add to Favorites
          Share

          Intel’s Use of Tools from Sanctioned China-Linked Firm Sparks National Security Concerns

          Gerik

          Economic

          Intel’s Quiet Engagement with ACM Raises Regulatory Red Flags

          Intel, a pillar of America’s semiconductor ambitions and partially government-backed, has reportedly tested advanced chipmaking tools this year from ACM Research a company whose two overseas units, in Shanghai and South Korea, are subject to U.S. sanctions. The equipment in question, known as "wet etch tools," is used to clean and remove layers on silicon wafers and is considered critical in advanced semiconductor manufacturing. These tools were reportedly evaluated for Intel’s future 14A process, a cutting-edge chip fabrication platform scheduled for a 2027 debut.
          Although Intel's use of the tools does not appear to breach existing regulations, the association with a firm whose Chinese unit is restricted due to military-related concerns has rekindled anxiety among U.S. national security analysts and lawmakers. The central issue lies not only in the testing of the tools, but in the possibility that proprietary U.S. technology could be indirectly exposed or that ACM's products could be manipulated to compromise chip production.

          Sanctions, Executive Scrutiny, and Strategic Ambiguity

          The situation comes months after President Donald Trump publicly criticized Intel’s CEO amid broader concerns over China’s rising influence in the global chip supply chain. While Trump recently softened some of his chip export restrictions allowing Nvidia to resume sales of certain AI chips to China his administration, along with bipartisan lawmakers, continues to view Chinese toolmakers with suspicion.
          Recent legislative efforts aim to restrict the use of Chinese-made chip tools by any company benefiting from billions in U.S. semiconductor subsidies. Intel’s move to evaluate tools from ACM, despite their links to Chinese military-supported firms like SMIC and YMTC, appears to run counter to the spirit of these efforts even if it technically remains within legal boundaries.
          Chris McGuire, a former National Security Council official, emphasized the strategic risk: Chinese-linked tools could be manipulated remotely, potentially threatening U.S. chip supply chains or enabling Beijing to siphon off technological know-how. ACM counters this by asserting that its U.S. operations are completely segregated from its sanctioned Chinese units and that customer data is safeguarded under stringent internal protocols.

          Deep China Ties Despite U.S. Headquarters

          ACM Research was founded by David Wang, a U.S. citizen with Chinese permanent residence, who still holds majority voting control. Although headquartered in Fremont, California, the firm’s R&D operations are predominantly located in Shanghai. Its clientele includes multiple Chinese firms already under U.S. sanctions, including YMTC, CXMT, and SMIC entities tied to China’s military-industrial ambitions.
          These associations have caught the attention of U.S. regulators. The House Select Committee on China flagged ACM in a 2025 report for allegedly supplying semiconductor manufacturing equipment to a U.S.-based firm, suspected to be Intel, and formally certifying it for production use. Such interactions, even if legal, may enable backdoor support for China’s semiconductor ambitions through indirect technology transfers.

          ACM’s Expansion in the U.S. Raises Strategic Eyebrows

          Adding to the concerns is ACM’s 2023 opening of a facility in Hillsboro, Oregon just a mile from Intel’s premier R&D and fabrication plant. This “Silicon Forest” presence has reportedly facilitated direct engagement with Intel, with tool evaluations underway and further integration anticipated in 2026. Hedge fund Kerrisdale Capital reports that ACM is tailoring its Oregon facility to allow Intel to test wafers directly, suggesting a closer relationship than either company publicly acknowledges.
          Despite ACM’s claim that it is not a significant supplier to any U.S. chipmaker, industry sources indicate otherwise. Kerrisdale highlights “active tool evaluations” and notes that ACM’s U.S. lab upgrades were designed to deepen collaboration with Intel though whether this translates into full adoption remains unknown.

          Geopolitical Pressures and Market Dynamics Collide

          The broader context includes Beijing’s strategic push to dominate semiconductor manufacturing and reduce dependence on Western suppliers. ACM has grown its global market share in cleaning tools to 8%, per Gartner, and offers prices 20%–30% lower than Western competitors such as Applied Materials and Lam Research. This cost advantage, if sustained, may tempt even subsidy-backed U.S. firms to explore such options, further complicating Washington’s goal of decoupling critical technologies from Chinese influence.
          Moreover, as Chinese toolmakers make competitive gains, Washington risks a two-front dilemma: enforcing national security measures while maintaining competitiveness in a highly globalized industry. Intel’s exploratory engagement with ACM may therefore be more symptomatic of industry cost pressures and innovation demands than political intent but it still underscores the fragility of national tech safeguards.

          Intel’s ACM Engagement Highlights Systemic Vulnerability

          Intel’s testing of ACM tools, though not illegal, exposes persistent gaps in U.S. tech protection frameworks. The incident illustrates how globalized supply chains allow even firms under partial government ownership to brush up against sanctioned entities without regulatory fallout. While ACM insists its U.S. operations are independent and secure, the geopolitical implications particularly given ACM’s deep China ties suggest a need for more coherent, forward-looking policies.
          The causal link between China’s growing technological footprint and U.S. national security anxiety is evident. As Chinese toolmakers inch closer to parity, their presence in Western fabs, even indirectly, becomes a flashpoint. For Intel and its peers, the challenge now is to navigate rising cost and innovation demands without compromising strategic autonomy something current U.S. policy still struggles to enforce with clarity.

          Source: Reuters

          To stay updated on all economic events of today, please check out our Economic calendar
          Risk Warnings and Disclaimers
          You understand and acknowledge that there is a high degree of risk involved in trading. Following any strategies or investment methods may lead to potential losses. The content on the site is provided by our contributors and analysts for information purposes only. You are solely responsible for determining whether any trading assets, securities, strategy, or any other product is suitable for investing based on your own investment objectives and financial situation.
          Add to Favorites
          Share

          Silver Price Hits Historic Record Around $64

          FXOpen

          Forex

          Commodity

          On 27 November, we suggested that silver was preparing to challenge its all-time high. Since then (marked with the orange arrow), XAG/USD has risen by roughly 18%, breaking above the psychological $60-per-ounce threshold for the first time in history.

          The rally has been driven by strong retail inflows into silver ETFs, alongside expectations of a structural supply deficit by 2026 due to robust industrial demand—particularly from solar energy, electric vehicles, and data-centre infrastructure.

          The weakening of the US dollar following the Federal Reserve's decision on Wednesday also helped lift dollar-denominated silver to a new historic peak near $64.

          Technical Analysis of XAG/USD

          A review of the XAG/USD chart shows that the price has been moving within a rising channel that encapsulates the uptrend beginning in early September.

          Within this structure:→ the channel median acted as a springboard for price growth on 4 December;→ the line dividing the upper half of the channel into quarters switched from resistance (earlier in the month) to support on 10 December;→ silver is now trading near the channel's upper boundary, which may behave as significant resistance (as it did in mid-October).

          Given these factors, the market may now be heavily overheated, leaving it vulnerable to a correction. Should this scenario begin to unfold, we could see a bearish break of the steep upward trajectory that has lifted silver by around 30% from the 21 November low.

          Source: FXOpen

          Risk Warnings and Disclaimers
          You understand and acknowledge that there is a high degree of risk involved in trading. Following any strategies or investment methods may lead to potential losses. The content on the site is provided by our contributors and analysts for information purposes only. You are solely responsible for determining whether any trading assets, securities, strategy, or any other product is suitable for investing based on your own investment objectives and financial situation.
          Add to Favorites
          Share

          General Market Analysis – 12/12/25

          IC Markets

          Forex

          Stocks

          US Stocks Mixed After Fed – Dow up 1.3%

          US equity markets were mixed overnight as investors continued to weigh the implications of the Fed's latest rate cut. The Dow led the way, jumping 1.34% to finish at 48,704, while the S&P 500 managed a modest 0.21% rise to 6,901, both securing fresh record closes. The Nasdaq, however, slipped 0.25% to 23,593 after tech heavyweight Oracle issued a weaker-than-expected forecast, reigniting concerns that parts of the AI sector may be running ahead of fundamentals.

          In FX, the US dollar softened again, with the DXY easing 0.29% to 98.34, even as Treasury yields edged higher. The 2-year yield nudged up 0.3 bps to 3.541%, while the 10-year added 1 bp to 4.157%. Oil extended its recent decline, with Brent slipping 0.96% to $61.62 and WTI down 0.91% to $57.93, as markets drew optimism from renewed hopes for progress toward a Ukraine peace deal. Gold rallied strongly, climbing 1.06% to $4,278.85, supported by haven flows and momentum following yesterday's Fed decision.

          Investor Glasses Still Half Full for Christmas Drinks

          Major US indices pushed higher in trading yesterday to hit fresh all-time high closes as investors continued to cheer the Fed's interest rate cut on Wednesday and advice that we will see at least one more in 2026. The Dow and S&P hit records, while the Nasdaq fell marginally, which wasn't a bad result given an 11% drop for Oracle.

          The market seems to be driving forward into the year-end with the same 'glass half full' mentality that has carried it to records in 2025, and investors are happy to jump on that bandwagon. However, there are some that fear a significant early-2026 hangover could be coming their way, with growth tech firms involved in AI looking to be the highest risk for some sharp corrections in the current environment – as we saw with Oracle yesterday. In addition to those fears, the Fed left plenty of wiggle room for hawks out there as well, despite the market's initial reaction to Wednesday's cut – so for now, investors are happy to eat, drink, and be merry while the good times last, but are wary that things can sometimes look different in the cold light of a fresh new day – or fresh new year!

          Markets Strong into the Weekend

          With the macro calendar far quieter today, traders may still see swings across markets as they continue to digest the heavy run of central bank updates and geopolitical developments from earlier in the week. The Asian session is expected to have a relatively quiet start to the day; however, with products trading at significant levels, traders are expecting things to liven up as the day progresses.

          The European session sees the release of the only tier 1 data of the day, with the UK GDP numbers due out. The month-on-month figure is expected to show just a 0.1% increase, and any deviation from this will see big moves in the pound, anything lower likely to put more pressure on the Bank of England ahead of next week's interest rate call. There is little on the calendar in the New York session today, which should see smoother trading conditions; however, as above, with indices at all-time highs and the Fed update still fresh in investors' minds, most traders are expecting another lively session.

          Source: IC Markets

          Risk Warnings and Disclaimers
          You understand and acknowledge that there is a high degree of risk involved in trading. Following any strategies or investment methods may lead to potential losses. The content on the site is provided by our contributors and analysts for information purposes only. You are solely responsible for determining whether any trading assets, securities, strategy, or any other product is suitable for investing based on your own investment objectives and financial situation.
          Add to Favorites
          Share

          Taiwan Tech Rally Defies AI Bubble Fears as Local Investors Bet on Structural Edge

          Gerik

          Economic

          Local Confidence Anchors Taiwan's Market Amid Global Skepticism

          As global markets begin to exhibit caution toward artificial intelligence stocks, Taiwan’s domestic investors are charging ahead, undeterred by the fear of an AI valuation bubble. The island’s benchmark stock index is on track to breach the symbolic 30,000-point mark in early 2026, having nearly doubled over the past three years. This optimism is rooted not just in speculation, but in Taiwan’s strategic position as the nucleus of the global semiconductor ecosystem powering the AI revolution.
          Despite net foreign outflows exceeding NT$533.8 billion (approximately $17 billion) in 2025 alone, the market remains resilient. Local investors appear more focused on long-term structural fundamentals than on short-term volatility or macroeconomic noise. This divergence in sentiment reflects a deeper belief that Taiwan’s supply-side advantages give it a unique buffer against AI market volatility.

          Semiconductors Secure Taiwan’s Central Role in AI Evolution

          Concerns about Nvidia’s future market dominance have surfaced globally as Google’s custom TPUs threaten to undercut GPU pricing. However, Taiwan benefits either way. As the foundational base for both Nvidia’s GPUs and Google’s TPUs, Taiwan stands to gain from rising demand regardless of who leads the AI hardware race.
          TSMC, the world’s largest contract chip manufacturer, sits at the heart of this hardware production cycle, along with AI-aligned firms like Foxconn, Elite Material, and other upstream suppliers. Analysts argue that the strength of Taiwan’s order books and the pace of innovation in high-end chips will keep revenue momentum intact well into 2027.
          Goldman Sachs projects that hyperscaler investment globally will grow to $552 billion in 2026 and $644 billion in 2027, which further reinforces the long-term outlook for hardware demand. Gina Kim of Nordea Asset Management also emphasizes that Taiwan’s role in AI and advanced semiconductors remains “structurally intact,” suggesting persistent upside potential.

          No Bubble in Sight, Say Analysts and Fund Managers

          Unlike the speculative fervor that marked the dot-com boom, Taiwan’s AI-linked stocks are supported by real earnings and competitive business models. The market’s current price-to-earnings (P/E) ratio stands at a relatively moderate 21, lower than both the Nasdaq and Japan’s Nikkei, indicating that despite soaring valuations, Taiwan’s market isn’t detached from corporate fundamentals.
          Li Fang-kuo, head of Uni-President’s securities investment division, dismisses bubble fears, arguing that companies like Nvidia and other “magnificent seven” names enjoy gross margins of 70% or more figures that are not remotely comparable to the revenue-less companies of the early 2000s.
          This sentiment is echoed by Goldman Sachs, whose strategists maintain an overweight position on tech and AI shares, stating that the current cycle, while frothy in appearance, does not yet meet the criteria of a speculative bubble.

          Foreign Sell-Off Contrasts With Strong Domestic Accumulation

          While foreign investors have continued to reduce their exposure driven by concerns about trade tensions, AI profit sustainability, and a desire to lock in gains domestic capital has filled the vacuum. Analysts attribute this divergence not to opposing market views, but to different time horizons and risk tolerances.
          Foreign investors, often guided by macro-hedging strategies, have been more reactive to rising tensions with Beijing and broader geopolitical instability. Yet these same issues appear to have less influence on local institutions and retail investors, who instead focus on Taiwan’s entrenched role in global tech supply chains.
          HSBC strategists recently noted that the average Asian portfolio contains a 10% allocation to a single stock TSMC highlighting both concentration risk and the confidence investors place in Taiwan’s leading position.

          Taiwan’s Strategic Position Shields It From AI Volatility

          While the rest of the world debates whether the AI boom has morphed into a bubble, Taiwan's domestic investors are doubling down. They are buoyed by a clear structural advantage: the island's indispensable role in manufacturing the core hardware powering the global AI transition.
          The market’s upward trajectory, backed by robust earnings and manageable valuations, presents a contrast to the overheated conditions that typically precede a bubble burst. As long as capital expenditure in AI infrastructure continues to rise, and Taiwan maintains its dominance in advanced semiconductors, the rally appears far from over regardless of who leads the AI race.
          Even with foreign capital fleeing and geopolitical risks looming, Taiwan's market narrative remains internally driven, structurally resilient, and fundamentally optimistic. The island’s near-future market prospects will likely be shaped less by fears of overvaluation and more by the durable demand for the silicon foundation of tomorrow’s intelligent machines.

          Source: Reuters

          To stay updated on all economic events of today, please check out our Economic calendar
          Risk Warnings and Disclaimers
          You understand and acknowledge that there is a high degree of risk involved in trading. Following any strategies or investment methods may lead to potential losses. The content on the site is provided by our contributors and analysts for information purposes only. You are solely responsible for determining whether any trading assets, securities, strategy, or any other product is suitable for investing based on your own investment objectives and financial situation.
          Add to Favorites
          Share

          U.K. Economy Unexpectedly Contracted in October; GDP Dropped 0.1%

          Glendon

          Forex

          Economic

          The U.K. economy unexpectedly remained in contraction in October, with uncertainty ahead of the Autumn budget by Chancellor Rachel Reeves likely curtailing growth.

          Data released earlier Friday by the Office for National Statistics showed that U.K. gross domestic product fell by 0.1% on a monthly basis in October, matching the drop seen during the prior month and below the 0.1% growth expected.

          On an annual basis, the U.K. economy expanded by 1.1% in October, matching the growth seen the previous month and below the 1.4% growth expected

          The manufacturing sector reported growth of 0.5% in October, rebounding from the hefty 1.7% drop the previous month, boosted by the restart of operations at Jaguar Land Rover's factories early in the month, after a cyber attack.

          For more discussion surrounding economic data releases from top Wall Street analysts, subscribe to InvestingPro - get 55% off today

          The uncertainty surrounding the Autumn budget, delivered by U.K. finance minister Rachel Reeves in November, likely deterred businesses and consumers alike from making investment decisions.

          In the end, Reeves did raise taxes to give her greater room to meet her deficit-reduction targets as well as fund higher welfare spending, but not by as much as had been feared.

          As a result, the Confederation of British Industry earlier Friday lifted up its economic growth forecast for next year, citing a temporary boost to government spending following the budget.

          The business association predicted the U.K. economy will grow 1.3% next year, up from its previous forecast of 1.0% in June, and also lifted its forecast for this year to 1.4% from 1.2%, reflecting upward revisions to recent official data.

          "While it's welcome to see our growth forecast upgraded for next year, the mood music reads more 'cautious optimism' than 'cause for celebration'," CBI chief economist Louise Hellem said.

          The Bank of England holds its final policy-setting meeting of the year next week, and is widely expected to cut interest rates by a quarter point to 3.75% as recent data has shown inflation drifting lower.

          British inflation fell in October for the first time since May, to 3.6% from 3.8%, in line with the central bank's expectations, and November data due next week could show a further drift downwards.

          The BOE held interest rates unchanged at 4.0% in November, but this was a close call with four out of the nine policymakers voting for a rate reduction.

          Source: Investing

          To stay updated on all economic events of today, please check out our Economic calendar
          Risk Warnings and Disclaimers
          You understand and acknowledge that there is a high degree of risk involved in trading. Following any strategies or investment methods may lead to potential losses. The content on the site is provided by our contributors and analysts for information purposes only. You are solely responsible for determining whether any trading assets, securities, strategy, or any other product is suitable for investing based on your own investment objectives and financial situation.
          Add to Favorites
          Share
          FastBull
          Copyright © 2025 FastBull Ltd

          728 RM B 7/F GEE LOK IND BLDG NO 34 HUNG TO RD KWUN TONG KLN HONG KONG

          TelegramInstagramTwitterfacebooklinkedin
          App Store Google Play Google Play
          Products
          Charts

          Chats

          Q&A with Experts
          Screeners
          Economic Calendar
          Data
          Tools
          Membership
          Features
          Function
          Markets
          Copy Trading
          Latest Signals
          Contests
          News
          Analysis
          24/7
          Columns
          Education
          Company
          Careers
          About Us
          Contact Us
          Advertising
          Help Center
          Feedback
          User Agreement
          Privacy Policy
          Business

          White Label

          Data API

          Web Plug-ins

          Poster Maker

          Affiliate Program

          Risk Disclosure

          The risk of loss in trading financial instruments such as stocks, FX, commodities, futures, bonds, ETFs and crypto can be substantial. You may sustain a total loss of the funds that you deposit with your broker. Therefore, you should carefully consider whether such trading is suitable for you in light of your circumstances and financial resources.

          No decision to invest should be made without thoroughly conducting due diligence by yourself or consulting with your financial advisors. Our web content might not suit you since we don't know your financial conditions and investment needs. Our financial information might have latency or contain inaccuracy, so you should be fully responsible for any of your trading and investment decisions. The company will not be responsible for your capital loss.

          Without getting permission from the website, you are not allowed to copy the website's graphics, texts, or trademarks. Intellectual property rights in the content or data incorporated into this website belong to its providers and exchange merchants.

          Not Logged In

          Log in to access more features

          FastBull Membership

          Not yet

          Purchase

          Become a signal provider
          Help Center
          Customer Service
          Dark Mode
          Price Up/Down Colors

          Log In

          Sign Up

          Position
          Layout
          Fullscreen
          Default to Chart
          The chart page opens by default when you visit fastbull.com