• Trade
  • Markets
  • Copy
  • Contests
  • News
  • 24/7
  • Calendar
  • Q&A
  • Chats
Trending
Screeners
SYMBOL
LAST
BID
ASK
HIGH
LOW
NET CHG.
%CHG.
SPREAD
SPX
S&P 500 Index
6829.76
6829.76
6829.76
6878.28
6827.18
-40.64
-0.59%
--
DJI
Dow Jones Industrial Average
47639.21
47639.21
47639.21
47971.51
47611.93
-315.77
-0.66%
--
IXIC
NASDAQ Composite Index
23461.67
23461.67
23461.67
23698.93
23455.05
-116.44
-0.49%
--
USDX
US Dollar Index
99.030
99.110
99.030
99.160
98.730
+0.080
+ 0.08%
--
EURUSD
Euro / US Dollar
1.16365
1.16373
1.16365
1.16717
1.16162
-0.00061
-0.05%
--
GBPUSD
Pound Sterling / US Dollar
1.33217
1.33226
1.33217
1.33462
1.33053
-0.00095
-0.07%
--
XAUUSD
Gold / US Dollar
4184.67
4185.01
4184.67
4218.85
4175.92
-13.24
-0.32%
--
WTI
Light Sweet Crude Oil
58.565
58.595
58.565
60.084
58.495
-1.244
-2.08%
--

Community Accounts

Signal Accounts
--
Profit Accounts
--
Loss Accounts
--
View More

Become a signal provider

Sell trading signals to earn additional income

View More

Guide to Copy Trading

Get started with ease and confidence

View More

Signal Accounts for Members

All Signal Accounts

Best Return
  • Best Return
  • Best P/L
  • Best MDD
Past 1W
  • Past 1W
  • Past 1M
  • Past 1Y

All Contests

  • All
  • Trump Updates
  • Recommend
  • Stocks
  • Cryptocurrencies
  • Central Banks
  • Featured News
Top News Only
Share

U.S. Senate Democratic Member And Antitrust Activist Warren Stated That Paramount Skydance's Hostile Takeover Offer Triggered A "Level 5 Antitrust Alert."

Share

Benin Government: Coup Plotters Kidnapped Two Senior Military Officials Who Were Later Freed

Share

Canada: G7 Finance Ministers Discussed Export Controls And Critical Minerals In Call

Share

Benin Government: Nigeria Carried Out Air Strikes To Help Thwart Coup Bid

Share

Fitch: Expects General Government (Gg) Deficit To Fall Modestly In Canada And But Rise Modestly In USA In 2026

Share

An Important Point Of Consensus Was Concern Regarding Application Of Non-Market Policies, Including Export Controls, To Critical Minerals Supply Chains

Share

Fitch: Despite Full-Year Impact Of Tariffs, We Expect USA Fiscal Deficit To Widen In 2026 Due To Additional Tax Cuts Under One Big Beautiful Bill Act

Share

Private Equity Firm Cinven Has Signed A £190 Million Deal To Acquire A Majority Stake In UK Advisory Firm Flint Global

Share

Bank Of England's Taylor Expects Inflation To Fall To Target 'In The Near Term'

Share

Ukraine President Zelenskiy: He Will Travel To Italy On Tuesday

Share

China Is Not Interested In Forcing Russia To End Its War In Ukraine

Share

ICE Certified Arabica Stocks Decreased By 5144 As Of December 08, 2025

Share

UK Government: Leaders All Agreed That "Now Is A Critical Moment And That We Must Continue To Ramp Up Support To Ukraine And Economic Pressure On Putin"

Share

UK Government: After Meeting With The Leaders Of France, Germany And Ukraine, UK Prime Minister Convened A Call With Other European Allies To Update Them On The Latest Situation

Share

Am Best: US Incurred Asbestos Losses Rise Again In 2024 To $1.5 Billion

Share

Readout Of UK Prime Minister's Engagements With Counterparts From France, Germany And European Partners: Discussed Positive Progress Made To Use Immobilised Russian Sovereign Assets To Support Ukraine's Reconstruction

Share

New York Fed Accepts $1.703 Billion Of $1.703 Billion Submitted To Reverse Repo Facility On Dec 08

Share

Ukraine President Zelenskiy: Coalition Of Willing Meeting To Take Place This Week

Share

Ukraine President Zelenskiy: Ukraine Lacks $800 Million For USA Weapons Purchase Programme This Year

Share

Zimbabwe's President Removes Winston Chitando As Mines Minister, Replaces Him With Polite Kambamura

TIME
ACT
FCST
PREV
France Trade Balance (SA) (Oct)

A:--

F: --

P: --
Euro Zone Employment YoY (SA) (Q3)

A:--

F: --

P: --
Canada Part-Time Employment (SA) (Nov)

A:--

F: --

P: --

Canada Unemployment Rate (SA) (Nov)

A:--

F: --

P: --

Canada Full-time Employment (SA) (Nov)

A:--

F: --

P: --

Canada Labor Force Participation Rate (SA) (Nov)

A:--

F: --

P: --

Canada Employment (SA) (Nov)

A:--

F: --

P: --

U.S. PCE Price Index MoM (Sept)

A:--

F: --

P: --

U.S. Personal Income MoM (Sept)

A:--

F: --

P: --

U.S. Core PCE Price Index MoM (Sept)

A:--

F: --

P: --

U.S. PCE Price Index YoY (SA) (Sept)

A:--

F: --

P: --

U.S. Core PCE Price Index YoY (Sept)

A:--

F: --

P: --

U.S. Personal Outlays MoM (SA) (Sept)

A:--

F: --

P: --
U.S. 5-10 Year-Ahead Inflation Expectations (Dec)

A:--

F: --

P: --

U.S. Real Personal Consumption Expenditures MoM (Sept)

A:--

F: --

P: --
U.S. Weekly Total Rig Count

A:--

F: --

P: --

U.S. Weekly Total Oil Rig Count

A:--

F: --

P: --

U.S. Consumer Credit (SA) (Oct)

A:--

F: --

P: --
China, Mainland Foreign Exchange Reserves (Nov)

A:--

F: --

P: --

Japan Trade Balance (Oct)

A:--

F: --

P: --

Japan Nominal GDP Revised QoQ (Q3)

A:--

F: --

P: --

China, Mainland Imports YoY (CNH) (Nov)

A:--

F: --

P: --

China, Mainland Exports (Nov)

A:--

F: --

P: --

China, Mainland Imports (CNH) (Nov)

A:--

F: --

P: --

China, Mainland Trade Balance (CNH) (Nov)

A:--

F: --

P: --

China, Mainland Exports YoY (USD) (Nov)

A:--

F: --

P: --

China, Mainland Imports YoY (USD) (Nov)

A:--

F: --

P: --

Germany Industrial Output MoM (SA) (Oct)

A:--

F: --

P: --
Euro Zone Sentix Investor Confidence Index (Dec)

A:--

F: --

P: --

Canada National Economic Confidence Index

A:--

F: --

P: --

U.K. BRC Like-For-Like Retail Sales YoY (Nov)

--

F: --

P: --

U.K. BRC Overall Retail Sales YoY (Nov)

--

F: --

P: --

Australia Overnight (Borrowing) Key Rate

--

F: --

P: --

RBA Rate Statement
RBA Press Conference
Germany Exports MoM (SA) (Oct)

--

F: --

P: --

U.S. NFIB Small Business Optimism Index (SA) (Nov)

--

F: --

P: --

Mexico 12-Month Inflation (CPI) (Nov)

--

F: --

P: --

Mexico Core CPI YoY (Nov)

--

F: --

P: --

Mexico PPI YoY (Nov)

--

F: --

P: --

U.S. Weekly Redbook Index YoY

--

F: --

P: --

U.S. JOLTS Job Openings (SA) (Oct)

--

F: --

P: --

China, Mainland M1 Money Supply YoY (Nov)

--

F: --

P: --

China, Mainland M0 Money Supply YoY (Nov)

--

F: --

P: --

China, Mainland M2 Money Supply YoY (Nov)

--

F: --

P: --

U.S. EIA Short-Term Crude Production Forecast For The Year (Dec)

--

F: --

P: --

U.S. EIA Natural Gas Production Forecast For The Next Year (Dec)

--

F: --

P: --

U.S. EIA Short-Term Crude Production Forecast For The Next Year (Dec)

--

F: --

P: --

EIA Monthly Short-Term Energy Outlook
U.S. API Weekly Gasoline Stocks

--

F: --

P: --

U.S. API Weekly Cushing Crude Oil Stocks

--

F: --

P: --

U.S. API Weekly Crude Oil Stocks

--

F: --

P: --

U.S. API Weekly Refined Oil Stocks

--

F: --

P: --

South Korea Unemployment Rate (SA) (Nov)

--

F: --

P: --

Japan Reuters Tankan Non-Manufacturers Index (Dec)

--

F: --

P: --

Japan Reuters Tankan Manufacturers Index (Dec)

--

F: --

P: --

Japan Domestic Enterprise Commodity Price Index MoM (Nov)

--

F: --

P: --

Japan Domestic Enterprise Commodity Price Index YoY (Nov)

--

F: --

P: --

China, Mainland PPI YoY (Nov)

--

F: --

P: --

China, Mainland CPI MoM (Nov)

--

F: --

P: --

Italy Industrial Output YoY (SA) (Oct)

--

F: --

P: --

Q&A with Experts
    • All
    • Chatrooms
    • Groups
    • Friends
    Connecting
    .
    .
    .
    Type here...
    Add Symbol or Code

      No matching data

      All
      Trump Updates
      Recommend
      Stocks
      Cryptocurrencies
      Central Banks
      Featured News
      • All
      • Russia-Ukraine Conflict
      • Middle East Flashpoint
      • All
      • Russia-Ukraine Conflict
      • Middle East Flashpoint
      Search
      Products

      Charts Free Forever

      Chats Q&A with Experts
      Screeners Economic Calendar Data Tools
      Membership Features
      Data Warehouse Market Trends Institutional Data Policy Rates Macro

      Market Trends

      Market Sentiment Order Book Forex Correlations

      Top Indicators

      Charts Free Forever
      Markets

      News

      News Analysis 24/7 Columns Education
      From Institutions From Analysts
      Topics Columnists

      Latest Views

      Latest Views

      Trending Topics

      Top Columnists

      Latest Update

      Signals

      Copy Rankings Latest Signals Become a signal provider AI Rating
      Contests
      Brokers

      Overview Brokers Assessment Rankings Regulators News Claims
      Broker listing Forex Brokers Comparison Tool Live Spread Comparison Scam
      Q&A Complaint Scam Alert Videos Tips to Detect Scam
      More

      Business
      Events
      Careers About Us Advertising Help Center

      White Label

      Data API

      Web Plug-ins

      Affiliate Program

      Awards Institution Evaluation IB Seminar Salon Event Exhibition
      Vietnam Thailand Singapore Dubai
      Fans Party Investment Sharing Session
      FastBull Summit BrokersView Expo
      Recent Searches
        Top Searches
          Markets
          News
          Analysis
          User
          24/7
          Economic Calendar
          Education
          Data
          • Names
          • Latest
          • Prev

          View All

          No data

          Scan to Download

          Faster Charts, Chat Faster!

          Download App
          English
          • English
          • Español
          • العربية
          • Bahasa Indonesia
          • Bahasa Melayu
          • Tiếng Việt
          • ภาษาไทย
          • Français
          • Italiano
          • Türkçe
          • Русский язык
          • 简中
          • 繁中
          Open Account
          Search
          Products
          Charts Free Forever
          Markets
          News
          Signals

          Copy Rankings Latest Signals Become a signal provider AI Rating
          Contests
          Brokers

          Overview Brokers Assessment Rankings Regulators News Claims
          Broker listing Forex Brokers Comparison Tool Live Spread Comparison Scam
          Q&A Complaint Scam Alert Videos Tips to Detect Scam
          More

          Business
          Events
          Careers About Us Advertising Help Center

          White Label

          Data API

          Web Plug-ins

          Affiliate Program

          Awards Institution Evaluation IB Seminar Salon Event Exhibition
          Vietnam Thailand Singapore Dubai
          Fans Party Investment Sharing Session
          FastBull Summit BrokersView Expo

          Bessent Says He’s Not Pushing Fed Cuts, Just Touting Models

          James Whitman

          Economic

          Central Bank

          Summary:

          US Treasury Secretary Scott Bessent said he isn’t calling for a series of interest-rate cuts from the Federal Reserve (Fed), just pointing out that models suggest a “neutral” rate would be about 1.5 percentage points lower.

          US Treasury Secretary Scott Bessent said he isn’t calling for a series of interest-rate cuts from the Federal Reserve (Fed), just pointing out that models suggest a “neutral” rate would be about 1.5 percentage points lower.

          “I didn’t tell the Fed what to do,” Bessent said on Thursday in an interview on Fox Business, referring to his comments a day before about how the central bank “could go into a series of rate cuts here”.

          Bessent said Thursday that “what I said was that to get to a neutral rate on interest, that that would be approximately a 150-basis-point cut”.

          The so-called neutral rate is the level at which policy neither stimulates nor restricts the economy. Fed chair Jerome Powell said July 30 that there are “a range of views of what the neutral rate is at this moment for our economy” and that his own estimate was that the current setting was “modestly restrictive”.

          “I believe that there is room, if one believes in the neutral rate,” for a series of rate cuts, Bessent said. “I am not calling for one. I didn’t call for one. I just said that a model of a neutral rate is approximately 150 basis points lower.”

          The Fed last month kept its target range for the benchmark rate at 4.25% to 4.5%. The median estimate of the neutral rate among Fed officials over the long run is 3%. Powell and many of his colleagues have for months argued that more time was needed to assess any impact on inflation and inflation expectations from President Donald Trump’s tariff hikes.

          ‘Direct’ pressure

          Trump has regularly criticised Powell for holding rates. Bessent, after taking the Treasury’s helm, said he would only address past Fed actions, not future ones, but later weighed in on what he thought markets were expecting monetary policymakers to do. This week, he has taken to referring to economic models, and has repeatedly suggested a 50-basis-point rate cut is possible at the Fed’s September meeting.

          “It’s not really the role of the Treasury secretary to opine” on the neutral rate, said Julia Coronado, the founder of the research firm MacroPolicy Perspectives and a former Fed economist. “The fact that the most senior economic official in the administration is saying these things publicly is direct, public pressure on what he wants the Fed to do.”

          Former Treasury secretary Lawrence Summers, who served under Democratic president Bill Clinton, said he was “surprised” to see Bessent’s remarks on Wednesday.

          “Usually that kind of judgement is not made by administration officials, and I am not sure it’s helpful for the administration to be publicly prescribing on monetary policy,” Summers said on Bloomberg Television’s Wall Street Week with David Westin.

          Futures pricing

          Summers, a paid contributor to Bloomberg TV, also suggested that a measure of the neutral rate should incorporate the effects of large budget deficits and elevated demand for funds to pay for data centres — along with higher asset prices that reduce the flow of funds into savings. Against that backdrop, “you wouldn’t be prescribing a 175 basis point cut in rates unless we see a recession”.

          Interest-rate futures as of Thursday morning reflect bets that the Fed will cut rates by less than a cumulative 150 basis points by the end of next year. They also show slightly less confidence in a 25-basis-point reduction at the September meeting. The retreat came after a release on US wholesale inflation showed those prices climbed by the most in three years.

          Speaking to Bloomberg Television on Wednesday, Bessent said “if you look at any model” it suggests that “we should probably be 150, 175 basis points lower” on the Fed’s benchmark. He also said that officials might have cut rates if they had been aware of the revised data on the labour market that came out a couple of days after the latest meeting. “I suspect we could have had rate cuts in June and July,” Bessent said.

          Which model?

          “I don’t know what model he’s talking about,” said Jim Bianco, the president of Bianco Research and a long-time Fed and Treasury watcher. “There is no model I am aware of that says it should be that low,” he said of the Fed’s benchmark.

          Other gauges of where the Fed should be, such as the Taylor rule, also aren’t arguing that the main rate should be 150 to 175 basis points lower than it is, Bianco said. He added that there have been many instances over the decades of “cajoling Fed chairs,” and they are “welcome to offer their opinion,” but it shouldn’t change the central bank leader’s opinion.

          Bessent repeated on Thursday that, given the context of the weaker jobs figures and not having cut rates the past couple of months, “perhaps a 50-basis-point cut in September was warranted”.

          Two Fed district bank presidents said they are not backing such a move at this point. San Francisco Fed president Mary Daly said in a Wall Street Journal interview on Wednesday, “I just don’t see that. I don’t see the need to catch up.” St Louis president Alberto Musalem said on CNBC on Thursday, that a 50-basis-point cut would be “unsupported by the current state of the economy and the outlook for the economy”.

          Source: Bloomberg

          To stay updated on all economic events of today, please check out our Economic calendar
          Risk Warnings and Disclaimers
          You understand and acknowledge that there is a high degree of risk involved in trading. Following any strategies or investment methods may lead to potential losses. The content on the site is provided by our contributors and analysts for information purposes only. You are solely responsible for determining whether any trading assets, securities, strategy, or any other product is suitable for investing based on your own investment objectives and financial situation.
          Add to Favorites
          Share

          Japan’s Q2 GDP Beats Forecasts, but Tariff Shadow Looms Over Outlook

          Gerik

          Economic

          Exports Power a Surprising Rebound in Q2 Growth

          Japan’s economy defied gloomy expectations by expanding 0.3% quarter-on-quarter in Q2 2025, exceeding forecasts for just 0.1% growth and improving from a revised 0.1% in Q1. On an annualized basis, GDP rose 1.0%, more than double the 0.4% forecast. The primary contributor was net exports, which added 0.3 percentage points to GDP, reflecting a marked turnaround from the 0.8% contraction seen in the prior quarter.
          This export-driven rebound was particularly notable given that Japan faced tariff headwinds throughout the quarter. Despite a challenging external environment, including a 25% U.S. tariff on auto exports, the country’s trade deficit narrowed between April and June, according to trade ministry data.

          Market Reaction and Policy Signals Reflect Mixed Sentiment

          Following the data release, the Nikkei 225 climbed 0.59% and the yen appreciated slightly to 147.6 per dollar, signaling cautious optimism from financial markets. The Bank of Japan responded by modestly upgrading its FY2025 growth forecast to 0.6%, up from 0.5% in April, acknowledging the short-term resilience.
          However, the central bank also warned that the external environment especially trade policies could weigh heavily on future performance. Weakening overseas demand and declining domestic corporate profits remain key downside risks.

          Tariffs Threaten Investment and Profitability Despite Wage Tailwinds

          While exports saved Q2 from stagnation, forward-looking indicators are less encouraging. Japan only finalized a new trade deal with the U.S. on July 23, which now imposes a blanket 15% tariff on all exports and a specific 25% duty on automobiles an industry that accounted for 28.3% of Japan’s total exports in 2024.
          Economists like Marcel Theliant of Capital Economics believe the current strength may fade, with a potential slowdown in investment spending and marginal export contraction ahead. Likewise, Sompo Institute Plus senior economist Masato Koike cautioned that capital investment may decline significantly if tariffs compress corporate earnings. While rising real wages could support short-term consumption, any tariff-induced pressure on bonuses and wage growth in 2026 could reverse that trend.
          Koike did not rule out a mild recession if the impact of tariffs deepens. Despite demand for labor-saving technology and digital transformation, weakening profitability could drag overall economic activity in coming quarters.Japan’s stronger-than-expected Q2 GDP print offers a temporary reprieve amid rising trade frictions. But with heavy reliance on auto exports and a fragile investment climate, the sustainability of this recovery remains uncertain. Tariff-related drag on corporate earnings and potential erosion of wage-driven consumption could tilt the economy back toward stagnation, if not contraction, later in the year. As such, Japan’s growth story may be more fragile than the headline numbers suggest.

          Source: CNBC

          To stay updated on all economic events of today, please check out our Economic calendar
          Risk Warnings and Disclaimers
          You understand and acknowledge that there is a high degree of risk involved in trading. Following any strategies or investment methods may lead to potential losses. The content on the site is provided by our contributors and analysts for information purposes only. You are solely responsible for determining whether any trading assets, securities, strategy, or any other product is suitable for investing based on your own investment objectives and financial situation.
          Add to Favorites
          Share

          IC Markets Asia Fundamental Forecast | 15 August 2025

          IC Markets

          Commodity

          Forex

          Economic

          What happened in the U.S session?

          The hot U.S. producer inflation print dominated market sentiment in the overnight (U.S.) session, sparking a risk-off move in equities and a rally in the dollar and yields. Gold and crypto held their ground on medium-term rate cut optimism, while rate- and tariff-sensitive sectors were hit hardest. U.S. PPI surged 0.9% month-over-month in July (forecast: 0.2%), and 3.3% year-over-year (forecast: 2.5%), marking the largest gain in three years. This came in significantly above expectations, fueling concerns about persistent inflationary pressures.

          What does it mean for the Asia sessions?

          Focus on China’s industrial and retail data early Friday, followed by any shifts in the U.S. rate cut narrative and associated market reactions. Currency moves, especially for JPY and CNY, and capital flows into/out of regional equities, are likely to be especially volatile. Any significant deviation in the major data releases from consensus expectations could trigger sharp moves across Asian equities, FX, and commodity markets.Sentiment is dominated by expectations for Fed interest rate cuts as early as September. The probability of a 50 basis point cut has risen following dovish remarks from Treasury Secretary Scott Bessent and softer labor market and inflation data in the U.S.

          The Dollar Index (DXY)

          The US Dollar enters Friday, August 15, 2025, in a firm position bolstered by unexpectedly strong inflation prints and front-loaded retail sales/consumer data that are set to determine whether the USD rally persists or moderates. Watch for sharp, event-driven moves around the 8:30–10:00 AM ET data releases, which are likely to set the tone for FX markets through the session. Retail sales and consumer sentiment data on August 15 are in sharp focus and expected to drive the dollar’s moves. Consensus is that a robust retail sales number would reinforce the dollar’s strength, further delaying Fed easing.Central Bank Notes:

          ● The Board of Governors of the Federal Reserve System voted unanimously to maintain the Federal Funds Rate in a target range of 4.25% to 4.50% at its meeting on July 29–30, 2025, keeping policy unchanged for the fifth consecutive meeting.
          ● The Committee reiterated its objective of achieving maximum employment and inflation at the rate of 2% over the longer run. While uncertainty around the economic outlook has diminished since earlier in the year, the Committee notes that challenges remain and continued vigilance is warranted.
          ● Policymakers remain highly attentive to risks on both sides of their dual mandate. The unemployment rate remains low, near 4.2%–4.5%, and labor market conditions are described as solid. However, inflation is still somewhat elevated, with the PCE price index at 2.6% and core inflation forecast at 3.1% for year-end 2025, up from earlier projections; tariff-related pressures are cited as a contributing factor.
          ● The Committee acknowledged that recent economic activity has expanded at a solid pace, with second-quarter annualized growth estimates near 2.4%. However, GDP growth for 2025 has been revised downward to 1.4% (from 1.7% projected in March), reflecting expectations of a slowdown in the coming quarters.
          ● In the revised Summary of Economic Projections, the unemployment rate is expected to average 4.5% in 2025, and headline PCE inflation is forecast at 3.0% for the year, with core PCE at 3.1%. Policymakers continue to anticipate that inflation will moderate gradually, with ongoing risks from tariffs and global conditions.
          ● The Committee reaffirmed its data-dependent and risk-aware approach to future policy decisions. Officials stated they are prepared to adjust the stance of monetary policy as appropriate if risks emerge that could impede progress toward the Fed’s goals.
          ● As previously outlined, the Committee continues the measured run-off of its securities holdings. The pace of balance sheet reduction, which slowed since April (monthly redemption cap on Treasury securities reduced from $25B to $5B, while holding agency MBS cap steady at $35B), was left unchanged this month to support orderly market functioning and financial conditions.
          ● The next meeting is scheduled for 16 to 17 September 2025.

          Next 24 Hours Bias

          Medium Bearish

          Gold (XAU)

          Gold today is consolidating just above key support levels, as market participants weigh strong U.S. data and currency dynamics against persistent geopolitical tensions and evolving Federal Reserve policy expectations.Gold fell about 0.7% on Thursday (August 14), settling near $3,331 per ounce as hot U.S. inflation data (strong PPI) and a drop in weekly jobless claims reinforced the dollar’s strength and trimmed hopes for a large September Federal Reserve rate cut. U.S. gold futures for December delivery dipped to $3,376.50

          Next 24 Hours Bias

          Medium Bullish

          The Australian Dollar (AUD)

          The Australian dollar’s immediate outlook is stable but cautious, supported by solid domestic jobs data and tempered inflation, but capped by global economic headwinds, dovish RBA policy, and shifting US monetary expectations. The Reserve Bank of Australia (RBA) recently reduced its cash rate from 3.85% to 3.60%, citing easing inflation and previous labor softness. Markets are now betting that the RBA will pause and reconsider the next move in November, awaiting further inflation data. The AUD/USD exchange rate has been volatile, recently trading in the 0.65–0.66 USD range, with the latest quotes showing the pair near 0.6530–0.6545Central Bank Notes:

          ● The RBA held its cash rate steady at 3.85% at the July meeting on 8 July 2025, following a 25bps reduction in May and in line with widespread market expectations after recent data showed inflation tracking within the target band.
          ● Inflation continues to ease from its peak, with higher interest rates helping to rebalance demand and supply across the Australian economy. Data for the June quarter signaled ongoing progress, though underlying pressures persist in certain sectors.
          ● Trimmed mean inflation for the June quarter likely remained near 2.9% and headline CPI around 2.4%, both within the RBA’s 2–3% target range. The Board noted further evidence of inflation convergence, but flagged that not all price categories are moving in tandem.
          ● Financial markets have shown increased volatility in the wake of global tariff and trade policy developments—especially as a result of recent U.S. and EU announcements. This has pushed asset prices higher but contributed to an uncertain outlook for domestic growth and employment.Private domestic demand showed a tentative recovery. Real household incomes improved, and signs of easing household financial stress emerged, but some business sectors continued to face subdued demand, limiting their ability to pass on cost increases.
          ● Labour market conditions remained tight overall. Employment continued to expand, with low rates of underutilization. Business surveys suggest labour availability remains a constraint, though there are signs of a gradual easing compared to earlier in 2025.
          ● Underlying wage growth softened modestly, though unit labour cost growth remains elevated due to below-trend productivity gains. The Board remains attentive to developments in wage and productivity dynamics as cost pressures continue to evolve.
          ● Uncertainties persist for both domestic activity and inflation. Consumption growth has risen, but more slowly than anticipated three months ago, with global and domestic factors both contributing to the cautious outlook.
          ● There remains a risk that household spending picks up more slowly than forecast, which could result in ongoing subdued aggregate demand and a sharper deterioration in employment conditions.
          ● Given that inflation is expected to remain around the target band, the Board judged that it was appropriate to keep policy settings unchanged in July, maintaining a position that is still mildly restrictive.
          ● The Board continues to monitor all incoming data and assesses risks carefully, with a focus on global trends, domestic demand indicators, inflation outcomes, and the labour market outlook.
          ● The RBA remains committed to its mandate of price stability and full employment and stands ready to adjust policy as needed to achieve these objectives.
          ● The next meeting is on 11 to 12 August 2025.
          Next 24 Hours Bias

          Medium Bearish

          The Kiwi Dollar (NZD)

          The NZD is expected to remain under pressure in the near term, with further weakness likely if the RBNZ delivers on expected rate cuts and unless there are positive surprises from global growth or domestic data. Some moderate recovery could occur later in the year, contingent on global sentiment and improved commodity/export prices. A rise in New Zealand’s unemployment rate (now at 5.2%) and continued weakness in consumer and export sectors have prompted expectations that the Reserve Bank of New Zealand (RBNZ) will cut its Official Cash Rate (OCR) by 25 basis points at its August 20 meeting.

          Central Bank Notes:

          ● The Monetary Policy Committee (MPC) agreed to hold the Official Cash Rate (OCR) at 3.25% on 9 July, marking the first pause following six consecutive rate cuts.
          ● The MPC cited heightened uncertainty and near-term inflation risks as reasons to wait until August for further action.
          ● Although the annual consumer price index inflation increased to 2.5% in the first quarter of 2025, it remained within the MPC’s target range of 1 to 3%, noting that the outlook for medium-term inflation pressures has evolved broadly in line with the May MPS projections.
          ● While it is expected to be near the upper end of the band in the second and third quarters of this year, easing core inflation and spare capacity in the economy should help return it toward the 2% midpoint over time.
          ● The MPC noted that, despite global factors, domestic financial conditions are evolving broadly as expected, as mortgage and deposit interest rates have continued to decline, reflecting a lower OCR, strong bank liquidity, and soft credit growth.
          ● In aggregate, GDP growth over the December and March quarters was stronger than expected, reflecting a pickup in household consumption and business investment. However, higher-frequency indicators suggest weaker-than-expected growth in April and May.
          ● Large economic policy shifts overseas and concerns about sovereign risk could result in additional financial market volatility and increased bond yields, while prolonged economic uncertainty might induce further precautionary behaviour by households and firms, slowing the domestic economic recovery.
          ● Subject to medium-term inflation pressures continuing to ease in line with the Committee’s central projections, the Committee expects to lower the OCR further, broadly consistent with the projection outlined in May.
          ● The next meeting is on 20 August 2025.

          Next 24 Hours Bias

          Weak Bearish

          The Japanese Yen (JPY)

          Into Friday, the yen’s bias is firmer on shifting BOJ rhetoric and increased Fed‑cut pricing; data and official commentary remain the swing factors for whether USD/JPY extends below 146 or recoils toward 148–149. The yen strengthened into multi‑week highs as markets bet on a more hawkish Bank of Japan, while the US Dollar softened on growing Fed‑cut expectations.USD/JPY traded in the mid‑146s to high‑147s on Thursday, marking a 3‑week high for the yen; recent 7‑day range roughly ¥146.4–148.2 per $1.A high‑profile US interview further pressured the Fed narrative and even argued the BOJ is “behind the curve,” boosting yen bids as traders priced a higher chance of BOJ tightening and lower US rates.

          Central Bank Notes:

          ● The Policy Board of the Bank of Japan decided on 31 July, by a unanimous vote, to set the following guidelines for money market operations for the inter-meeting period:
          ● The Bank will encourage the uncollateralized overnight call rate to remain at around 0.5%.
          ● The BOJ will maintain its gradual reduction of monthly outright purchases of Japanese Government Bonds (JGBs). The scheduled amount of long-term government bond purchases will, in principle, continue to decrease by about ¥400 billion each quarter from January to March 2026, and by about ¥200 billion each quarter from April to June 2026 onward, targeting a purchase level near ¥2 trillion in January to March 2027.
          ● Japan’s economy is experiencing a moderate recovery overall, though some sectors remain sluggish. Overseas economies are generally growing moderately, but recent trade policies in major economies have introduced pockets of weakness. Exports and industrial production in Japan are essentially flat, with any uptick largely driven by front-loaded demand ahead of U.S. tariff increases.
          ● On the price front, the year-on-year rate of change in consumer prices (excluding fresh food) remains in the mid-3% range. This reflects continued wage pass-through, previous import cost surges, and further increases in food prices, particularly rice. Expectations for future inflation have begun to rise moderately.
          ● The effects of the earlier import price and food cost increases are expected to fade during the outlook period. There may be a temporary stagnation in core inflation as overall growth momentum softens.
          ● Looking forward, the economy is likely to see a slower growth pace in the near term as overseas economies feel the pinch of ongoing global trade policies, putting downward pressure on Japanese corporate profits. Accommodative financial conditions are expected to buffer these headwinds somewhat. In the medium term, as global growth recovers, Japan’s growth rate is also expected to improve.
          ● With renewed economic expansion, intensifying labor shortages, and a steady rise in medium- to long-term expected inflation rates, core inflation is projected to gradually pick up. By the latter half of the BOJ’s projection period, inflation is forecast to move in line with the 2% price stability target.
          ● There are multiple risks to the outlook, with especially elevated uncertainty regarding the future path of global trade policies and overseas price trends. The BOJ will continue to closely monitor their impact on financial and foreign exchange markets, as well as on Japan’s economy and inflation.
          ● The next meeting is scheduled for 17 to 18 September 2025.

          Next 24 Hours BiasStrong Bullish

          Oil

          Oil markets are caught between geopolitical risk and oversupply concerns. The Trump-Putin summit on August 15 could be a turning point for both prices and global oil flows, with traders closely watching for outcomes that might sharply move the market in either direction. Oil prices rose about 2% on Thursday, August 14, following two days of losses, with Brent closing at $66.71/barrel and U.S. West Texas Intermediate (WTI) at $64.05/barrel.

          This upward move brought prices to a weekly high, but both benchmarks remain down over the past month and year, reflecting longer-term bearish trends. Brent and WTI are still near their lowest levels since early June, with Brent down more than 17% year-on-year.Next 24 Hours Bias

          Medium Bearish

          Source: IC Markets

          To stay updated on all economic events of today, please check out our Economic calendar
          Risk Warnings and Disclaimers
          You understand and acknowledge that there is a high degree of risk involved in trading. Following any strategies or investment methods may lead to potential losses. The content on the site is provided by our contributors and analysts for information purposes only. You are solely responsible for determining whether any trading assets, securities, strategy, or any other product is suitable for investing based on your own investment objectives and financial situation.
          Add to Favorites
          Share

          Oil Holds Ground as Geopolitical Tensions and Japanese Growth Lift Sentiment

          Gerik

          Economic

          Commodity

          Geopolitical Risk Supports Crude as Market Eyes Trump-Putin Talks

          Oil markets maintained upward momentum on Friday as investors closely watched the scheduled summit between U.S. President Donald Trump and Russian President Vladimir Putin in Alaska. With the Ukraine ceasefire topping the agenda, Trump’s warning of "consequences" if Russia obstructs peace efforts injected a fresh dose of geopolitical risk into the market. This heightened uncertainty around Russian oil exports a critical pillar of global supply helped push Brent crude up 0.2% to $67.00 per barrel and WTI up by the same margin to $64.10.
          Although Trump simultaneously expressed optimism that Russia might be ready to end the war, markets remained cautious. Any disruption or delay in resolving the conflict could further restrict Russian oil flows and extend the current tightness in global crude supply, especially as sanctions remain in place.

          Japan’s Economic Surprise Sparks Demand Optimism

          Boosting the bullish case further was stronger-than-expected GDP growth from Japan, the world’s fourth-largest oil consumer. The economy expanded by 1.0% on an annualized basis in Q2 2025, more than double the 0.4% forecast. On a quarterly basis, GDP rose 0.3%, also beating expectations.
          This robust growth hints at increased industrial activity and energy consumption, which in turn feeds into oil demand. Japan’s rebound adds to the fragile recovery narrative across Asia, providing some counterbalance to China’s recent disappointing economic data.

          Fed’s Policy Outlook Limits Further Upside

          Despite these supportive factors, oil prices did not surge beyond modest gains, as concerns about U.S. monetary policy acted as a cap. The recent release of hotter-than-expected U.S. producer price index (PPI) data coupled with a cooling labor market has sparked fears that the Federal Reserve will maintain higher interest rates for longer.
          Higher borrowing costs typically reduce business activity and consumer spending, thereby restraining fuel consumption. This macroeconomic overhang, particularly in the U.S. the world’s largest oil consumer continues to temper bullish enthusiasm in oil markets.

          Volatility Hinges on Summit Outcome and Fed Messaging

          Looking ahead, the Trump-Putin summit is likely to be a pivotal moment. A credible breakthrough in ceasefire talks could ease fears of prolonged supply disruptions from Russia, potentially softening oil prices. Conversely, renewed tensions or diplomatic stalemates may trigger another risk premium build-up.
          Simultaneously, market sentiment will remain sensitive to upcoming signals from the Federal Reserve, especially at the Jackson Hole Symposium next week. A reaffirmation of a hawkish stance could reintroduce headwinds for commodities, while any hint of a dovish pivot may reignite upward momentum for crude.
          In sum, oil remains perched between geopolitical risk and economic policy uncertainty, with volatility likely to persist in the near term.

          Source: Reuters

          To stay updated on all economic events of today, please check out our Economic calendar
          Risk Warnings and Disclaimers
          You understand and acknowledge that there is a high degree of risk involved in trading. Following any strategies or investment methods may lead to potential losses. The content on the site is provided by our contributors and analysts for information purposes only. You are solely responsible for determining whether any trading assets, securities, strategy, or any other product is suitable for investing based on your own investment objectives and financial situation.
          Add to Favorites
          Share

          China's Property Investment Declines Accelerate, Signaling Deepening Real Estate Woes

          Gerik

          Economic

          Accelerating Property Slump Points to Structural Strain

          China’s real estate sector a vital engine of its economy remains under intense pressure, as official data released Friday reveals a deepening contraction in property investment. From January to July 2025, property investment dropped 12.0% compared to the same period a year ago, worsening from an 11.2% decline in the first half of the year. This signals that not only is the downturn persistent, but momentum for recovery remains absent despite various policy support attempts.
          The sharper decline reflects multiple intertwined factors. On the demand side, confidence among homebuyers remains subdued due to falling property prices, sluggish income growth, and demographic headwinds. This is evident in the 4.0% year-on-year decline in property sales by floor area, a steeper fall compared to the 3.5% drop recorded in H1 2025.
          On the supply side, developers are reducing activity in response to both demand erosion and funding constraints. New construction starts, a forward-looking indicator of developer sentiment and investment plans, plunged 19.4% in floor area barely improved from the 20% drop seen through June. This suggests that developers are scaling back significantly rather than preparing for a near-term recovery.

          Funding Channels Dry Up Amid Market Volatility

          Compounding the issue is the 7.5% decline in funds raised by developers in the first seven months worsening from the 6.2% fall in H1. This drop underscores the tightening financial conditions developers face, as access to bank loans, trust financing, and bond markets remains limited. Investor confidence has not returned, and regulatory scrutiny remains tight, even as some easing measures have been announced to stimulate sector liquidity.
          The fall in financing suggests that stimulus or supportive measures introduced by Beijing have yet to translate into material capital flows for developers. The sector’s ongoing debt overhang, amplified by the legacy of the Evergrande crisis and similar cases, continues to suppress both appetite and capacity for fresh lending.

          Broader Economic Implications and Outlook

          This deepening real estate contraction has far-reaching implications. Given the sector's extensive upstream and downstream linkages spanning steel, cement, household appliances, and services the investment slump will weigh heavily on GDP growth, which is already facing headwinds from soft consumption and weakening exports.
          Moreover, with property once representing nearly a quarter of China’s GDP, the current trajectory reflects not just a cyclical downturn, but a structural correction as Beijing attempts to pivot away from real estate-led growth toward consumption and innovation-driven sectors.
          Policymakers now face a difficult balancing act: avoiding a disorderly collapse of the property sector while managing long-term financial risks. While additional targeted stimulus for housing and infrastructure may be introduced, the data suggest that sentiment, not just liquidity, must be restored for stabilization to take hold.
          The second half of 2025 will be critical. If the current declines persist or worsen, the government may be forced to expand fiscal support or consider more aggressive interventions, including direct purchases of unsold housing stock or deeper mortgage rate cuts to re-ignite demand. For now, the sector remains one of the biggest drag weights on China’s economic recovery.\

          Source: Reuters

          To stay updated on all economic events of today, please check out our Economic calendar
          Risk Warnings and Disclaimers
          You understand and acknowledge that there is a high degree of risk involved in trading. Following any strategies or investment methods may lead to potential losses. The content on the site is provided by our contributors and analysts for information purposes only. You are solely responsible for determining whether any trading assets, securities, strategy, or any other product is suitable for investing based on your own investment objectives and financial situation.
          Add to Favorites
          Share

          Dollar Holds Firm as Hot U.S. Producer Inflation Dampens Aggressive Fed Rate Cut Bets

          Gerik

          Economic

          Forex

          Dollar Gains Resilience Amid Producer Price Shock

          The U.S. dollar steadied in Friday’s early Asia trading session after a significant rebound triggered by unexpectedly hot producer price index (PPI) data for July. The report showed the fastest rise in wholesale inflation in three years, leading traders to reassess the probability of imminent rate cuts by the Federal Reserve.
          The dollar’s gains in the previous session came at the expense of major peers. The euro slipped 0.5% and the British pound fell 0.3% on Thursday, though both currencies stabilized slightly in early Friday trading. The Japanese yen rose modestly to 147.395 per dollar following surprisingly strong GDP growth in Q2, reflecting improved domestic performance in Japan.

          PPI Surprises Markets, Undermines Rate-Cut Euphoria

          The July PPI report revealed a broad-based surge in prices for goods and services, suggesting inflationary pressures remain more persistent than previously assumed. This came just after a relatively benign consumer price index (CPI) earlier in the week had encouraged speculation about a dovish Fed pivot.
          The CPI had briefly boosted risk appetite and opened room for markets to price in up to a 50-basis-point rate cut in September. However, the producer price data quickly erased those expectations, signaling that the Fed remains trapped between fighting inflation and supporting a weakening labor market.

          Rate Cut Odds Trimmed, Yields Rise

          According to CME’s FedWatch tool, the odds of a 25-basis-point rate cut in September declined after the PPI data, though it remains the base case. A more aggressive 50-point cut scenario, which had gained traction earlier in the week, has now been priced out.
          Short-end U.S. Treasury yields reacted accordingly. The 2-year yield climbed to 3.7262%, reflecting rising short-term rate expectations. The 10-year yield followed suit, reaching 4.2849%. These parallel moves across the yield curve suggest the bond market is repricing inflation risks more broadly, beyond near-term expectations.

          Powell Faces Crucial Test at Jackson Hole

          Joseph Carpuso of the Commonwealth Bank of Australia described the current mix of elevated inflation and a cooling job market as a "conundrum" for the Fed. This dilemma is expected to be addressed in Chair Jerome Powell’s upcoming remarks at the Kansas City Fed's Jackson Hole conference next week, where he may provide clues on how the central bank prioritizes between inflation containment and employment support.

          Beyond monetary policy, traders are monitoring two critical risk areas. First, U.S. President Donald Trump’s surprise summit with Russian President Vladimir Putin in Alaska on Friday could produce geopolitical shockwaves. Trump has floated optimism around a potential resolution to the Ukraine conflict, but hinted that peace talks may require Ukraine’s direct involvement in future negotiations.
          Second, attention is shifting toward the U.S. Treasury’s expected increase in debt issuance during September and October. How the bond market absorbs this influx will influence demand for the dollar and broader risk sentiment, particularly if inflation remains elevated.

          Market Implications and Outlook

          The U.S. dollar remains underpinned by shifting rate cut expectations and bond market dynamics. Traders are increasingly positioning for a cautious Fed, with recent inflation surprises outweighing earlier hopes of swift monetary easing.
          Meanwhile, cryptocurrencies like Bitcoin and Ether showed signs of recovery after sharp sell-offs on Thursday. Bitcoin had briefly touched a record high earlier in the week on speculation around looser U.S. monetary policy, but gains were erased once wholesale inflation re-entered the picture.
          The outlook now hinges on Powell’s tone at Jackson Hole and subsequent economic data releases. Until then, the greenback is likely to retain its strength, particularly as investors hedge against inflation persistence and fiscal uncertainty in the second half of 2025.

          Source: Reuters

          To stay updated on all economic events of today, please check out our Economic calendar
          Risk Warnings and Disclaimers
          You understand and acknowledge that there is a high degree of risk involved in trading. Following any strategies or investment methods may lead to potential losses. The content on the site is provided by our contributors and analysts for information purposes only. You are solely responsible for determining whether any trading assets, securities, strategy, or any other product is suitable for investing based on your own investment objectives and financial situation.
          Add to Favorites
          Share

          China Retail Sales Slip, Industrial Output And Jobs Data Weigh; Hang Seng Dips

          Samantha Luan

          Stocks

          Forex

          Economic

          Key Points:

          ● China’s July retail sales slowed to 3.7% YoY, missing forecasts and raising calls for further stimulus.
          ● Industrial output growth slowed to 5.7% YoY, aligning with weaker manufacturing PMI data.
          ● Unemployment rose to 5.2%, adding pressure on Beijing to address labor market weakness.

          China Economic Data Eases Economic Growth Jitters

          Fresh Chinese economic data offered mixed signals, soothing property market concerns but stoking fears of slowing consumer demand.

          Housing Prices Fall at a Slower Pace

          The housing sector continued to show tentative signs of recovery early in the third quarter. The House Price Index fell 2.8% year-on-year (YoY) in July after declining 3.2% in June. July’s data raised hopes that Beijing’s efforts to stabilize the real estate market had gained traction.

          The Hang Seng Mainland Properties Index was up 2.12% following the data release, underscoring investor relief.

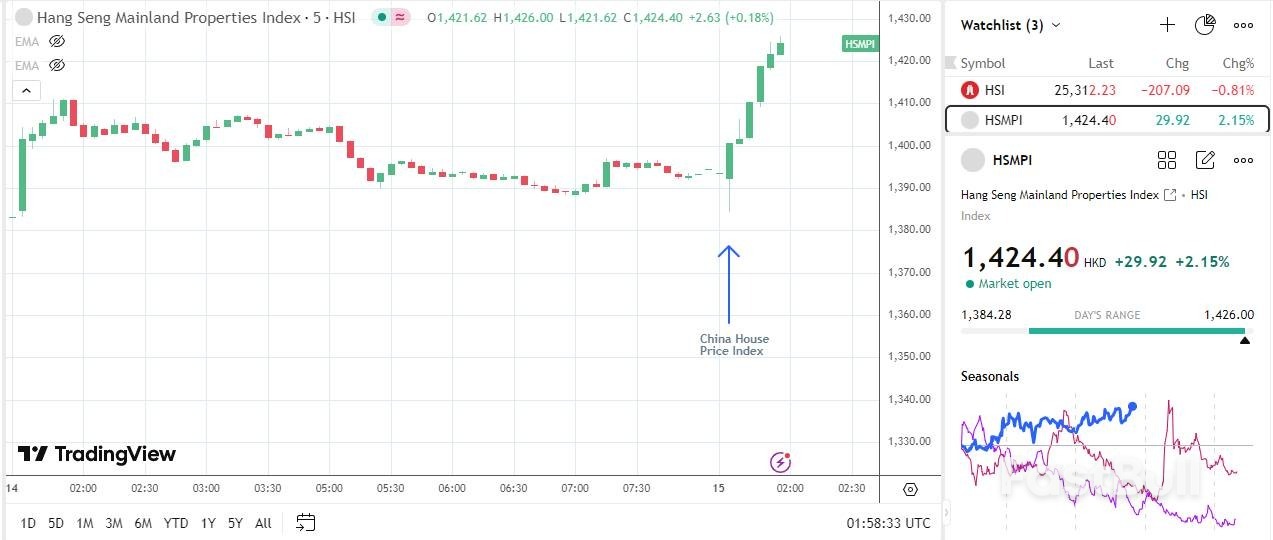
          HSMPI – 5 Minute Chart – 150825

          Consumer Weakness Overshadows Property Gains

          Crucial economic data from China highlighted the effect of US tariffs on the industrial sector, consumer sentiment, and domestic consumption.

          ● Retail Sales: +3.7 YoY in July compared with +4.8% in June. Forecast: +4.6%.
          ● Unemployment Rate: Rises from 5% in June to 5.2% in July. Forecast: 5.1%.
          ● Industrial Production: +5.7% YoY in July, down from +6.8% in June. Forecast: +5.9%.

          Slower industrial production growth aligned with the July Manufacturing PMI surveys, which revealed a further drop in external demand. After impressive GDP growth in Q2 and export surge in July, today’s data suggest US tariffs are beginning to affect China’s terms of trade.Rising unemployment also aligned with the Manufacturing PMIs. Manufacturers continued to cut staffing levels amid rising cost pressures and narrowing profit margins. Deteriorating labor market conditions weighed on domestic consumption, despite Beijing’s efforts to boost consumer spending.

          Market Reaction to China’s Economic Indicators

          The Hang Seng Index and the AUD/USD pair reacted to the mixed data as trade uncertainties lingered.On Friday, August 15, the Hang Seng Index was down 0.8% to 25,315 before the data release. However, the Index dipped to a low of 25,286 in response to the numbers. At the time of writing, the Hang Seng Index was down 0.91% to 25,289.

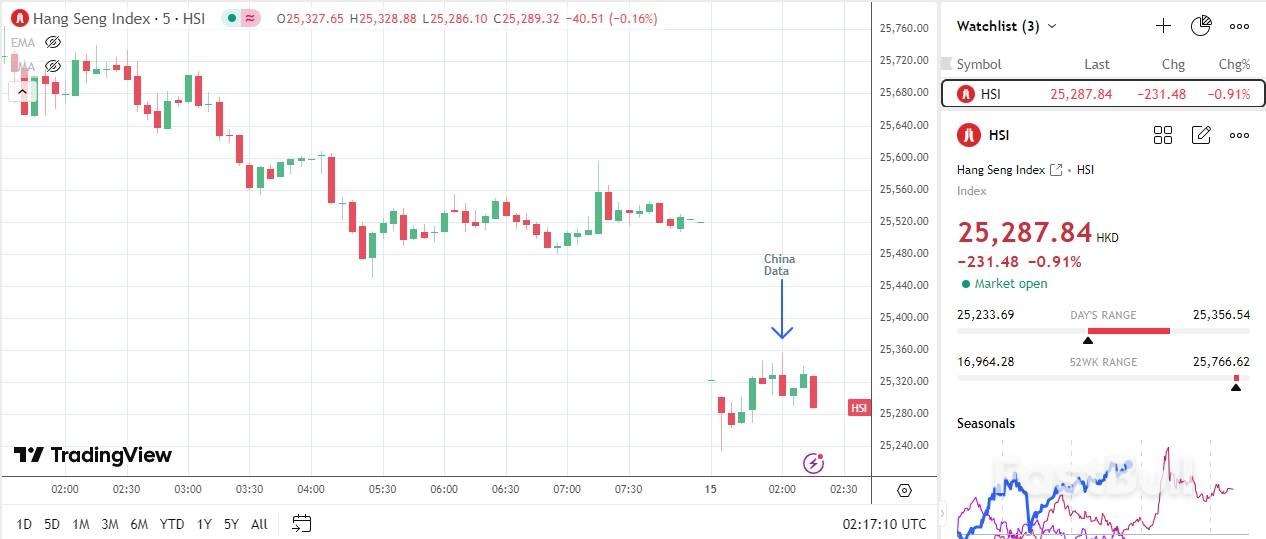
          Hang Seng Index – 5 Minute Chart – 150825

          In the forex markets, the AUD/USD pair responded to the China stats, initially rising from $0.64919 to $0.65003 upon the release of the housing sector data. However, the weaker-than-expected retail sales, unemployment, and industrial production numbers weighed on the Aussie dollar. AUD/USD slid from $0.64967 to a low of $0.64893. At the time of writing, the AUD/USD pair was down 0.05% to $0.64894.

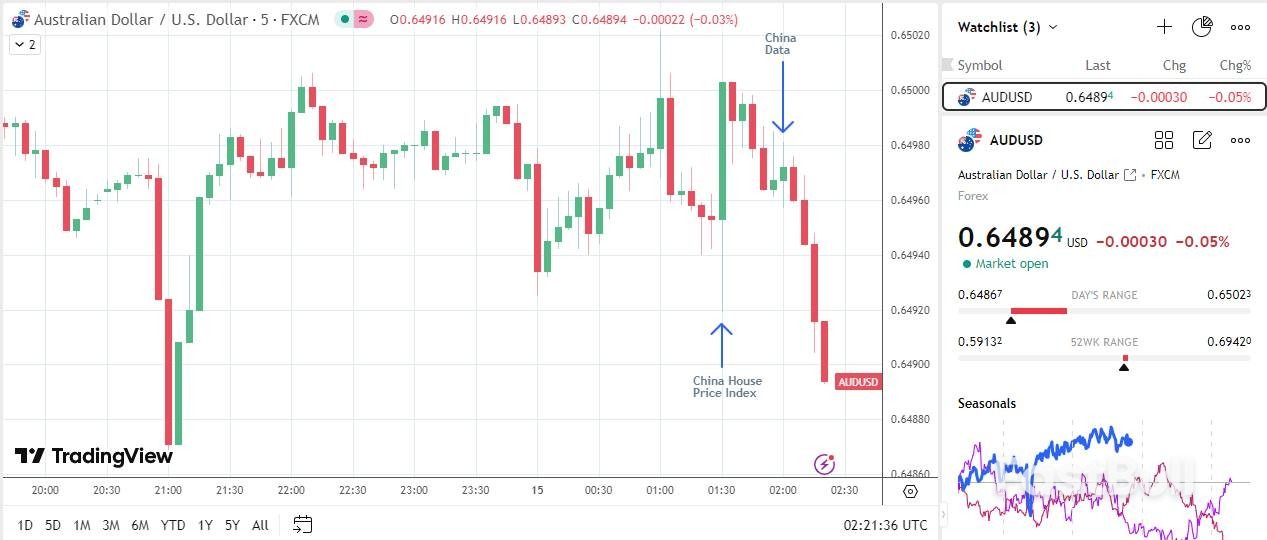
          AUDUSD – 5 Minute Chart – 150825

          Despite the mixed data, recent stimulus measures from Beijing, targeting domestic consumption, cushioned the downside. Furthermore, the latest data may raise expectations of further stimulus measures to bolster the economy.Earlier reports discussed recent stimulus measures and whether the measures would be sufficient to boost consumption despite labor market and consumer sentiment woes. Today’s data suggested more policy support would be needed.

          Looking Ahead

          Beijing’s stimulus measures remain crucial for Mainland China and Hong Kong-listed stocks. However, traders should also closely monitor trade headlines following the extension of the trade war truce. Track the latest developments and policy signals here. Given the latest data, a cautious approach is essential.

          Source: FX Empire

          To stay updated on all economic events of today, please check out our Economic calendar
          Risk Warnings and Disclaimers
          You understand and acknowledge that there is a high degree of risk involved in trading. Following any strategies or investment methods may lead to potential losses. The content on the site is provided by our contributors and analysts for information purposes only. You are solely responsible for determining whether any trading assets, securities, strategy, or any other product is suitable for investing based on your own investment objectives and financial situation.
          Add to Favorites
          Share
          FastBull
          Copyright © 2025 FastBull Ltd

          728 RM B 7/F GEE LOK IND BLDG NO 34 HUNG TO RD KWUN TONG KLN HONG KONG

          TelegramInstagramTwitterfacebooklinkedin
          App Store Google Play Google Play
          Products
          Charts

          Chats

          Q&A with Experts
          Screeners
          Economic Calendar
          Data
          Tools
          Membership
          Features
          Function
          Markets
          Copy Trading
          Latest Signals
          Contests
          News
          Analysis
          24/7
          Columns
          Education
          Company
          Careers
          About Us
          Contact Us
          Advertising
          Help Center
          Feedback
          User Agreement
          Privacy Policy
          Business

          White Label

          Data API

          Web Plug-ins

          Poster Maker

          Affiliate Program

          Risk Disclosure

          The risk of loss in trading financial instruments such as stocks, FX, commodities, futures, bonds, ETFs and crypto can be substantial. You may sustain a total loss of the funds that you deposit with your broker. Therefore, you should carefully consider whether such trading is suitable for you in light of your circumstances and financial resources.

          No decision to invest should be made without thoroughly conducting due diligence by yourself or consulting with your financial advisors. Our web content might not suit you since we don't know your financial conditions and investment needs. Our financial information might have latency or contain inaccuracy, so you should be fully responsible for any of your trading and investment decisions. The company will not be responsible for your capital loss.

          Without getting permission from the website, you are not allowed to copy the website's graphics, texts, or trademarks. Intellectual property rights in the content or data incorporated into this website belong to its providers and exchange merchants.

          Not Logged In

          Log in to access more features

          FastBull Membership

          Not yet

          Purchase

          Become a signal provider
          Help Center
          Customer Service
          Dark Mode
          Price Up/Down Colors

          Log In

          Sign Up

          Position
          Layout
          Fullscreen
          Default to Chart
          The chart page opens by default when you visit fastbull.com