• Trade
  • Markets
  • Copy
  • Contests
  • News
  • 24/7
  • Calendar
  • Q&A
  • Chats
Trending
Screeners
SYMBOL
LAST
BID
ASK
HIGH
LOW
NET CHG.
%CHG.
SPREAD
SPX
S&P 500 Index
6817.79
6817.79
6817.79
6861.30
6801.50
-9.62
-0.14%
--
DJI
Dow Jones Industrial Average
48370.19
48370.19
48370.19
48679.14
48285.67
-87.85
-0.18%
--
IXIC
NASDAQ Composite Index
23107.27
23107.27
23107.27
23345.56
23012.00
-87.89
-0.38%
--
USDX
US Dollar Index
97.950
98.030
97.950
98.070
97.740
0.000
0.00%
--
EURUSD
Euro / US Dollar
1.17459
1.17467
1.17459
1.17686
1.17262
+0.00065
+ 0.06%
--
GBPUSD
Pound Sterling / US Dollar
1.33708
1.33717
1.33708
1.34014
1.33546
+0.00001
0.00%
--
XAUUSD
Gold / US Dollar
4301.81
4302.22
4301.81
4350.16
4285.08
+2.42
+ 0.06%
--
WTI
Light Sweet Crude Oil
56.328
56.358
56.328
57.601
56.233
-0.905
-1.58%
--

Community Accounts

Signal Accounts
--
Profit Accounts
--
Loss Accounts
--
View More

Become a signal provider

Sell trading signals to earn additional income

View More

Guide to Copy Trading

Get started with ease and confidence

View More

Signal Accounts for Members

All Signal Accounts

Best Return
  • Best Return
  • Best P/L
  • Best MDD
Past 1W
  • Past 1W
  • Past 1M
  • Past 1Y

All Contests

  • All
  • Trump Updates
  • Recommend
  • Stocks
  • Cryptocurrencies
  • Central Banks
  • Featured News
Top News Only
Share

Goldman Sachs Says They Believe That The Copper Price Is Vulnerable To An Ai-Linked Price Correction

Share

Goldman Sachs Upgrades 2026 Copper Price Forecast To $11400 From $10,650

Share

Attempts By Ukrainian Troops To Advance From The South-West To Outskirts Of Kupiansk Are Being Thwarted

Share

Russian Troops Control All Of Kupiansk - IFX Cites Russian Military

Share

On Monday (December 15), The South Korean Won Ultimately Rose 0.60% Against The US Dollar, Closing At 1468.91 Won. The Won Was On An Upward Trend Throughout The Day, Rising Significantly At 17:00 Beijing Time And Reaching A Daily High Of 1463.04 Won At 17:36

Share

Health Ministry: Israeli Forces Kill Palestinian Teen In West Bank

Share

New York Federal Reserve President Williams: Over Time, The Size Of Reserves Could Grow From $2.9 Trillion

Share

New York Fed President Williams: AI Valuations Are High, But There Is A Real Driving Factor

Share

New York Federal Reserve President Williams: The Job Market Is In Very Good Shape

Share

New York Fed President Williams: 'Very Supportive' Of USA Central Bank's Decision To Cut Interest Rates Last Week

Share

New York Fed President Williams: 'Too Early To Say' What Central Bank Should Do At January Meeting

Share

New York Fed President Williams: Strong Markets Part Of Reason Why Economy Will Grow Robustly In 2026

Share

New York Fed President Williams: What Constitutes Ample Reserves Will Change Over Time

Share

New York Fed President Williams: Market Valuations 'Elevated,' But There Are Reasons For Pricing

Share

New York Fed President Williams: Ample Reserves System Working Very Well

Share

New York Fed President Williams: Some Signs That Parts Of Underlying Economy Not As Strong As GDP Data Suggests

Share

New York Fed President Williams: Expects Coming Job Data Will Show Gradual Cooling

Share

Ukraine President Zelenskiy: Monitoring Of Ceasefire Should Be Part Of Security Guarantees

Share

Ukraine President Zelenskiy: Ukraine Needs Clear Understanding On Security Guarantees Before Taking Any Decisions Regarding Frontlines

Share

U.S. Commerce Secretary Rutnick Praised Korea Zinc Co. Ltd., Stating That The United States Will Have Priority Access To The Company's Products In 2026

TIME
ACT
FCST
PREV
Japan Tankan Small Manufacturing Outlook Index (Q4)

A:--

F: --

P: --

Japan Tankan Large Non-Manufacturing Outlook Index (Q4)

A:--

F: --

P: --

Japan Tankan Large Manufacturing Outlook Index (Q4)

A:--

F: --

P: --

Japan Tankan Small Manufacturing Diffusion Index (Q4)

A:--

F: --

P: --

Japan Tankan Large-Enterprise Capital Expenditure YoY (Q4)

A:--

F: --

P: --

U.K. Rightmove House Price Index YoY (Dec)

A:--

F: --

P: --

China, Mainland Industrial Output YoY (YTD) (Nov)

A:--

F: --

P: --

China, Mainland Urban Area Unemployment Rate (Nov)

A:--

F: --

P: --

Saudi Arabia CPI YoY (Nov)

A:--

F: --

P: --

Euro Zone Industrial Output YoY (Oct)

A:--

F: --

P: --

Euro Zone Industrial Output MoM (Oct)

A:--

F: --

P: --

Canada Existing Home Sales MoM (Nov)

A:--

F: --

P: --

Canada National Economic Confidence Index

A:--

F: --

P: --

Canada New Housing Starts (Nov)

A:--

F: --

P: --
U.S. NY Fed Manufacturing Employment Index (Dec)

A:--

F: --

P: --

U.S. NY Fed Manufacturing Index (Dec)

A:--

F: --

P: --

Canada Core CPI YoY (Nov)

A:--

F: --

P: --

Canada Manufacturing Unfilled Orders MoM (Oct)

A:--

F: --

P: --

U.S. NY Fed Manufacturing Prices Received Index (Dec)

A:--

F: --

P: --

U.S. NY Fed Manufacturing New Orders Index (Dec)

A:--

F: --

P: --

Canada Manufacturing New Orders MoM (Oct)

A:--

F: --

P: --

Canada Core CPI MoM (Nov)

A:--

F: --

P: --

Canada Trimmed CPI YoY (SA) (Nov)

A:--

F: --

P: --

Canada Manufacturing Inventory MoM (Oct)

A:--

F: --

P: --

Canada CPI YoY (Nov)

A:--

F: --

P: --

Canada CPI MoM (Nov)

A:--

F: --

P: --

Canada CPI YoY (SA) (Nov)

A:--

F: --

P: --

Canada Core CPI MoM (SA) (Nov)

A:--

F: --

P: --

Canada CPI MoM (SA) (Nov)

A:--

F: --

P: --

Federal Reserve Board Governor Milan delivered a speech
U.S. NAHB Housing Market Index (Dec)

A:--

F: --

P: --

Australia Composite PMI Prelim (Dec)

--

F: --

P: --

Australia Services PMI Prelim (Dec)

--

F: --

P: --

Australia Manufacturing PMI Prelim (Dec)

--

F: --

P: --

Japan Manufacturing PMI Prelim (SA) (Dec)

--

F: --

P: --

U.K. 3-Month ILO Employment Change (Oct)

--

F: --

P: --

U.K. Unemployment Claimant Count (Nov)

--

F: --

P: --

U.K. Unemployment Rate (Nov)

--

F: --

P: --

U.K. 3-Month ILO Unemployment Rate (Oct)

--

F: --

P: --

U.K. Average Weekly Earnings (3-Month Average, Including Bonuses) YoY (Oct)

--

F: --

P: --

U.K. Average Weekly Earnings (3-Month Average, Excluding Bonuses) YoY (Oct)

--

F: --

P: --

France Services PMI Prelim (Dec)

--

F: --

P: --

France Composite PMI Prelim (SA) (Dec)

--

F: --

P: --

France Manufacturing PMI Prelim (Dec)

--

F: --

P: --

Germany Services PMI Prelim (SA) (Dec)

--

F: --

P: --

Germany Manufacturing PMI Prelim (SA) (Dec)

--

F: --

P: --

Germany Composite PMI Prelim (SA) (Dec)

--

F: --

P: --

Euro Zone Composite PMI Prelim (SA) (Dec)

--

F: --

P: --

Euro Zone Services PMI Prelim (SA) (Dec)

--

F: --

P: --

Euro Zone Manufacturing PMI Prelim (SA) (Dec)

--

F: --

P: --

U.K. Services PMI Prelim (Dec)

--

F: --

P: --

U.K. Manufacturing PMI Prelim (Dec)

--

F: --

P: --

U.K. Composite PMI Prelim (Dec)

--

F: --

P: --

Euro Zone ZEW Economic Sentiment Index (Dec)

--

F: --

P: --

Germany ZEW Current Conditions Index (Dec)

--

F: --

P: --

Germany ZEW Economic Sentiment Index (Dec)

--

F: --

P: --

Euro Zone Trade Balance (Not SA) (Oct)

--

F: --

P: --

Euro Zone ZEW Current Conditions Index (Dec)

--

F: --

P: --

Euro Zone Trade Balance (SA) (Oct)

--

F: --

P: --

Euro Zone Total Reserve Assets (Nov)

--

F: --

P: --

U.K. Inflation Rate Expectations

--

F: --

P: --

Q&A with Experts
    • All
    • Chatrooms
    • Groups
    • Friends
    Connecting
    .
    .
    .
    Type here...
    Add Symbol or Code

      No matching data

      All
      Trump Updates
      Recommend
      Stocks
      Cryptocurrencies
      Central Banks
      Featured News
      • All
      • Russia-Ukraine Conflict
      • Middle East Flashpoint
      • All
      • Russia-Ukraine Conflict
      • Middle East Flashpoint
      Search
      Products

      Charts Free Forever

      Chats Q&A with Experts
      Screeners Economic Calendar Data Tools
      Membership Features
      Data Warehouse Market Trends Institutional Data Policy Rates Macro

      Market Trends

      Market Sentiment Order Book Forex Correlations

      Top Indicators

      Charts Free Forever
      Markets

      News

      News Analysis 24/7 Columns Education
      From Institutions From Analysts
      Topics Columnists

      Latest Views

      Latest Views

      Trending Topics

      Top Columnists

      Latest Update

      Signals

      Copy Rankings Latest Signals Become a signal provider AI Rating
      Contests
      Brokers

      Overview Brokers Assessment Rankings Regulators News Claims
      Broker listing Forex Brokers Comparison Tool Live Spread Comparison Scam
      Q&A Complaint Scam Alert Videos Tips to Detect Scam
      More

      Business
      Events
      Careers About Us Advertising Help Center

      White Label

      Data API

      Web Plug-ins

      Affiliate Program

      Awards Institution Evaluation IB Seminar Salon Event Exhibition
      Vietnam Thailand Singapore Dubai
      Fans Party Investment Sharing Session
      FastBull Summit BrokersView Expo
      Recent Searches
        Top Searches
          Markets
          News
          Analysis
          User
          24/7
          Economic Calendar
          Education
          Data
          • Names
          • Latest
          • Prev

          View All

          No data

          Scan to Download

          Faster Charts, Chat Faster!

          Download App
          English
          • English
          • Español
          • العربية
          • Bahasa Indonesia
          • Bahasa Melayu
          • Tiếng Việt
          • ภาษาไทย
          • Français
          • Italiano
          • Türkçe
          • Русский язык
          • 简中
          • 繁中
          Open Account
          Search
          Products
          Charts Free Forever
          Markets
          News
          Signals

          Copy Rankings Latest Signals Become a signal provider AI Rating
          Contests
          Brokers

          Overview Brokers Assessment Rankings Regulators News Claims
          Broker listing Forex Brokers Comparison Tool Live Spread Comparison Scam
          Q&A Complaint Scam Alert Videos Tips to Detect Scam
          More

          Business
          Events
          Careers About Us Advertising Help Center

          White Label

          Data API

          Web Plug-ins

          Affiliate Program

          Awards Institution Evaluation IB Seminar Salon Event Exhibition
          Vietnam Thailand Singapore Dubai
          Fans Party Investment Sharing Session
          FastBull Summit BrokersView Expo

          August Non-Farm Payrolls Preview

          Samantha Luan

          Cryptocurrency

          Forex

          Economic

          Summary:

          The upcoming Non-Farm Payrolls (NFP) report will be released tomorrow, the same as last month’s consensus expectation of 110K.

          The upcoming Non-Farm Payrolls (NFP) report will be released tomorrow, the same as last month’s consensus expectation of 110K.As a reminder, the July NFP release shook markets with another positive surprise, coming in 37K stronger than the 110K Expected (+ 147K). Markets are now awaiting to see if the US can once again surprise with more upside on its Labor data.For those newer to trading, the NFP is one of the most market-moving data releases globally. It offers insight into the health of the US labor market for the just—concluded month, with the Unemployment Rate also published at the same time.

          Market moving flows as July concludes

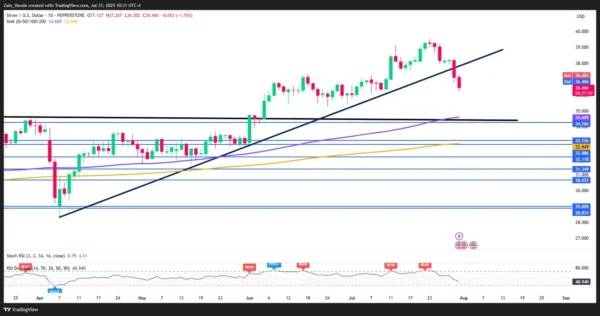
          We are concluding a strongly volatile July trading, with powerful disruptions to what was the 2025 most significant trend of US Dollar selling:After hitting 96.40 lows on its Dollar Index (DXY), the Greenback made its way back to the 100.00 level just today after Core PCE came in stronger once again (0.3% m/m vs. 0.2% estimate).The key question for the upcoming month is: Will the US keep beating expectations as they have done since 2024?The answer to this will help to assess when the first FOMC rate cut of the year will take place.All participants are getting ready for the session close which brings the usually volatile Month-End flows.

          Let’s now explore:

          ● Seasonal trends for August payrolls
          ● A small look at the Dollar Index
          ● What potential reactions traders might expect from this key report

          Seasonal trends for the August NFP release

          August NFP (where Markets learn more about the prior month’s data) averages around 160,000 since 2010, excluding 2020 and 2021 due to COVID recovery numbers significantly influencing typical trends (1.80 Million jobs created in the August 2020 NFP!).

          August Non-Farm Payrolls Preview_1

          Dollar Index 8H Chart, July 31, 2025 – Source: TradingView

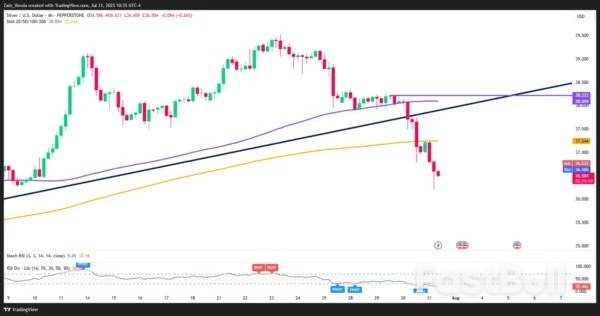
          The US Dollar is up around 2.60% since last Thursday’s lows, which is shaking up FX markets.In our previous US Dollar analysis, we mentioned a potential Break-Retest pattern from the 2025 Downtrend and after some strong data, the rally took the index from 97.15 to some 100.12 highs in the morning session.US Dollar strength will be a key to monitor upcoming flows in August – A significant break above the 100.00 to 100.50 Resistance should accelerate the rebuying of Dollar-selling positions.

          On the other hand, staying around the 100.00 should lead to some more longer-run consolidation for currencies – A stronger Dollar may also impair Equities a tid-bit, as they are still at record-highs.FYI, the Weekly RSI on the Dollar Index is back right at neutral levels, coming back from oversold which would re-allow a more balanced buying/selling scenarios – Markets are once again at a tipping point.

          What to Expect from this Upcoming Report

          This upcoming report will be even more tricky than the previous one.Seeing the major reversal in the US Dollar, participants will look to spot if this ongoing strength is poised to cancel more of the 2025 “Dollar-selling” flows, or if a weaker employment figure would provide a good point to resume the Dollar-selling trend.I cannot emphasize enough how important the 100.00 level is in the DXY. What’s priced in:US Equity markets are at all-time highs and FX Majors have all corrected significantly since their July 1st highs.Markets have reacted positively to the EU-US and Japan-US Trade Deals – More Deal announcements are expected, particularly with Mexico and China talks getting pushed back – For now, Equities are still trading in the TACO tradeWatch for potential sell-the-news on actual settlement of deals similar to what happened with the Euro.

          What to expect (subject to largely different reactions as Markets are tough to predict):

          Looking at the current state of pricing, Equities are at an extreme and Forex flows are more balanced after the strong July correction.A miss would once again prompt the largest reactions, with US Dollar selling resuming in a flash, substantially higher pricing of a September cut (more cuts throughout 2025), and Equities correcting sharply.A beat would shoot the Dollar higher yet again, with Equities following the same direction, Cuts getting priced out further towards 25 bps in 2025 and Gold would correct strongly.

          An as-expected report (~ +/- 5K from the 110K expectations) would lead to a small correction in the USD and Equities, followed by more rangebound action throughout the first part of the month in the waiting of more data (Major focus on CPI).The extent of such outcomes would depend on how large the beat/miss is.

          Source: ACTIONFOREX

          To stay updated on all economic events of today, please check out our Economic calendar
          Risk Warnings and Disclaimers
          You understand and acknowledge that there is a high degree of risk involved in trading. Following any strategies or investment methods may lead to potential losses. The content on the site is provided by our contributors and analysts for information purposes only. You are solely responsible for determining whether any trading assets, securities, strategy, or any other product is suitable for investing based on your own investment objectives and financial situation.
          Add to Favorites
          Share

          Australia Retains 10% U.S. Tariff Rate Amid Sweeping Trade Shifts

          Gerik

          Economic

          Australia Escapes Tariff Escalation, Stays at 10%
          Australia Trade Minister Don Farrell confirmed that the United States will maintain a 10% tariff rate on Australian goods under the latest executive order signed by President Donald Trump. This places Australia among a small group of U.S. trade partners that avoided steeper duties, with many other countries now subject to tariffs ranging from 15% to 41%.
          According to Farrell’s spokesperson, the White House confirmed no country has secured a tariff rate below Australia's, reinforcing the strength of bilateral ties and trade cooperation. Despite this favorable treatment, Farrell emphasized that Canberra will continue to advocate for full tariff elimination in accordance with the U.S.-Australia Free Trade Agreement (AUSFTA).

          U.S.-Australia Trade Surplus May Have Helped

          A key factor supporting Australia’s position is the U.S. trade surplus, which reached $17.9 billion in 2024, a 1.6% increase from 2023, according to data from the U.S. Trade Representative’s office. Unlike many other U.S. partners that run trade surpluses with Washington, Australia’s net import status makes it less vulnerable to tariff retaliation under Trump’s protectionist stance.
          Australia’s recent decision to ease restrictions on U.S. beef imports may also have bolstered goodwill, though Prime Minister Anthony Albanese denied any link to the current tariff outcome, asserting that the policy change had been under review independently of trade negotiations.

          New Zealand Not So Fortunate

          In contrast, New Zealand now faces a 15% U.S. tariff rate, up from the initial 10% baseline set in April. Trade Minister Todd McClay acknowledged the need for direct dialogue with U.S. officials and described prior engagements as "very good," suggesting Wellington hopes to negotiate a rollback or clarification of the new rate.
          This development introduces friction between two traditionally aligned Pacific economies and may push New Zealand to reassess its trade diversification strategy in the face of U.S. unpredictability.
          Australia’s exemption from steeper U.S. tariffs is a strategic win, providing relative certainty for exporters amid a turbulent global trade environment. However, the 10% levy still represents a trade barrier, and Australian officials remain committed to leveraging diplomatic and economic tools to restore zero-tariff access in line with the spirit of AUSFTA.

          Source: Reuters

          To stay updated on all economic events of today, please check out our Economic calendar
          Risk Warnings and Disclaimers
          You understand and acknowledge that there is a high degree of risk involved in trading. Following any strategies or investment methods may lead to potential losses. The content on the site is provided by our contributors and analysts for information purposes only. You are solely responsible for determining whether any trading assets, securities, strategy, or any other product is suitable for investing based on your own investment objectives and financial situation.
          Add to Favorites
          Share

          Dollar Surges as Tariff Shock Ripples Through FX Markets; Yen and Loonie Sink

          Gerik

          Economic

          Dollar Strengthens on Tariff Momentum and Global FX Weakness

          The U.S. dollar continued to gain across the board on Friday, closing in on its best weekly performance since 2022, buoyed by President Donald Trump’s sweeping tariff hikes on dozens of trade partners. The U.S. Dollar Index climbed above the psychologically significant 100 mark, hitting 100.10, a level not seen since late May.
          Despite Trump’s renewed criticism of Fed Chair Jerome Powell whom he called a “terrible” pick market participants shrugged off concerns over central bank independence in the short term. Instead, the dominant market theme was the tariff-induced global risk repricing, which heavily favored the greenback.

          Yen Slides as BOJ Disappoints Hawks

          The Japanese yen led losses in Asia, weakening to 150.89 per dollar, its lowest since March 28. This slide followed the Bank of Japan's decision to hold interest rates steady at 0.5%, coupled with a lack of urgency to resume monetary tightening. The move disappointed investors who had priced in a more hawkish shift due to rising inflation forecasts.
          This dovish stance, juxtaposed with rising U.S. yields and geopolitical trade concerns, renewed pressure on the yen, which remains vulnerable to carry trades and broad dollar strength.

          Loonie and Franc Tumble Under Tariff Pressure

          Canada’s dollar, or loonie, dropped to a 10-week low at C$1.3872 per USD, following the White House’s decision to impose a 35% tariff, a sharp jump from the previously threatened 25%. This unexpected escalation part of a separate executive order linked to illicit drug concerns added immediate selling pressure to the Canadian currency.
          Similarly, the Swiss franc weakened to 0.8120 per dollar, down 0.26%, as Trump slapped a 39% tariff on Swiss exports up from the 31% previously floated. The Swiss economy, known for its export strength in pharmaceuticals, machinery, and luxury goods, now faces heightened trade risk that could dampen investor appetite.

          Euro Hovering Near Two-Month Lows Amid Trade Deal Unease

          The euro traded at $1.1420, barely above its Wednesday low of $1.1401, which marked its weakest point since June 10. Analysts attributed the euro’s underperformance not only to dollar strength but also to skepticism over the EU-U.S. trade agreement, which some investors view as asymmetrical and disadvantageous to the eurozone.
          According to Mike Houlahan of Electus Financial, "the euro has been rerated downward" due to the lack of clarity and balance in the trade arrangement. Markets are awaiting further developments to gauge the euro’s medium-term trajectory, particularly as the ECB faces pressure to support growth without reigniting inflation.
          While short-term momentum favors the dollar, analysts warn that longer-term FX stability may hinge on global responses to U.S. trade policies. As major economies adjust to new tariff structures, central bank divergence and economic retaliation could reconfigure FX dynamics heading into the second half of the year.

          Source: Reuters

          To stay updated on all economic events of today, please check out our Economic calendar
          Risk Warnings and Disclaimers
          You understand and acknowledge that there is a high degree of risk involved in trading. Following any strategies or investment methods may lead to potential losses. The content on the site is provided by our contributors and analysts for information purposes only. You are solely responsible for determining whether any trading assets, securities, strategy, or any other product is suitable for investing based on your own investment objectives and financial situation.
          Add to Favorites
          Share

          China’s Manufacturing Sector Contracts Again as Export Orders Weaken

          Gerik

          Economic

          China–U.S. Trade War

          Manufacturing Contraction Deepens on Export Slowdown

          China’s manufacturing activity stumbled in July, according to the S&P Global China General Manufacturing PMI, which slipped to 49.5, down from 50.4 in June. This figure fell below the 50.4 consensus forecast and clearly signaled a re-entry into contraction territory. The disappointing reading aligns with Thursday’s official PMI and raises concerns about the sustainability of China’s earlier growth rebound.
          The key drag came from the weakening of new orders, especially exports, which contracted for the fourth consecutive month, and at a faster pace than in June. Economists had anticipated a boost in export orders due to front-loading before anticipated U.S. tariff hikes, but the benefit now appears to be fading a warning sign for China’s trade-reliant recovery.

          Firms Respond with Output Cuts and Job Losses

          After showing modest strength in June, manufacturing output fell in July, as companies scaled back production in response to declining orders. Rather than ramping up production, firms relied on existing inventories to fulfill contracts, resulting in a second straight month of declining post-production stock.
          In tandem, employment weakened, with firms cutting headcount to manage costs. The reduction was attributed not just to weaker demand but also to rising financial pressure and thin margins caused by sustained price competition.

          Price Pressures Return Amid Intense Competition

          While input costs rose for the first time in five months, primarily due to higher logistics and commodity prices, manufacturers continued to lower their selling prices to stay competitive. This persistent undercutting part of what Beijing calls the “price war” has weighed heavily on margins.
          However, export prices rose at the fastest pace in a year, indicating that global buyers are now absorbing some of the additional shipping and logistics costs. Yet this may not be sustainable if demand continues to weaken globally, particularly under the shadow of U.S. tariffs.

          Cautious Optimism Amid Calls for Policy Support

          Despite July’s deterioration in output and employment, business sentiment improved modestly, with manufacturers expecting better conditions in the months ahead driven by anticipated promotional campaigns and stimulus efforts from Beijing. However, sentiment remains below the long-term average, highlighting lingering concerns about deflation and overcapacity.
          In response, China’s top leadership signaled renewed focus on industrial policy, including the potential for a new round of factory capacity cuts to address oversupply and deflation risks. These efforts could revive pricing power but are difficult to implement without triggering job losses or production gaps, especially in politically sensitive sectors.

          Source: Bloomberg

          To stay updated on all economic events of today, please check out our Economic calendar
          Risk Warnings and Disclaimers
          You understand and acknowledge that there is a high degree of risk involved in trading. Following any strategies or investment methods may lead to potential losses. The content on the site is provided by our contributors and analysts for information purposes only. You are solely responsible for determining whether any trading assets, securities, strategy, or any other product is suitable for investing based on your own investment objectives and financial situation.
          Add to Favorites
          Share

          Tariff Turmoil Sinks Asian Stocks, Boosts Dollar Amid Uncertainty

          Gerik

          Economic

          Stocks

          Growth Fears Override Tech Optimism

          Asian stock markets extended their losses on Friday following the U.S. administration’s announcement of a wide range of new tariffs. The MSCI Asia Pacific Index fell 0.6%, led by a 3% drop in South Korea’s stock market, as Trump implemented duties ranging from 10% to 40% targeting virtually all major trading partners.
          Investors largely shrugged off solid earnings from tech giants like Microsoft, which briefly pushed past a $4 trillion valuation. AI-driven enthusiasm that had buoyed markets in recent months was no match for growing trade fears, particularly as key Asian export economies face higher duties.

          Dollar Climbs, Regional FX Weakens

          The U.S. dollar strengthened modestly, posting its first monthly gain since Trump returned to office. The Taiwan dollar fell for a seventh straight session, the longest slide since 2023, after the island was hit with a 20% U.S. tariff. The Swiss franc also edged lower after Washington levied a steep 39% tariff on Swiss goods.
          Sovereign bond markets were steady but cautious. The U.S. 10-year yield held at 4.38%, while Australia’s 10-year yield rose five basis points to 4.31%, reflecting concerns over how the region might absorb the economic hit from reduced trade flows.

          Policy Uncertainty Deepens as Investors Lose Visibility

          According to Saxo Markets’ Charu Chanana, the lack of a consistent framework behind the tariff levels and apparent arbitrariness of the rates have rattled investor confidence. Although the White House released the final figures late Thursday night, many countries including Taiwan are still in limbo about whether they can negotiate adjustments before implementation.
          Bloomberg strategist Garfield Reynolds warned that the market is entering “an era of substantial barriers to trade,” projecting global growth to decline as corporate decision-making becomes constrained by uncertainty and rising costs.

          Tariff Breakdown: Who’s Affected and How

          The new U.S. trade regime includes a 25% levy on Indian exports, 20% on Taiwan, 39% on Switzerland, and 30% on South Africa. Southeast Asian nations such as Thailand and Cambodia will face 19% tariffs, despite reports of last-minute talks. Only a handful of countries, like the U.K., escaped significant increases.
          The Taiwan government clarified that the 20% tariff is considered “temporary,” and negotiations are still ongoing. However, the delay in scheduling a formal meeting with U.S. counterparts underscores diplomatic bottlenecks complicating efforts to reach resolution.

          Broad Weakness Despite Select Bright Spots

          In equity markets, Japan’s Topix rose 0.4%, offering a rare gain amid the broader selloff. However, Australia’s S&P/ASX 200 declined 0.8%, and China’s Shanghai Composite slipped 0.1%. Futures for both S&P 500 and Euro Stoxx 50 fell 0.2%, indicating pressure could continue across time zones.
          Bitcoin dropped 1% to $115,322, while Ether lost 1.3%, reflecting risk-off sentiment spreading to digital assets. Gold dipped 0.2% to $3,282.52/oz, signaling some loss of safe-haven appeal as investors await further data.
          Crude oil prices remained stable despite tariff news, possibly buffered by offsetting geopolitical supply concerns and limited demand reaction in early trade.

          Eyes on U.S. Jobs and Inflation Data

          Markets will now turn to Friday’s U.S. jobs report for July, with forecasts pointing to a slight uptick in unemployment to 4.2% and a moderation in hiring. These figures will influence expectations on future Federal Reserve moves, especially given that core PCE inflation rose 0.3% in June, reinforcing the persistence of underlying price pressures.
          While megacap tech and AI remain fundamental to longer-term bullish narratives, rising trade frictions and volatile policymaking are creating a foggy near-term outlook.

          Source: Bloomberg

          To stay updated on all economic events of today, please check out our Economic calendar
          Risk Warnings and Disclaimers
          You understand and acknowledge that there is a high degree of risk involved in trading. Following any strategies or investment methods may lead to potential losses. The content on the site is provided by our contributors and analysts for information purposes only. You are solely responsible for determining whether any trading assets, securities, strategy, or any other product is suitable for investing based on your own investment objectives and financial situation.
          Add to Favorites
          Share

          Trump’s Sweeping Tariff Hike Triggers Trade Shockwaves: Canada Hit With 35%, Dozens More to Follow

          Gerik

          Economic

          A New Tariff Era Begins: Aggressive, Immediate, and Global

          In a dramatic escalation of trade policy, President Trump has signed an executive order imposing new tariffs on nearly every major U.S. trading partner. The centerpiece of the announcement is a 35% tariff on Canadian imports up from 25% set to take effect immediately under a separate order citing illicit drug concerns. All other increases will begin seven days after the July 31 signing, taking effect at 12:01 a.m. EDT on August 8.
          The scope of the order is extensive: 15% duties are confirmed for the EU, Japan, and South Korea; India will face 25%; Taiwan 20%; and Southeast Asian nations are generally set for 19–20%. Meanwhile, countries like Switzerland and South Africa are subject to more than 30% tariffs. The U.K. escapes with an unchanged 10% rate, while Mexico has been granted a 90-day tariff freeze following what Trump called a "very successful" phone call with President Claudia Sheinbaum.

          Trump's Trade Strategy: Economic Nationalism via Tariffs

          This order reflects Trump’s long-held belief in tariffs as both an economic weapon and a political tool. Unlike past protectionist measures aimed at specific sectors or bilateral imbalances, this round reflects a near-universal strategy to "reset" trade terms. Trump’s justification stems from the International Emergency Economic Powers Act of 1977, allowing executive action under a national emergency designation.
          The administration's rhetoric is uncompromising: Trump declared, “Tariffs are making America GREAT & RICH Again,” contrasting current actions with what he described as decades of economic weakness enabled by low duties.
          Yet these changes carry heavy economic consequences. According to the Yale Budget Lab, the effective average U.S. tariff rate has already risen to 18.4%, the highest since 1933, and is now poised to climb further as the full impact of these duties is factored in.

          Trade Disruption Incoming: Delays, Confusion, and Transshipment Risks

          Though the new tariffs will apply broadly, goods already in transit may escape the higher rates. Products shipped before August 7 and arriving before October 5 will still be subject to the previous lower tariff levels. However, Trump’s executive order includes a major caveat: a 40% surcharge on any items deemed to be “transshipped” to evade duties, without providing clear definitions raising the risk of customs disputes and delays at U.S. ports.
          Smaller U.S. importers are already bracing for impact. Legal challenges are underway, with critics questioning the president’s authority to enact sweeping duties without congressional approval. The Justice Department has sided with Trump, citing emergency economic powers, but the legality of the move could face extended court scrutiny.

          Canada and Brazil: Key Targets of Special Tariff Orders

          Canada stands out with an immediate 35% tariff, framed by the administration as a response to the cross-border drug crisis. Brazil, meanwhile, is set to face a 50% duty under a separate order that began counting down on July 30, making its implementation date earlier than the broader package. These targeted actions underscore Trump’s dual strategy: global tariff floors alongside customized surcharges for countries seen as particularly problematic.
          Global markets are already responding. Copper futures (HG=F) rose 1.46% following the announcement, likely on expectations of supply chain disruption and increased U.S. infrastructure investment to offset foreign dependencies. Analysts warn that the tariffs could stoke inflation, complicate supply chain management, and trigger retaliatory measures from affected nations.
          For now, Washington’s position is clear: Trump’s second-term trade doctrine is not about compromise but about economic self-reliance and leverage through tariffs. Whether it delivers long-term gains or sparks another trade war remains to be seen.

          Source: Yahoo Finance

          To stay updated on all economic events of today, please check out our Economic calendar
          Risk Warnings and Disclaimers
          You understand and acknowledge that there is a high degree of risk involved in trading. Following any strategies or investment methods may lead to potential losses. The content on the site is provided by our contributors and analysts for information purposes only. You are solely responsible for determining whether any trading assets, securities, strategy, or any other product is suitable for investing based on your own investment objectives and financial situation.
          Add to Favorites
          Share

          Silver (XAG/USD) Price: Down 1.5% As Trendline Break Hints At Deeper Correction

          Samantha Luan

          Economic

          Commodity

          Forex

          The US Dollar remains strong, and rising US bond yields are limiting any chance of recovery for now. The Dollar’s strength is driven by hawkish comments from Fed Chair Jerome Powell, along with strong US GDP and job data. These factors support the Federal Reserve’s cautious stance on monetary policy and reduce expectations for rate cuts in the near future.Now Silver’s extended rally this year was down to a combination of factors. Those include safe haven demand, a weak US Dollar and supply demand discrepancies.Now if haven demand remains low and the US Dollar rally continues, how deep could the pullback in silver prices be? For the record, the discrepancy between supply and demand remains in play and is highly unlikely to change anytime soon.With that in mind and only one of the three main causes of the silver rally still present, what could the potential downside for silver be?

          Technical Analysis – Silver (XAG/USD)

          From a technical standpoint, Silver has peaked at 39.52 before falling. A brief attempt at a recovery on Monday and Tuesday has faded away thanks to Fed Chair Powell’s comments yesterday.A daily candle closed yesterday below the ascending trendline with further losses today.The RSI period-14 on the daily chart has crossed below the 50 neutral level but remains some way off oversold conditions.This means that further downside toward the 100-day MA at 34.60 could materialize.

          Silver (XAG/USD) Daily Chart, July 31, 2025

          Source: TradingView.com

          Dropping down to the four-hour chart and the picture changes slightly.The period-14 RSI is deep in oversold territory with a potential short-term pullback a real possibility.Looking toward the upside, resistance is provided by the 200-day MA at 37.24 and the 100-day MA at 38.09.A four-hour candle close above the 38.22 handle would invalidate a potential bearish setup in the near-term.

          Silver (XAG/USD) Four-Hour Chart, July 31, 2025

          Source: TradingView.com

          Support

          • 36.20
          • 35.26
          • 34.60 (100-day MA)

          Resistance

          • 37.24
          • 38.09
          • 38.68

          Source: ACTIONFOREX

          To stay updated on all economic events of today, please check out our Economic calendar
          Risk Warnings and Disclaimers
          You understand and acknowledge that there is a high degree of risk involved in trading. Following any strategies or investment methods may lead to potential losses. The content on the site is provided by our contributors and analysts for information purposes only. You are solely responsible for determining whether any trading assets, securities, strategy, or any other product is suitable for investing based on your own investment objectives and financial situation.
          Add to Favorites
          Share
          FastBull
          Copyright © 2025 FastBull Ltd

          728 RM B 7/F GEE LOK IND BLDG NO 34 HUNG TO RD KWUN TONG KLN HONG KONG

          TelegramInstagramTwitterfacebooklinkedin
          App Store Google Play Google Play
          Products
          Charts

          Chats

          Q&A with Experts
          Screeners
          Economic Calendar
          Data
          Tools
          Membership
          Features
          Function
          Markets
          Copy Trading
          Latest Signals
          Contests
          News
          Analysis
          24/7
          Columns
          Education
          Company
          Careers
          About Us
          Contact Us
          Advertising
          Help Center
          Feedback
          User Agreement
          Privacy Policy
          Business

          White Label

          Data API

          Web Plug-ins

          Poster Maker

          Affiliate Program

          Risk Disclosure

          The risk of loss in trading financial instruments such as stocks, FX, commodities, futures, bonds, ETFs and crypto can be substantial. You may sustain a total loss of the funds that you deposit with your broker. Therefore, you should carefully consider whether such trading is suitable for you in light of your circumstances and financial resources.

          No decision to invest should be made without thoroughly conducting due diligence by yourself or consulting with your financial advisors. Our web content might not suit you since we don't know your financial conditions and investment needs. Our financial information might have latency or contain inaccuracy, so you should be fully responsible for any of your trading and investment decisions. The company will not be responsible for your capital loss.

          Without getting permission from the website, you are not allowed to copy the website's graphics, texts, or trademarks. Intellectual property rights in the content or data incorporated into this website belong to its providers and exchange merchants.

          Not Logged In

          Log in to access more features

          FastBull Membership

          Not yet

          Purchase

          Become a signal provider
          Help Center
          Customer Service
          Dark Mode
          Price Up/Down Colors

          Log In

          Sign Up

          Position
          Layout
          Fullscreen
          Default to Chart
          The chart page opens by default when you visit fastbull.com