


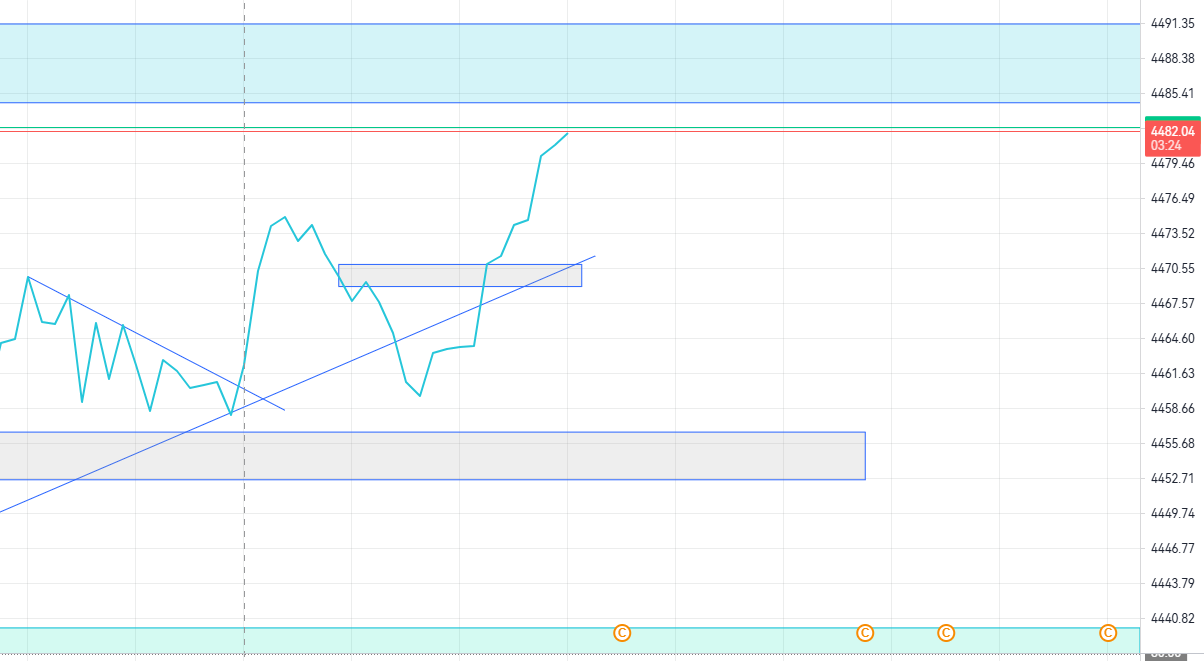
- XAUUSD
- XAGUSD
- WTI
- USDX


Markets
Analysis
User
24/7
Economic Calendar
Education
Data
- Names
- Latest
- Prev


Alternative crypto markets faced one of their sharpest downturns of the year on Friday as meme coins and NFTs collectively erased billions in value, extending a multi-week decline across the broader digital asset sector.
According to data from CoinMarketCap and CoinGecko, speculative assets have fallen to their lowest valuations of 2025, tracking heavy losses in Bitcoin, Ethereum, and other major cryptocurrencies.Meme Coin Market Crashes 66% From January Peak Amid Broad Crypto Sell-Off
The meme coin sector was among the hardest hit. Market capitalization for the category to $39.4 billion, down from $44 billion the previous day, wiping out nearly $4.6 billion in 24 hours despite a 40% increase in trading volume.Meme Coin Market Cap Source:
The sell-off deepens a drawdown that began after the sector peaked at $116.7 billion on Jan. 5. Friday’s valuation now reflects a 66.2% decline from that high.
Across major tokens, losses were widespread. Dogecoin traded at $0.1426, with hourly gains failing to offset a 4.21% daily decline and a 12.88% weekly slide. Shiba Inu followed a similar pattern at $0.000057987, down 14.04% on the week. Source:
Pepe, Bonk, and Floki all posted steeper weekly declines of more than 17%, while Dogwifhat saw one of the deepest drops, at 21.13%, over the seven-day period.
Trading activity, however, remained concentrated in the largest assets, with Dogecoin recording nearly $3.95 billion in 24-hour volume compared to the single-digit millions seen across smaller tokens.
Only a handful of assets showed pockets of resilience. The Official Trump token rose across hourly and daily timeframes but still ended the week down 13.53%, while SPX6900 remained the only major meme coin to end the week in positive territory, up 14.04% despite short-term losses.
Broader market weakness added to the pressure. The total crypto market capitalization fell to $2.99 trillion, a 2.2% drop from the prior day and down from $3.77 trillion on November 1, erasing roughly $800 billion in just three weeks.Total Crypto Market Cap Source:
Bitcoin traded at $85,023, down nearly 15% on the week but down sharply from recent highs, while Ethereum hovered around $2,785, mirroring Bitcoin’s weekly losses but reflecting the broader volatility in large-cap assets.
Solana and BNB also posted double-digit weekly losses, though neither reversed the month’s downward momentum.Global NFT Market Cap Drops 43% in a Month, Hitting $2.78B Low
The NFT market continued to slide in parallel with meme coins. CoinGecko data that the global NFT market cap dropped to $2.78 billion on Friday, a 43% decline from its $4.9 billion level 30 days earlier.Total NFT Market Cap Source:
This marks the lowest NFT market valuation since April and places digital collectibles down more than 80% from their early-2022 peak near $17 billion.
Long-term charts indicate that the NFT market is entering a prolonged correction. After surging to multi-billion-dollar heights during the 2021 boom, the sector has spent most of 2023 to 2025 in a tightening range, with intermittent rallies failing to sustain momentum.
Recent volume remains thin, with $3.99 million traded globally in 24 hours, showing reduced liquidity across chains.
Most leading collections posted deep monthly losses. Hyperliquid’s Hypurr NFTs fell 41.1% over 30 days, Moonbirds dropped 32.7%, and CryptoPunks sank 27.1%, despite remaining the highest-valued collection with a floor of 29.89 ETH.Source:
Pudgy Penguins declined 26.6%, though they retained gains over the past year. Only two collections bucked the trend: Infinex Patrons, up 11.3%, and Autoglyphs, which held nearly flat.
Chain-level activity reflected similar trends. Ethereum continued to dominate NFT trade volume, for 62.4% of the week’s $38.5 million in transactions, while HyperEVM, Base, and Solana followed at lower levels. Source:
Monthly user activity was strongest on Base, which recorded 253,000 active traders, far surpassing Ethereum and Solana.
Amid the collapse, marketplaces are adjusting. OpenSea, once the leader of the NFT boom, has rebranded into a multi-chain crypto trading aggregator after volumes across the sector dropped by more than 90% from 2021 levels.
The platform processed $1.6 billion in crypto trades and $230 million in NFT transactions in the first half of October, its strongest month in more than three years, as it expands into broader asset trading.
728 RM B 7/F GEE LOK IND BLDG NO 34 HUNG TO RD KWUN TONG KLN HONG KONG


The risk of loss in trading financial instruments such as stocks, FX, commodities, futures, bonds, ETFs and crypto can be substantial. You may sustain a total loss of the funds that you deposit with your broker. Therefore, you should carefully consider whether such trading is suitable for you in light of your circumstances and financial resources.
No decision to invest should be made without thoroughly conducting due diligence by yourself or consulting with your financial advisors. Our web content might not suit you since we don't know your financial conditions and investment needs. Our financial information might have latency or contain inaccuracy, so you should be fully responsible for any of your trading and investment decisions. The company will not be responsible for your capital loss.
Without getting permission from the website, you are not allowed to copy the website's graphics, texts, or trademarks. Intellectual property rights in the content or data incorporated into this website belong to its providers and exchange merchants.
Not Logged In
Log in to access more features


Log In
Sign Up


