• Trade
  • Markets
  • Copy
  • Contests
  • News
  • 24/7
  • Calendar
  • Q&A
  • Chats
Trending
Screeners
SYMBOL
LAST
BID
ASK
HIGH
LOW
NET CHG.
%CHG.
SPREAD
SPX
S&P 500 Index
6827.42
6827.42
6827.42
6899.86
6801.80
-73.58
-1.07%
--
DJI
Dow Jones Industrial Average
48458.04
48458.04
48458.04
48886.86
48334.10
-245.98
-0.51%
--
IXIC
NASDAQ Composite Index
23195.16
23195.16
23195.16
23554.89
23094.51
-398.69
-1.69%
--
USDX
US Dollar Index
97.950
98.030
97.950
98.500
97.950
-0.370
-0.38%
--
EURUSD
Euro / US Dollar
1.17394
1.17409
1.17394
1.17496
1.17192
+0.00011
+ 0.01%
--
GBPUSD
Pound Sterling / US Dollar
1.33707
1.33732
1.33707
1.33997
1.33419
-0.00148
-0.11%
--
XAUUSD
Gold / US Dollar
4299.39
4299.39
4299.39
4353.41
4257.10
+20.10
+ 0.47%
--
WTI
Light Sweet Crude Oil
57.233
57.485
57.233
58.011
56.969
-0.408
-0.71%
--

Community Accounts

Signal Accounts
--
Profit Accounts
--
Loss Accounts
--
View More

Become a signal provider

Sell trading signals to earn additional income

View More

Guide to Copy Trading

Get started with ease and confidence

View More

Signal Accounts for Members

All Signal Accounts

Best Return
  • Best Return
  • Best P/L
  • Best MDD
Past 1W
  • Past 1W
  • Past 1M
  • Past 1Y

All Contests

  • All
  • Trump Updates
  • Recommend
  • Stocks
  • Cryptocurrencies
  • Central Banks
  • Featured News
Top News Only
Share

Trump Isn't Certain His Economic Policies Will Translate To Midterm Wins

Share

The United States And Mexico Have Reached An Agreement On How To Resolve The Water Dispute In The Rio Grande Basin (which Borders Texas). Starting December 15, Mexico Will Supply The U.S. With An Additional 20.2 Acre-feet (a Unit Of Volume For Irrigation). The Agreement Seeks To “strengthen Water Management In The Rio Grande Basin” Within The Framework Of The 1944 Water Treaty

Share

U.S. Transportation Secretary Duffy: The Engine Of United Airlines Flight 803 That Malfunctioned Caught Fire

Share

Ukraine President Zelenskiy: He Will Meet US, European Representatives About Peace

Share

UK Prime Minister Office: Prime Minister Starmer Spoke To The President Of The European Commission Ursula Von Der Leyen This Evening - Downing Street Spokesperson

Share

Trump: We Will Retaliate Against ISIS

Share

Trump Says We Mourn The Loss Of Three Great Patriots In Syria In An Ambush

Share

Syrian Interior Ministry Spokesperson Confirms Attacker Was Member Of Security Forces With Extremist Ideology

Share

Syrian Interior Ministry Says Attacker Did Not Have Leadership Role In Security Forces, Did Not Say If He Was Junior Member

Share

Man Who Attacked Syrian, US Military Was Member Of Syrian Security Forces -Three Local Syrian Officials

Share

US Envoy Coale Says Belarus President Lukashenko Agreed To Do All He Can To Stop Weather Balloons Flying Into Lithuania

Share

Ukraine Says Russian Drone Attack Hit Civilian Turkish Vessel

Share

Islamic State Attacker In Syria Was Lone Gunman, Who Was Killed -USA Central Command

Share

US Envoy John Coale Says Around 1000 Remaining Political Prisoners In Belarus Could Be Released In Coming Months

Share

US Defense Secretary Hegseth: Attacker Was Killed By Partner Forces

Share

Pentagon Says Two USA Army Soldiers And One Civilian USA Interpreter Were Killed, And Three Were Wounded In Syria

Share

Israel Says It Kills Senior Hamas Commander Raed Saed In Gaza

Share

Ukraine's Navy Says Russian Drone Attack Hit Civilian Turkish Vessel Carrying Sunflower Oil To Egypt On Saturday

Share

Israeli Military Says It Put Planned Strike On South Lebanon Site On Hold After Lebanese Army Requested Access

Share

Norwegian Nobel Committee: Calls On The Belarusian Authorities To Release All Political Prisoners

TIME
ACT
FCST
PREV
U.K. Trade Balance (Oct)

A:--

F: --

P: --

U.K. Services Index MoM

A:--

F: --

P: --

U.K. Construction Output MoM (SA) (Oct)

A:--

F: --

P: --

U.K. Industrial Output YoY (Oct)

A:--

F: --

P: --

U.K. Trade Balance (SA) (Oct)

A:--

F: --

P: --

U.K. Trade Balance EU (SA) (Oct)

A:--

F: --

P: --

U.K. Manufacturing Output YoY (Oct)

A:--

F: --

P: --

U.K. GDP MoM (Oct)

A:--

F: --

P: --

U.K. GDP YoY (SA) (Oct)

A:--

F: --

P: --

U.K. Industrial Output MoM (Oct)

A:--

F: --

P: --

U.K. Construction Output YoY (Oct)

A:--

F: --

P: --

France HICP Final MoM (Nov)

A:--

F: --

P: --

China, Mainland Outstanding Loans Growth YoY (Nov)

A:--

F: --

P: --

China, Mainland M2 Money Supply YoY (Nov)

A:--

F: --

P: --

China, Mainland M0 Money Supply YoY (Nov)

A:--

F: --

P: --

China, Mainland M1 Money Supply YoY (Nov)

A:--

F: --

P: --

India CPI YoY (Nov)

A:--

F: --

P: --

India Deposit Gowth YoY

A:--

F: --

P: --

Brazil Services Growth YoY (Oct)

A:--

F: --

P: --

Mexico Industrial Output YoY (Oct)

A:--

F: --

P: --

Russia Trade Balance (Oct)

A:--

F: --

P: --

Philadelphia Fed President Henry Paulson delivers a speech
Canada Building Permits MoM (SA) (Oct)

A:--

F: --

P: --

Canada Wholesale Sales YoY (Oct)

A:--

F: --

P: --

Canada Wholesale Inventory MoM (Oct)

A:--

F: --

P: --

Canada Wholesale Inventory YoY (Oct)

A:--

F: --

P: --

Canada Wholesale Sales MoM (SA) (Oct)

A:--

F: --

P: --

Germany Current Account (Not SA) (Oct)

A:--

F: --

P: --

U.S. Weekly Total Rig Count

A:--

F: --

P: --

U.S. Weekly Total Oil Rig Count

A:--

F: --

P: --

Japan Tankan Large Non-Manufacturing Diffusion Index (Q4)

--

F: --

P: --

Japan Tankan Small Manufacturing Outlook Index (Q4)

--

F: --

P: --

Japan Tankan Large Non-Manufacturing Outlook Index (Q4)

--

F: --

P: --

Japan Tankan Large Manufacturing Outlook Index (Q4)

--

F: --

P: --

Japan Tankan Small Manufacturing Diffusion Index (Q4)

--

F: --

P: --

Japan Tankan Large Manufacturing Diffusion Index (Q4)

--

F: --

P: --

Japan Tankan Large-Enterprise Capital Expenditure YoY (Q4)

--

F: --

P: --

U.K. Rightmove House Price Index YoY (Dec)

--

F: --

P: --

China, Mainland Industrial Output YoY (YTD) (Nov)

--

F: --

P: --

China, Mainland Urban Area Unemployment Rate (Nov)

--

F: --

P: --

Saudi Arabia CPI YoY (Nov)

--

F: --

P: --

Euro Zone Industrial Output YoY (Oct)

--

F: --

P: --

Euro Zone Industrial Output MoM (Oct)

--

F: --

P: --

Canada Existing Home Sales MoM (Nov)

--

F: --

P: --

Euro Zone Total Reserve Assets (Nov)

--

F: --

P: --

U.K. Inflation Rate Expectations

--

F: --

P: --

Canada National Economic Confidence Index

--

F: --

P: --

Canada New Housing Starts (Nov)

--

F: --

P: --

U.S. NY Fed Manufacturing Employment Index (Dec)

--

F: --

P: --

U.S. NY Fed Manufacturing Index (Dec)

--

F: --

P: --

Canada Core CPI YoY (Nov)

--

F: --

P: --

Canada Manufacturing Unfilled Orders MoM (Oct)

--

F: --

P: --

Canada Manufacturing New Orders MoM (Oct)

--

F: --

P: --

Canada Core CPI MoM (Nov)

--

F: --

P: --

Canada Manufacturing Inventory MoM (Oct)

--

F: --

P: --

Canada CPI YoY (Nov)

--

F: --

P: --

Canada CPI MoM (Nov)

--

F: --

P: --

Canada CPI YoY (SA) (Nov)

--

F: --

P: --

Canada Core CPI MoM (SA) (Nov)

--

F: --

P: --

Canada CPI MoM (SA) (Nov)

--

F: --

P: --

Q&A with Experts
    • All
    • Chatrooms
    • Groups
    • Friends
    Connecting
    .
    .
    .
    Type here...
    Add Symbol or Code

      No matching data

      All
      Trump Updates
      Recommend
      Stocks
      Cryptocurrencies
      Central Banks
      Featured News
      • All
      • Russia-Ukraine Conflict
      • Middle East Flashpoint
      • All
      • Russia-Ukraine Conflict
      • Middle East Flashpoint
      Search
      Products

      Charts Free Forever

      Chats Q&A with Experts
      Screeners Economic Calendar Data Tools
      Membership Features
      Data Warehouse Market Trends Institutional Data Policy Rates Macro

      Market Trends

      Market Sentiment Order Book Forex Correlations

      Top Indicators

      Charts Free Forever
      Markets

      News

      News Analysis 24/7 Columns Education
      From Institutions From Analysts
      Topics Columnists

      Latest Views

      Latest Views

      Trending Topics

      Top Columnists

      Latest Update

      Signals

      Copy Rankings Latest Signals Become a signal provider AI Rating
      Contests
      Brokers

      Overview Brokers Assessment Rankings Regulators News Claims
      Broker listing Forex Brokers Comparison Tool Live Spread Comparison Scam
      Q&A Complaint Scam Alert Videos Tips to Detect Scam
      More

      Business
      Events
      Careers About Us Advertising Help Center

      White Label

      Data API

      Web Plug-ins

      Affiliate Program

      Awards Institution Evaluation IB Seminar Salon Event Exhibition
      Vietnam Thailand Singapore Dubai
      Fans Party Investment Sharing Session
      FastBull Summit BrokersView Expo
      Recent Searches
        Top Searches
          Markets
          News
          Analysis
          User
          24/7
          Economic Calendar
          Education
          Data
          • Names
          • Latest
          • Prev

          View All

          No data

          Scan to Download

          Faster Charts, Chat Faster!

          Download App
          English
          • English
          • Español
          • العربية
          • Bahasa Indonesia
          • Bahasa Melayu
          • Tiếng Việt
          • ภาษาไทย
          • Français
          • Italiano
          • Türkçe
          • Русский язык
          • 简中
          • 繁中
          Open Account
          Search
          Products
          Charts Free Forever
          Markets
          News
          Signals

          Copy Rankings Latest Signals Become a signal provider AI Rating
          Contests
          Brokers

          Overview Brokers Assessment Rankings Regulators News Claims
          Broker listing Forex Brokers Comparison Tool Live Spread Comparison Scam
          Q&A Complaint Scam Alert Videos Tips to Detect Scam
          More

          Business
          Events
          Careers About Us Advertising Help Center

          White Label

          Data API

          Web Plug-ins

          Affiliate Program

          Awards Institution Evaluation IB Seminar Salon Event Exhibition
          Vietnam Thailand Singapore Dubai
          Fans Party Investment Sharing Session
          FastBull Summit BrokersView Expo

          US Fed Looks Set To Resume Rate Cuts Just As Its Peers Are Nearly Done

          Damon

          Central Bank

          Summary:

          The U.S. Federal Reserve is an outlier among central banks in developed markets, as it looks set to resume rate cuts just as many of its peers are reaching the end of their easing cycles.

          The U.S. Federal Reserve is an outlier among central banks in developed markets, as it looks set to resume rate cuts just as many of its peers are reaching the end of their easing cycles.

          The European Central Bank (ECB) left rates unchanged on Thursday, while Japan is expected to hike rates before the year is out.

          Here's where 10 major central banks stand

          1/ SWITZERLAND

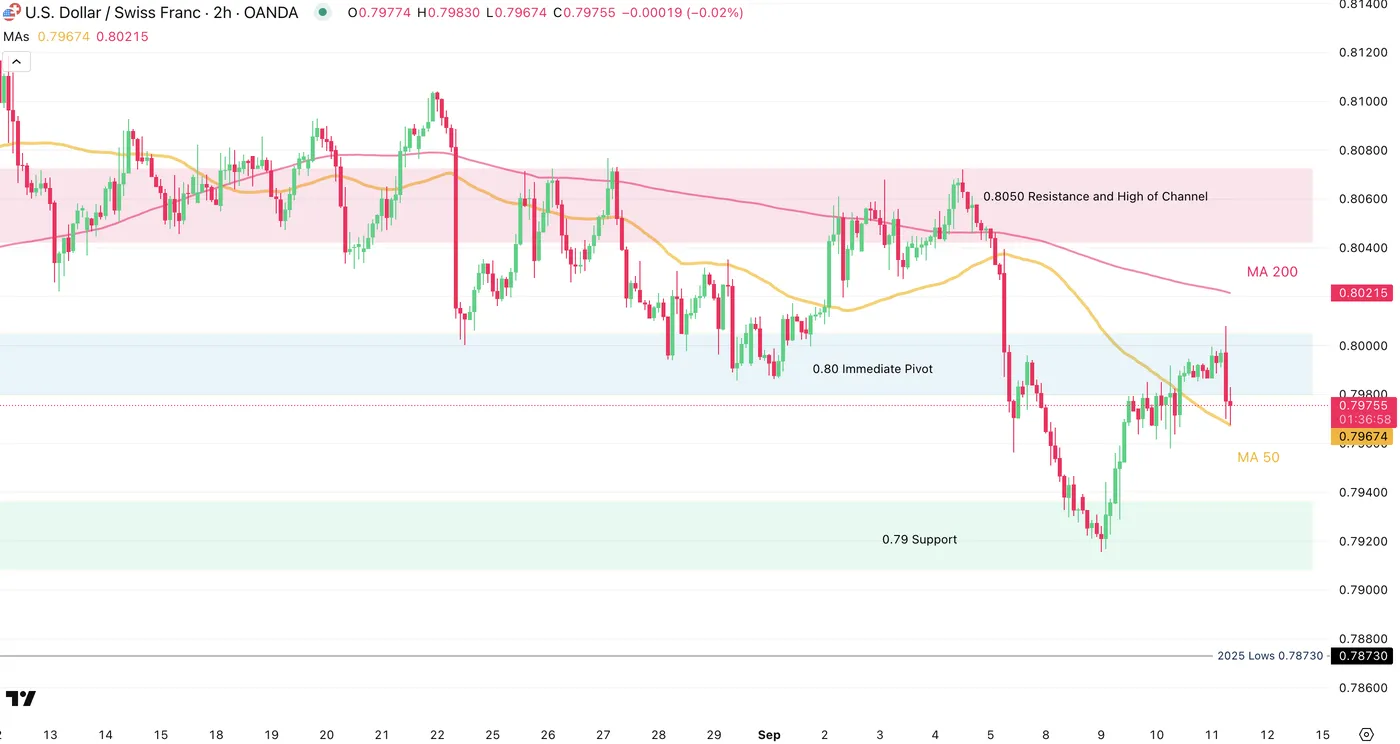
          The Swiss National Bank meets on September 25. After it cut its key rate to 0% in June, investors have pondered whether a return to negative territory is likely.

          Chairman Martin Schlegel said this week that the bar is high but he does rule out such a move. Inflation holding above the bottom of the SNB's 0-2% target band in August means traders do not anticipate negative rates at the current time.

          2/ CANADA

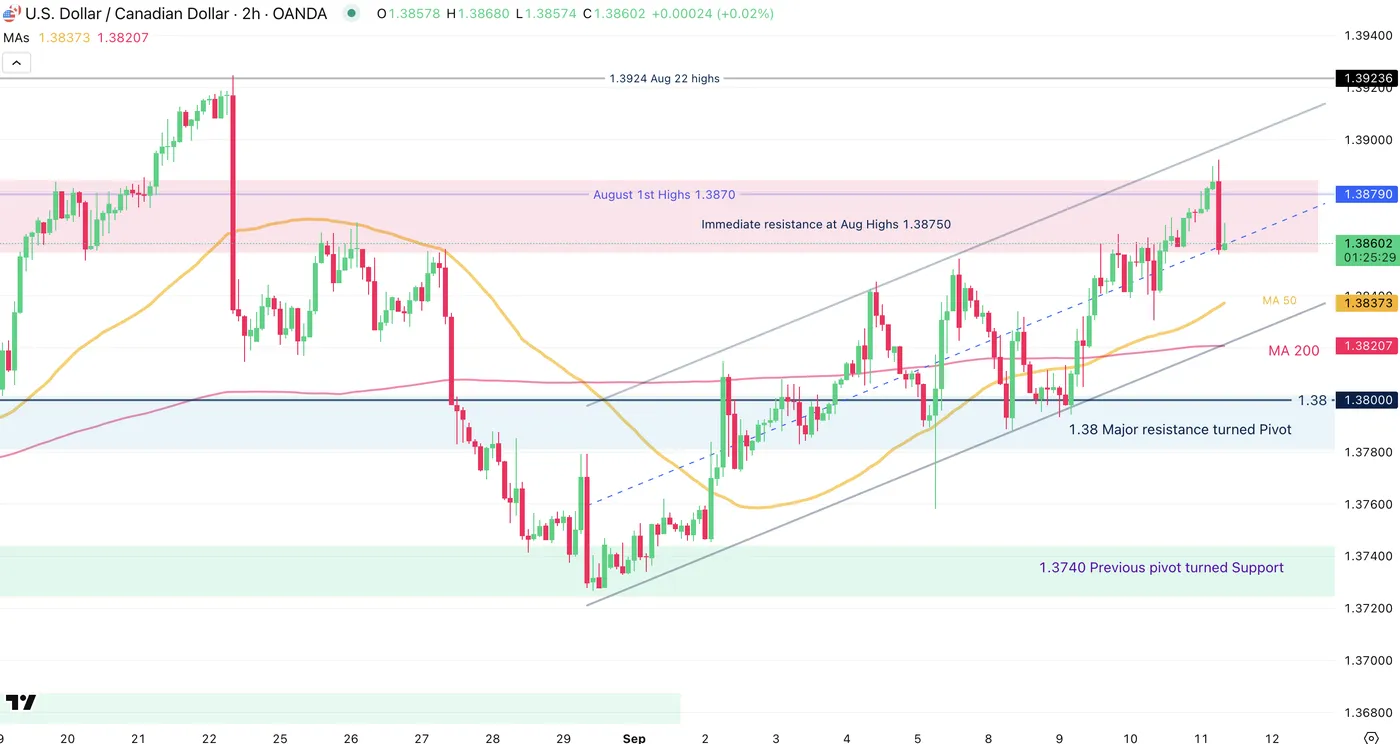
          A weak economy due to U.S. tariffs, unemployment at a four-year high and lower inflation put pressure on the Bank of Canada to resume rate cuts next Wednesday.

          The BoC has cut rates by 225 basis points (bps) since June 2024 but held steady since March. Markets price in roughly two more 25 bp rate cuts by January.

          3/ SWEDEN

          Sweden's Riksbank has also cut rates substantially, despite sticky core inflation, but looks set to remain on hold on September 23.

          Its deputy governor says that latest figures show growth and inflation moving in the right direction.

          4/ NEW ZEALAND

          Domestic and global growth headwinds could pave the way for the Reserve Bank of New Zealand to cut rates in October and probably once more by year-end, a Reuters poll of economists shows.

          The RBNZ cut its policy rate by 25 bps to a three-year low of 3% last month.

          5/ EURO ZONE

          The ECB held its key rate at 2% on Thursday and said that it now sees inflation at 1.9% in 2027, below the 2% target.

          Markets think it is possible the ECB could cut rates again, putting the chances of that happening by mid-2026 at around 50%.

          The ECB halved its the rate to 2% in the year to June but has been on hold ever since, saying the euro zone economy is in a "good place".

          6/ UNITED STATES

          The Fed looks set to cut rates by 25 bps next week, having been on hold all year on concerns about the inflationary impact of tariffs.

          Weakening jobs data means a rate cut is now fully baked in and some banks do not rule out a bigger 50 bp cut. In total, nearly 70 bps of cuts are priced in by year-end.

          President Donald Trump has repeatedly urged the Fed to cut rates more. Investors are also watching the fate of Fed governor Lisa Cook whom Trump has moved to fire. A federal judge on Tuesday temporarily blocked this.

          Source: Yahoo Finance

          Risk Warnings and Disclaimers
          You understand and acknowledge that there is a high degree of risk involved in trading. Following any strategies or investment methods may lead to potential losses. The content on the site is provided by our contributors and analysts for information purposes only. You are solely responsible for determining whether any trading assets, securities, strategy, or any other product is suitable for investing based on your own investment objectives and financial situation.
          Add to Favorites
          Share

          Stock benchmarks are scaling record highs: ‘Animal spirits are soaring’

          Adam

          Stocks

          Equities in several parts of the world have been rallying as easing inflation pressures, resilient corporate earnings and expectations for U.S. rate cuts boost investor sentiment.
          The MSCI All Country World Index, which tracks the performance of over 2,500 stocks from both developed and emerging markets, has hit fresh record highs for four straight sessions, data from LSEG showed.
          The S&P 500 closed at a record for a second day on Wednesday, while Japan’s Nikkei 225, South Korea’s Kospi and Singapore’s Straits Times Index have hit all-time highs this week.
          The rally underscores how sentiment has flipped from earlier this year when fears of sticky inflation, geopolitical risks and U.S. tariffs threatened to derail growth, experts said.
          “Markets have been a bit more resilient than what we’ve been expecting,” said Eddy Loh, Maybank’s head of investment strategy.
          “Year-to-date performance has really been premised on still very robust economic growth, and, more importantly, corporate earnings. That is supporting equity market returns across the globe — not just in the U.S., but also Europe, Japan, and key markets in Asia ex-Japan,” said Loh.
          A slew of recent U.S. data has indicated labor market weakness, with a surprisingly soft U.S. producer price index reading on Wednesday further lifting sentiment, as investors bet the Federal Reserve now has more room to ease policy.
          U.S. wholesale prices unexpectedly slid 0.1% in August from the prior month, well off the Dow Jones estimate for a 0.3% rise.
          “Stocks have hit fresh records as a much weaker-than-anticipated PPI depicted deflation rather than expected inflation,” said José Torres, senior economist at Interactive Brokers. “Animal spirits are soaring because the well-received print is bolstering probabilities that the Fed will deliver cuts during each of its last three meetings of 2025.”
          Markets have priced in a quarter-point reduction at the Sept. 17 meeting, with CME Group’s FedWatch tool showing about a 92% chance of a 25-basis-point reduction.
          Maybank’s Loh added that he is pricing in two rate cuts this year with September’s “pretty much” on the table.
          “Given that we are building a stronger case for the Fed to restart its cutting cycle while the economy remains on fairly solid footing, this environment serves as a tonic for risk investors,” said Marvin Loh, senior global macro strategist at State Street.
          Factoring in continued concerns about where long-term interest rates will settle, investors have been allocating capital to other asset classes such as equities, he said.
          Oracle’s blockbuster outlook for AI-related revenue has amplified confidence that the tech-led rally has legs, said Torres. The cloud giant on Wednesday soared to an all-time high and had its best day since 1992, gaining $244 billion in market cap and is now at $922 billion.
          Torres added that investors are now eyeing the upcoming U.S. consumer price index even more closely. “A downside shocker would create a trio of developments — payroll benchmark revisions, softer-than-projected PPI, and subdued CPI — which would justify a larger reduction by the Fed. That would drive stocks to another new record,” he said.
          Maybank’s Loh, however, struck a cautionary note, saying that the markets will see a “more visible” impact of U.S. tariffs in the coming months as they only came into effect in August and could lead to some tempering of sentiment.

          Source: cnbc

          Risk Warnings and Disclaimers
          You understand and acknowledge that there is a high degree of risk involved in trading. Following any strategies or investment methods may lead to potential losses. The content on the site is provided by our contributors and analysts for information purposes only. You are solely responsible for determining whether any trading assets, securities, strategy, or any other product is suitable for investing based on your own investment objectives and financial situation.
          Add to Favorites
          Share

          A Hesistant FX Market After As-Expected September CPI Release

          Blue River

          Technical Analysis

          Forex currencies have been dormant since the beginning of August as Markets haven’t found what they want in the latest key data reports.

          As previously thought, the latest NFP, PPI, and CPI combo reports would have expected to relieve volatility in FX. But volatility there wasn’t.

          After receiving all the most influential market data, the next step will be next Wednesday’s FOMC rate decision (September 17).

          Prior to the CPI release, expectations for a 50 bps cut were priced at 10% and are now closer to 5%. The 25 bps cut, however, is still priced to be a sure thing.

          Indeed, when looking at Market reactions in other assets, it seems that the theme that is developing is one of a less prolonged impact of tariffs.

          Despite an as expected 0.3% report, participants bidding on Bonds and Gold point toward a repricing of lower long-run inflationary impact of tariffs (while they are just starting to bite now), which is flattening the US Yield curve.

          Until now, pricing has been one of lower short-term inflation expectations versus higher ones in the long run.

          Despite the immediate US Dollar selloff, FX currencies are hesitant and hang close to unchanged on the session.

          Discover major currency pairs charts and levels, after first peaking at reactions to other asset classes.

          An overlook at cross-assets market reactions: Bonds and Gold are loving it, USD corrects.

          Cross-Asset charts post-CPI – September 11, 2025 – Source: TradingView

          Yen likes the report but still needs more – USDJPY

          USDJPY 1H Chart, September 11, 2025, Source: TradingView

          The most volatile FX pair is enjoying the ongoing selloff in the US Dollar but has yet to break out of its mid-range pivot zone.

          Some ongoing selling might be pushing prices out of this region however this move still has to develop.

          Wicky action at the extremes prove that participants are still hesitant on the upcoming direction for currencies.

          A 25 bps confirming could still provide some strength to the USD which helps to explain why participants are still looking at each other to see who moves first

          Levels to watch for USDJPY:

          • Mid-range pivot 147.50 to 148.00 (currently trading – Look for breakouts of this zone)
          • May Range Extremes 148.70 to 149.50 (Daily MA 200)
          • 146.50 Main range Support

          AUDUSD – pushing to retest yearly highs

          AUDUSD 1H Chart, September 11, 2025, Source: TradingView

          AUDUSD has rebounded significantly since its August 1st lows and by evolving in an intermediate upward channel, heads to retest its yesterday and 2025 highs (0.6535).

          Some hesitation at the current levels is forming and will be essential to monitor.

          Levels to watch for AUDUSD:

          • 2025 Highs Resistance 0.6620 to 0.6650
          • 0.6580 to 0.66 Pivot acting as mid-term support
          • 0.6550 Pivot turned support and low of intermediate channel.

          EURUSD – a wicky retest of its range resistance

          EURUSD 2H Chart, September 11, 2025, Source: TradingView

          EURUSD still evolves within its August range after a failed upside breakout in yesterday’s session.

          Buyers have pushed towards a retest of the resistance but seem to be running out of steam.

          Levels to watch for EURUSD:

          • PPI highs 1.17801
          • 1.1750 Immediate Resistance
          • Session lows and key range pivot 1.1660
          • 1.16 Current main Support

          USDCHF – Downfall stalling

          USDCHF 2H Chart, September 11, 2025, Source: TradingView

          The Swiss franc had strengthened immensely in the beginning of the month which pushed USDCHF towards a retest of its 2025 Main support (0.7916 week lows).

          However, despite a selling candle from the data, hesitation comes at the 50-period MA which will also be key to upcoming action: A rejection of the MA could provide a boost to the pair, while a breakdown could also lead to further downside.

          Levels to watch for USDCHF:

          • 0.8050 Resistance
          • 0.80 Immediate Pivot and 50-period MA (action stalling here)
          • 0.79 Main Support (latest rebound)
          • 2025 Lows 0.78730

          GBPUSD – Liked the report, but hesitant at the highs

          GBPUSD 2H Chart, September 11, 2025, Source: TradingView

          GBPUSD has, like its European neighbor, been stuck in a 2,000 pip range since the middle of August (1.34 to 1.36).

          The buying reaction to the CPI report is once again met with some hesitation as prices are meeting the range resistance.

          Watch the immediate low-slope downward channel that may shape today’s price action.

          Levels to watch for GBPUSD:

          • 1.36 Main channel Resistance
          • Key 1.35 Pivot (daily lows, key for buy/sell momentum)
          • 1.34 current Daily pivot (acted as Support)

          USDCAD reject its mid-term upward channel

          USDCAD 2H Chart, September 11, 2025, Source: TradingView

          USDCAD is virtually unchanged after the report – By attaining the upper bound of its upward channel, mean-reversion selling seems to occur but real momentum has yet to materialize.

          Levels to watch for USDCAD:

          • Immediate resistance at Aug Highs 1.38750
          • 1.38 Major resistance turned Pivot
          • 1.3740 Support

          Source: ACTIONFOREX

          Risk Warnings and Disclaimers
          You understand and acknowledge that there is a high degree of risk involved in trading. Following any strategies or investment methods may lead to potential losses. The content on the site is provided by our contributors and analysts for information purposes only. You are solely responsible for determining whether any trading assets, securities, strategy, or any other product is suitable for investing based on your own investment objectives and financial situation.
          Add to Favorites
          Share

          Tech Stocks Are Doing So Well Investors Are Starting to Worry

          Adam

          Stocks

          Technology stocks are rising so far, so fast that some investors are starting to position for the move to lose momentum.
          After advancing for five consecutive months, the Nasdaq 100 (^NDX) Index has risen each day but one in September as investors bet on optimism around artificial intelligence and Federal Reserve interest-rate cuts to keep technology stocks moving higher. A gauge of expected volatility in the index hasn’t budged in months. And on Wednesday, infrastructure software giant Oracle Inc. (ORCL) made history with a 36% pop, its biggest gain since 1992.
          That’s pushed some investors to bid up put options to protect this year’s gains. The price of hedging against a 10% drop in the Invesco QQQ Trust ETF, the largest exchange-traded fund tracking the Nasdaq 100, over the next month is at the highest since 2022 relative to the cost of protection against a similar rally.
          “The market is at highs, volatility is at lows, I think there are a lot of easy arguments to make as to why you should hedge,” said Greg Boutle, head of US equity and derivative strategy at BNP Paribas SA. “September does tend to be a bit seasonally weaker” as well, he added.
          Tech Stocks Are Doing So Well Investors Are Starting to Worry_1
          It’s sign of growing unease ahead of a string of market-moving events in the next month that include the Fed’s interest rate decision on Sept. 17 and the consumer price index report later on Thursday. The put-to-call skew on QQQ was higher just 8% of the time in recent data, according to Nomura Holdings Inc.

          Rising Uncertainty

          With exposure to tech high-flyers looking rich by any measure, the more the group goes up, the more investors are forced to hedge against a “tail event” — a potential crash in the market, according to Charlie McElligott, Nomura’s cross-asset strategist. That’s pushing the put-to-call skew even higher at a time when demand for call options remains relatively subdued.
          The hedges were likely added to protect long equity portfolios from a potential market decline, says Christopher Jacobson, co-head of derivatives strategy at Susquehanna International Group. To be sure, the put-to-call skew measures a relative cost of put options to calls and not the actual price investors pay for downside protection, which is lower than it was at the peak of trade-war uncertainty in April.
          While big volatility gauges aren’t sounding alarms — the VIX Index is hovering below 16 — there is a sense of nervousness that’s evident beyond big tech stocks. On Tuesday, a trader paid around $9.3 million for bearish options on the SPDR S&P 500 ETF Trust, a position that pays out if the S&P falls 3.6% by Sept. 19. And on Monday, an investor bought a long-term hedge against a 58% collapse in the S&P 500 by December 2026 for $13.4 million.
          The moves make sense considering stocks often underperform in September, with the market dropping 56% of the time, the most of any month going back to 1927, according to data from Bank of America Corp. (BAC).
          For Boutle, the current state of equity markets is similar to 2019, when a strong run in the first six months of the year gave way to pockets of weakness in the second half just after the Fed reduced rates.
          He recommends clients buy protection against a 5% drop in the S&P 500 (^GSPC), while selling insurance against a deeper drop he says is unlikely to materialize.
          “We’re really focused on shallow hedges rather than the ‘wingier’ ones,” Boutle said.

          Source: Bloomberg

          Risk Warnings and Disclaimers
          You understand and acknowledge that there is a high degree of risk involved in trading. Following any strategies or investment methods may lead to potential losses. The content on the site is provided by our contributors and analysts for information purposes only. You are solely responsible for determining whether any trading assets, securities, strategy, or any other product is suitable for investing based on your own investment objectives and financial situation.
          Add to Favorites
          Share

          Investors are chasing bond yields ahead of the Fed's rate decision. Here's the opportunity.

          Adam

          Bond

          Yields are still attractive in the roughly $60 trillion U.S. bond market, but that may change if the Fed resumes rate cuts next week
          Investors are chasing yield ahead of the Federal Reserve's rate decision
          Investors this month have been rushing to lock in higher yields in the roughly $60 trillion U.S. bond market ahead of next week's Federal Reserve rate decision.
          The action has been driven by robust appetite from investors in newly issued corporate bonds in September, but also for yield in other sectors, including previously unloved longer-duration assets.
          "Yields are pretty decent right now, but they are going away," said Bryce Doty, a senior portfolio manager at Sit Investment Associates. That belief has been stoking a "fear of missing out," he said, adding that investors also "like the economic porridge," which is "not too hot, not too cold."
          "It's just right to get the Fed to cut," Doty said. The labor market may be weakened and consumer delinquencies rising, but he still sees the liquidity spigot from capital markets and expected deregulation in the banking sector keeping a lid on recession fears and any "bloodbath of defaults."
          Wednesday's easing wholesale inflation data for August and Friday's weak jobs report were bolstering the case for the Fed to resume its rate-cutting cycle on Sept. 17.
          See: Fed is almost certain to cut rates by 25 basis points after months of debate. Why are so many people so unhappy about it?
          Yet a "Goldilocks" scenario for the economy remains predicated on inflation having been beaten, said Brij Khurana, a fixed-income portfolio manager at Wellington Management.
          That makes Thursday's consumer-price index report for August particularly important. "What upsets that narrative is if inflation starts picking up again," Khurana said.
          The odds on Wednesday favored the Fed cutting rates by 25 basis points next week. Yet perhaps more important, traders see the central bank's current policy rate being cut by 150 basis points over the next year - resulting in a range of 2.75%-3% as the most likely outcome, according to the CME FedWatch Tool.
          "I do think everyone is focused on generating income," said Khurana, pointing to investor demand that has caused bond spreads to compress, especially in short and intermediate-duration assets, which means investors get paid less to take on credit risks.
          In that backdrop, Khurana said it's worthwhile to extend duration in U.S. fixed income and to consider inflation-protected securities. "I don't see a lot of value in U.S. fixed income under seven years of duration," he said.
          The trend can be seen elsewhere, with demand growing for highly rated U.S. corporate bonds in the 10- to 15-year maturity bucket, as shown with the yellow line below, according to BondCliQ data. Customers, however, have been selling shorter-duration, three- to five-year assets (red line) in the past 10 trading days.
          Investors are snapping up longer-duration 10-15-year corporate bonds.
          Mortgage bonds, gold
          In addition to demand for longer-duration corporate bonds, spreads in agency mortgage-backed securities also have compressed by about 40-50 basis points over the past few weeks, Khurana said. Along with falling Treasury yields, that's been helping pave the way for an easing of financing conditions in the stalled U.S. housing market.
          Read: Mortgage rates dive on reports of worsening U.S. economy: 'We are seeing a lot of interest in refinances'
          In addition to the rally in housing debt, BofA Global strategists last week said they were "warming up to the idea" that the Fed could restart buying agency mortgage-backed securities next year. That's a topic MarketWatch explored recently.
          See: Here's one way the Fed could lower mortgage rates almost overnight - and it's not the rate cut Trump wants
          Meanwhile, concerns about the labor market have sent Treasury yields lower for the policy-sensitive 2-year yield BX:TMUBMUSD02Y, while the benchmark 10-year Treasury rate BX:TMUBMUSD10Y was last pegged at 4.031%, according to Dow Jones Market Data.
          Still, with President Donald Trump's tariffs clearly generating revenue this year - meaning that someone must be paying them - it's difficult to gauge where inflation goes from here.
          "Over the next six-to-nine months, we are thinking inflation continues to trend higher than what's in current expectations," said Eric Gerster, chief investment officer at AlphaCore Wealth Advisory.
          "I think the Fed is in a very difficult spot," Gerster said, adding that with stocks SPX DJIA COMP near all-time highs, a pullback in the near-term wouldn't be terribly surprising, particularly if inflation remains a concern.
          That also means investors should think beyond the traditional 60/40 portfolio of stocks and bonds, and include a third, diversifying bucket of investments, according to Gerster. That might include gold, (GC00) GLD - up almost 40% this year - infrastructure or real-estate assets that can help offset inflation risks.
          "Over the next five-plus years, gold will continue to be a diversifier," Gerster said, pointing to buying from global central banks in recent years, as well as deficits in the U.S. and beyond, that could potentially place a lot of pressure on rates.
          "You need that extra leg," he said. "You can't just rely on 60/40."
          Check out: What many investors are looking for in the August CPI data coming out tomorrow

          Source: morningstar

          Risk Warnings and Disclaimers
          You understand and acknowledge that there is a high degree of risk involved in trading. Following any strategies or investment methods may lead to potential losses. The content on the site is provided by our contributors and analysts for information purposes only. You are solely responsible for determining whether any trading assets, securities, strategy, or any other product is suitable for investing based on your own investment objectives and financial situation.
          Add to Favorites
          Share

          US: Inflationary Pressures Show Further Signs of Heating Up in August

          Glendon

          Economic

          Forex

          The Consumer Price Index (CPI) rose 0.4% month-on-month (m/m) in August, a tick ahead of the consensus forecast in Bloomberg and up from the 0.2% m/m gain in July. On a twelve-month basis, CPI was up 2.9% (from 2.7% the month prior).

          • Energy costs (+0.7% m/m) turned higher last month, while food prices (+0.5% m/m) also firmed due to higher grocery costs (+0.6% m/m). Price growth for ‘food away from home’ was up 0.3%m/m – unchanged from July.

          Excluding food and energy, core inflation rose 0.3% m/m (0.35% m/m unrounded), largely matching last month’s gain and meeting the consensus forecast. The twelve-month change held steady at 3.1%.

          Price growth of services continued to come in on the hotter side, rising 0.35% m/m, following a similar gain of 0.36% m/m in July. Primary shelter costs rose at its fastest monthly clip in several months, while price growth of non-housing services (+0.4% m/m) remained firm for a second consecutive month.

          • Higher travel costs (+3.0% m/m) were a big driver of price growth in non-housing services, thanks to a sharp uptick in airfares (+5.9% m/m) and hotels (+2.3% m/m).

          Tariff passthrough continued to materialize in core goods prices, which were up 0.3% m/m or its fastest monthly gain since January. Price gains were most notable in apparel (+0.5% m/m), appliances (+0.5% m/m), household furniture and bedding (+0.4% m/m) and new vehicle prices (+0.3% m/m). Used vehicle prices also rose 1.0% m/m, which could in part be driven by consumer switching to used models in an effort avoid paying tariff costs.

          Key Implications

          Inflationary pressures continued to heat up in August, with broad strength in goods and services inflation. Goods prices are likely to continue to drift higher over the coming months as businesses increasingly pass-on more of the tariff costs. However, further upward pressure on services inflation looks limited against the backdrop of a cooling labor market which is likely to limit upward pressure on wage growth and keep a lid on discretionary services spending.

          But nothing is a guarantee, and policymakers will need to balance the risks of reducing the policy rate by enough to breathe some life back into the labor market, but not by so much that they risk unnecessarily stoking inflation. We see the Fed delivering on three quarter-point cuts by year-end, with the first coming at next week’s meeting. We’ve long held this view, and following this morning’s release, Fed futures are pricing in a similar rate-cut path by year-end.

          Source: ACTIONFOREX

          To stay updated on all economic events of today, please check out our Economic calendar
          Risk Warnings and Disclaimers
          You understand and acknowledge that there is a high degree of risk involved in trading. Following any strategies or investment methods may lead to potential losses. The content on the site is provided by our contributors and analysts for information purposes only. You are solely responsible for determining whether any trading assets, securities, strategy, or any other product is suitable for investing based on your own investment objectives and financial situation.
          Add to Favorites
          Share

          New Zealand Dollar Weighs Up Hawksby's Commitment to Further Cuts

          Warren Takunda

          Economic

          NZD is in the red against the majority of its peers after the Reserve Bank of New Zealand (RBNZ) reiterated a committment to deliver two more interest rate cuts this cycle.
          "NZD/USD edged lower to near 0.5940. RBNZ Governor Hawkesby reiterated that the bank forecasts the Official Cash Rate (OCR) to fall by another 0.5% to 2.5% by year‑end," says Samara Hammoud, an analyst at Commonwealth Bank of Australia.
          Although Hawkesby added that the pace of further interest rate cuts will depend on incoming data and the speed of New Zealand's economic recovery, he made it clear he thinks the stale economy will facilitate the move.
          The RBNZ estimates the economy contracted in the second quarter of 2025, but expects growth to resume in the second half of 2025 as household expenditure rises.
          Further rate cuts at the RBNZ will likely weigh on the NZ Dollar going forward, particularly against currencies belonging to central banks that are less inclined to cut interest rates from here.
          "RBNZ's dovish pivot deals a blow to NZD," says Jason Wong, FX strategist at BNZ, the New Zealand Bank. He explains the Reserve Bank of New Zealand's "dovish pivot" has driven domestic bond yields lower, contributing to the NZD's "laggard" status.
          The 'dovish pivot' references the RBNZ's last policy decision, where it cut the Official Cash Rate (OCR) by 25 basis points to 3.0%, but two members of the board dissented from their four colleagues to vote for a larger 50bp cut.
          This was the first such vote split in RBNZ history, and signals a clear belief by decision makers that more work must be done to get interest rates lower in order to support the economy.
          The decision is a prime driver behind ongoing NZD underperformance, with the currency being the third-biggest loser of 2025, following behind the tariff-implicated U.S. and Canadian dollars.
          "While the quarter point cut was no surprise, the catalyst for the move lower in NZD was the debate among the board members between a 25bp and 50bp cut, with two members voting for a 50bp cut. Acting Governor Christian Hawkesby mentioned that the sell-off in the NZD was anticipated and the central bank was comfortable with it," says a note from HSBC.

          Source: Poundsterlinglive

          To stay updated on all economic events of today, please check out our Economic calendar
          Risk Warnings and Disclaimers
          You understand and acknowledge that there is a high degree of risk involved in trading. Following any strategies or investment methods may lead to potential losses. The content on the site is provided by our contributors and analysts for information purposes only. You are solely responsible for determining whether any trading assets, securities, strategy, or any other product is suitable for investing based on your own investment objectives and financial situation.
          Add to Favorites
          Share
          FastBull
          Copyright © 2025 FastBull Ltd

          728 RM B 7/F GEE LOK IND BLDG NO 34 HUNG TO RD KWUN TONG KLN HONG KONG

          TelegramInstagramTwitterfacebooklinkedin
          App Store Google Play Google Play
          Products
          Charts

          Chats

          Q&A with Experts
          Screeners
          Economic Calendar
          Data
          Tools
          Membership
          Features
          Function
          Markets
          Copy Trading
          Latest Signals
          Contests
          News
          Analysis
          24/7
          Columns
          Education
          Company
          Careers
          About Us
          Contact Us
          Advertising
          Help Center
          Feedback
          User Agreement
          Privacy Policy
          Business

          White Label

          Data API

          Web Plug-ins

          Poster Maker

          Affiliate Program

          Risk Disclosure

          The risk of loss in trading financial instruments such as stocks, FX, commodities, futures, bonds, ETFs and crypto can be substantial. You may sustain a total loss of the funds that you deposit with your broker. Therefore, you should carefully consider whether such trading is suitable for you in light of your circumstances and financial resources.

          No decision to invest should be made without thoroughly conducting due diligence by yourself or consulting with your financial advisors. Our web content might not suit you since we don't know your financial conditions and investment needs. Our financial information might have latency or contain inaccuracy, so you should be fully responsible for any of your trading and investment decisions. The company will not be responsible for your capital loss.

          Without getting permission from the website, you are not allowed to copy the website's graphics, texts, or trademarks. Intellectual property rights in the content or data incorporated into this website belong to its providers and exchange merchants.

          Not Logged In

          Log in to access more features

          FastBull Membership

          Not yet

          Purchase

          Become a signal provider
          Help Center
          Customer Service
          Dark Mode
          Price Up/Down Colors

          Log In

          Sign Up

          Position
          Layout
          Fullscreen
          Default to Chart
          The chart page opens by default when you visit fastbull.com