• Trade
  • Markets
  • Copy
  • Contests
  • 24/7
  • Calendar
  • Q&A
  • Chats
Screeners
SYMBOL
LAST
BID
ASK
HIGH
LOW
NET CHG.
%CHG.
SPREAD
SOURCE
SPX
S&P 500 Index
7543.63
7543.63
7543.63
7546.89
7481.73
+60.93
+ 0.81%
--
--
DJI
Dow Jones Industrial Average
52487.41
52487.41
52487.41
52574.89
52249.44
+139.02
+ 0.27%
--
--
IXIC
NASDAQ Composite Index
26206.88
26206.88
26206.88
26215.82
25825.85
+336.24
+ 1.30%
--
--
USDX
US Dollar Index
100.390
100.390
100.470
100.690
100.340
-0.310
-0.31%
--
--
EURUSD
Euro / US Dollar
1.14545
1.14545
1.14553
1.14605
1.14272
+0.00254
+ 0.22%
--
--
GBPUSD
Pound Sterling / US Dollar
1.34435
1.34435
1.34446
1.34514
1.33973
+0.00361
+ 0.27%
--
--
XAUUSD
Gold / US Dollar
4124.77
4124.77
4125.15
4134.68
4108.59
+1.37
+ 0.03%
--
--
WTI
Light Sweet Crude Oil
72.115
72.115
72.150
72.233
71.237
+0.470
+ 0.66%
--
--

Community Accounts

Signal Accounts
--
Profit Accounts
--
Loss Accounts
--
View More

Become a signal provider

Sell trading signals to earn additional income

View More

Guide to Copy Trading

Get started with ease and confidence

View More

Signal Accounts for Members

All Signal Accounts

Best Return
  • Best Return
  • Best P/L
  • Best MDD
Past 1W
  • Past 1W
  • Past 1M
  • Past 1Y

All Contests

  • All
  • Recommend
  • Stocks
  • Cryptocurrencies
  • Central Banks
  • Trump Updates
  • Featured News
Top News Only
Share

Market Sources Indicate That The Japanese Cabinet Is Expected To Make A Decision On The "Honebuto" Policy (basic Policy For Economic And Fiscal Management And Reform) On July 21

Share

The Main Shanghai Silver Futures Contract Surged 4.00% Intraday, Currently Trading At 14,805.00 Yuan/kg

Share

New York Silver Futures Rose 1.00% On The Day, Currently Trading At $60.97 Per Ounce

Share

[Bitcoin Surges Above $64,000 Temporarily] July 10th, According To HTX Market Data, Bitcoin Briefly Surged Above $64,000, Now Trading At $63,953, With A 24-hour Price Increase Of 3.58%

Share

Pricing Documents Show That Qatar Energy Has Set The Official Selling Price For Seaborne Crude Oil In August At A Discount Of $5 Per Barrel To Oman/Dubai Crude Oil Prices; And The Official Selling Price For Land-transported Crude Oil At A Discount Of $4.50 Per Barrel

Share

The Main Butadiene Rubber Futures Contract Rose By 2.00% During The Day, Currently Trading At 12,660 Yuan/ton

Share

The Ministry Of Natural Resources Has Elevated The Marine Disaster Emergency Response For Fujian And Zhejiang To Level II

Share

The Main Palladium Futures Contract Rose By 3.00% Intraday, Currently Trading At 301.6 Yuan/gram

Share

The Main Ethylene Glycol Futures Contract Rose By 2.00% Intraday, Currently Trading At 4221.00 Yuan/ton

Share

Laos Will Officially Become A Shanghai Cooperation Organization (SCO) Dialogue Partner

Share

The New Zealand Dollar (NZD/USD) Extended Its Gains To 0.50% On The Day, Currently Trading At 0.5782

Share

The Main Pulp Futures Contract Continued To Rise, Currently Up More Than 3% To 4,820 Yuan/ton

Share

The Korea Exchange And Foreign Exchange Administration (KEX) Stated That With The Extension Of Trading Hours In The USD/KRW Market, The Room For Maneuver In Stabilizing The Foreign Exchange Market Will Be Further Expanded

Share

The Korea Exchange And Foreign Exchange Administration (KEX) Stated That The Supply And Demand Dynamics Of The Foreign Exchange Market Will Change In The Second Half Of 2026, And Exporters' Dollar Holdings Are Expected To Flow Into The Market Through Foreign Exchange Forward Contracts

Share

The Korea Exchange And Foreign Exchange Administration (KEX) Stated That The USD/KRW Exchange Rate Market Remains Inconsistent With Economic Fundamentals

Share

Spot Gold Fell Back Below $4,110 Per Ounce, Down 0.34% On The Day

Share

The Yield On Japan's 10-year Government Bonds Fell 7.5 Basis Points To 2.800%

Share

Oil-themed Funds Opened Lower, With The Global Oil And Gas Energy LOF Falling More Than 3%, The Harvest Crude Oil LOF Falling More Than 2%, And The E Fund Crude Oil LOF, Southern Crude Oil LOF, And Oil Fund LOF All Falling More Than 1%

Share

China's Central Bank Announced Today That It Conducted 20 Billion Yuan Of 7-day Reverse Repurchase Operations, With A Bid Amount Of 20 Billion Yuan And A Winning Bid Amount Of 20 Billion Yuan. The Operation Rate Was 1.40%, Unchanged From The Previous Rate

Share

The Main Polysilicon Futures Contract Rose By 3.00% Intraday, Currently Trading At 36,605 Yuan/ton

TIME
ACT
FCST
PREV
IMPACT
U.S. EIA Weekly Gasoline Stocks Change

A:--

F: --

P: --

WTI
  • WTI
  • XAUUSD
  • XAGUSD
  • USDX
U.S. EIA Weekly Crude Demand Projected by Production

A:--

F: --

P: --

WTI
  • WTI
  • XAUUSD
  • XAGUSD
  • USDX
U.S. Refinitiv/Ipsos Primary Consumer Sentiment Index (PCSI) (Jul)

A:--

F: --

P: --

USDX
  • USDX
  • XAUUSD
  • XAGUSD
  • WTI
U.S. 10-Year Note Auction Avg. Yield

A:--

F: --

P: --

XAUUSD
  • XAUUSD
  • XAGUSD
  • WTI
  • USDX
FOMC Meeting Minutes
U.S. Consumer Credit (SA) (May)

A:--

F: --

P: --
USDX
  • USDX
  • XAUUSD
  • XAGUSD
  • WTI
U.K. 3-Month RICS House Price Balance (Jun)

A:--

F: --

P: --
GBPUSD
  • GBPUSD
  • XAUUSD
  • XAGUSD
  • WTI
China, Mainland CPI MoM (Jun)

A:--

F: --

P: --

XAUUSD
  • XAUUSD
  • XAGUSD
  • WTI
  • USDX
China, Mainland PPI YoY (Jun)

A:--

F: --

P: --

XAUUSD
  • XAUUSD
  • XAGUSD
  • WTI
  • USDX
China, Mainland CPI YoY (Jun)

A:--

F: --

P: --

XAUUSD
  • XAUUSD
  • XAGUSD
  • WTI
  • USDX
Indonesia Retail Sales YoY (May)

A:--

F: --

P: --

XAUUSD
  • XAUUSD
  • XAGUSD
  • WTI
  • USDX
Germany Exports MoM (SA) (May)

A:--

F: --

P: --
EURUSD
  • EURUSD
  • XAUUSD
  • XAGUSD
  • WTI
  • USDX
Italy 12-Month BOT Auction Avg. Yield

A:--

F: --

P: --

EURUSD
  • EURUSD
  • XAUUSD
  • XAGUSD
  • WTI
  • USDX
U.K. Refinitiv/Ipsos Primary Consumer Sentiment Index (PCSI) (Jul)

A:--

F: --

P: --

GBPUSD
  • GBPUSD
  • XAUUSD
  • XAGUSD
  • WTI
  • USDX
Mexico CPI YoY (Jun)

A:--

F: --

P: --

XAUUSD
  • XAUUSD
  • XAGUSD
  • WTI
  • USDX
U.S. Weekly Initial Jobless Claims (SA)

A:--

F: --

P: --
XAUUSD
  • XAUUSD
  • XAGUSD
  • WTI
  • USDX
U.S. Initial Jobless Claims 4-Week Avg. (SA)

A:--

F: --

P: --
XAUUSD
  • XAUUSD
  • XAGUSD
  • WTI
  • USDX
U.S. Weekly Continued Jobless Claims (SA)

A:--

F: --

P: --
XAUUSD
  • XAUUSD
  • XAGUSD
  • WTI
  • USDX
New York Federal Reserve President Williams delivered a speech.
U.S. Existing Home Sales Annualized Total (Jun)

A:--

F: --

P: --
USDX
  • USDX
  • XAUUSD
  • XAGUSD
  • WTI
U.S. Existing Home Sales Annualized MoM (Jun)

A:--

F: --

P: --
USDX
  • USDX
  • XAUUSD
  • XAGUSD
  • WTI
U.S. EIA Weekly Natural Gas Stocks Change

A:--

F: --

P: --

WTI
  • WTI
  • XAUUSD
  • XAGUSD
  • USDX
China, Mainland M1 Money Supply YoY (Jun)

--

F: --

P: --

China, Mainland M2 Money Supply YoY (Jun)

--

F: --

P: --

China, Mainland M0 Money Supply YoY (Jun)

--

F: --

P: --

U.S. 30-Year Bond Auction Avg. Yield

A:--

F: --

P: --

XAUUSD
  • XAUUSD
  • XAGUSD
  • WTI
  • USDX
U.S. Weekly Treasuries Held by Foreign Central Banks

A:--

F: --

P: --

USDX
  • USDX
  • XAUUSD
  • XAGUSD
  • WTI
Japan PPI MoM (Jun)

A:--

F: --

P: --

USDJPY
  • USDJPY
  • XAUUSD
  • XAGUSD
  • WTI
  • USDX
Japan Domestic Enterprise Commodity Price Index MoM (Jun)

A:--

F: --

P: --
USDJPY
  • USDJPY
  • XAUUSD
  • XAGUSD
  • WTI
  • USDX
Japan Domestic Enterprise Commodity Price Index YoY (Jun)

A:--

F: --

P: --
USDJPY
  • USDJPY
  • XAUUSD
  • XAGUSD
  • WTI
  • USDX
Germany HICP Final MoM (Jun)

--

F: --

P: --

Germany HICP Final YoY (Jun)

--

F: --

P: --

Germany GDP Prelim QoQ (SA) (Jun)

--

F: --

P: --

Germany GDP Prelim YoY (Working-day Adjusted) (Jun)

--

F: --

P: --

France HICP Final MoM (Jun)

--

F: --

P: --

Italy Industrial Output YoY (SA) (May)

--

F: --

P: --

IEA Oil Market Report
India Deposit Gowth YoY

--

F: --

P: --

Mexico Industrial Output YoY (May)

--

F: --

P: --

Brazil CPI YoY (Jun)

--

F: --

P: --

Canada Employment (SA) (Jun)

--

F: --

P: --

Canada Building Permits MoM (SA) (May)

--

F: --

P: --

Canada Labor Force Participation Rate (SA) (Jun)

--

F: --

P: --

Canada Unemployment Rate (SA) (Jun)

--

F: --

P: --

Canada Part-Time Employment (SA) (Jun)

--

F: --

P: --

Canada Full-time Employment (SA) (Jun)

--

F: --

P: --

Russia CPI YoY (Jun)

--

F: --

P: --

U.S. Weekly Total Rig Count

--

F: --

P: --

U.S. Weekly Total Oil Rig Count

--

F: --

P: --

India CPI YoY (Jun)

--

F: --

P: --

Germany Current Account (Not SA) (May)

--

F: --

P: --

Canada National Economic Confidence Index

--

F: --

P: --

Russia Trade Balance (May)

--

F: --

P: --

China, Mainland Trade Balance (CNH) (Jun)

--

F: --

P: --

China, Mainland Imports YoY (CNH) (Jun)

--

F: --

P: --

China, Mainland Exports YoY (USD) (Jun)

--

F: --

P: --

China, Mainland Imports YoY (USD) (Jun)

--

F: --

P: --

China, Mainland Imports (CNH) (Jun)

--

F: --

P: --

China, Mainland Exports (Jun)

--

F: --

P: --

U.K. BRC Like-For-Like Retail Sales YoY (Jun)

--

F: --

P: --

U.K. BRC Overall Retail Sales YoY (Jun)

--

F: --

P: --

Q&A with Experts
    • All
    • Chatrooms
    • Groups
    • Friends
    Mohamed Fe flag
    yes
    Mohamed Fe flag
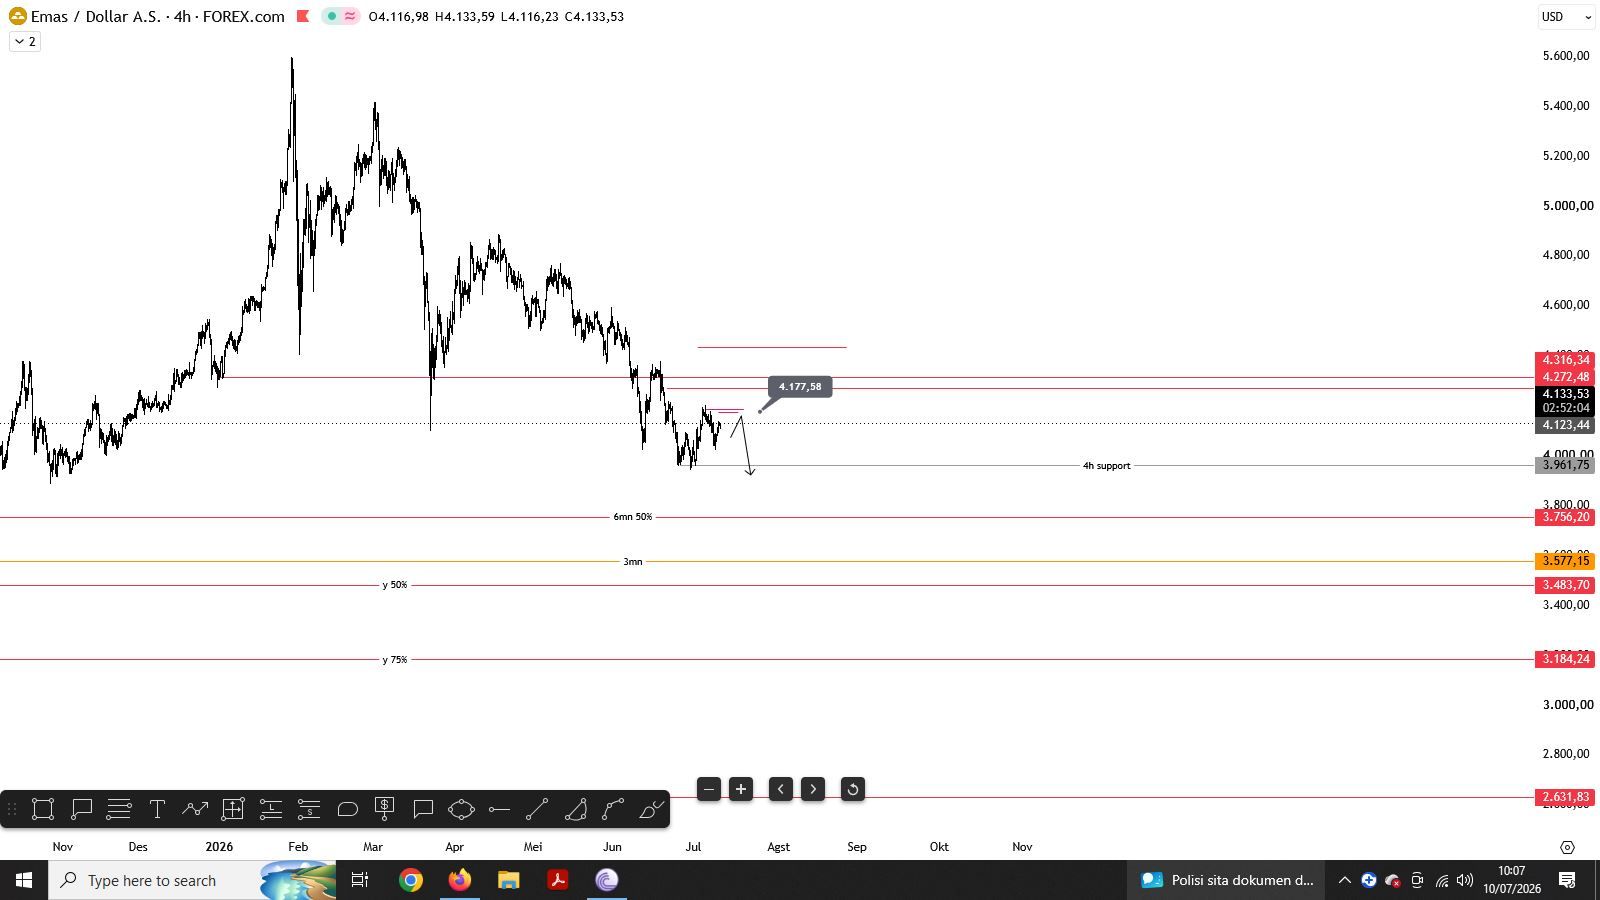
    it retest 4106 climbing up no down trend
    XGPZ35N5M1 flag
    pero también se resiste a subir
    Ram Pratap flag
    not more sell now
    Ram Pratap flag
    4142 is big stop loss from here
    4969323 flag
    hello
    sonam flag
    ok Gold Buy Now
    sonam flag
    Gold Buy Now 4130-4125 SL 4120 TP 4135 TP 4140 TP 4145 TP Open
    XGPZ35N5M1 flag
    ok
    Nawhdir Øt94 flag
    Nawhdir Øt94 flag
    Nawhdir Øt94
    @EuroTrader cousin, may will like?
    tommoffitt flag
    Before 3600 Gold is only sell.
    4969375 flag
    haha
    4969375 flag
    buy now
    THAKUR SAHAB flag
    THAKUR SAHAB
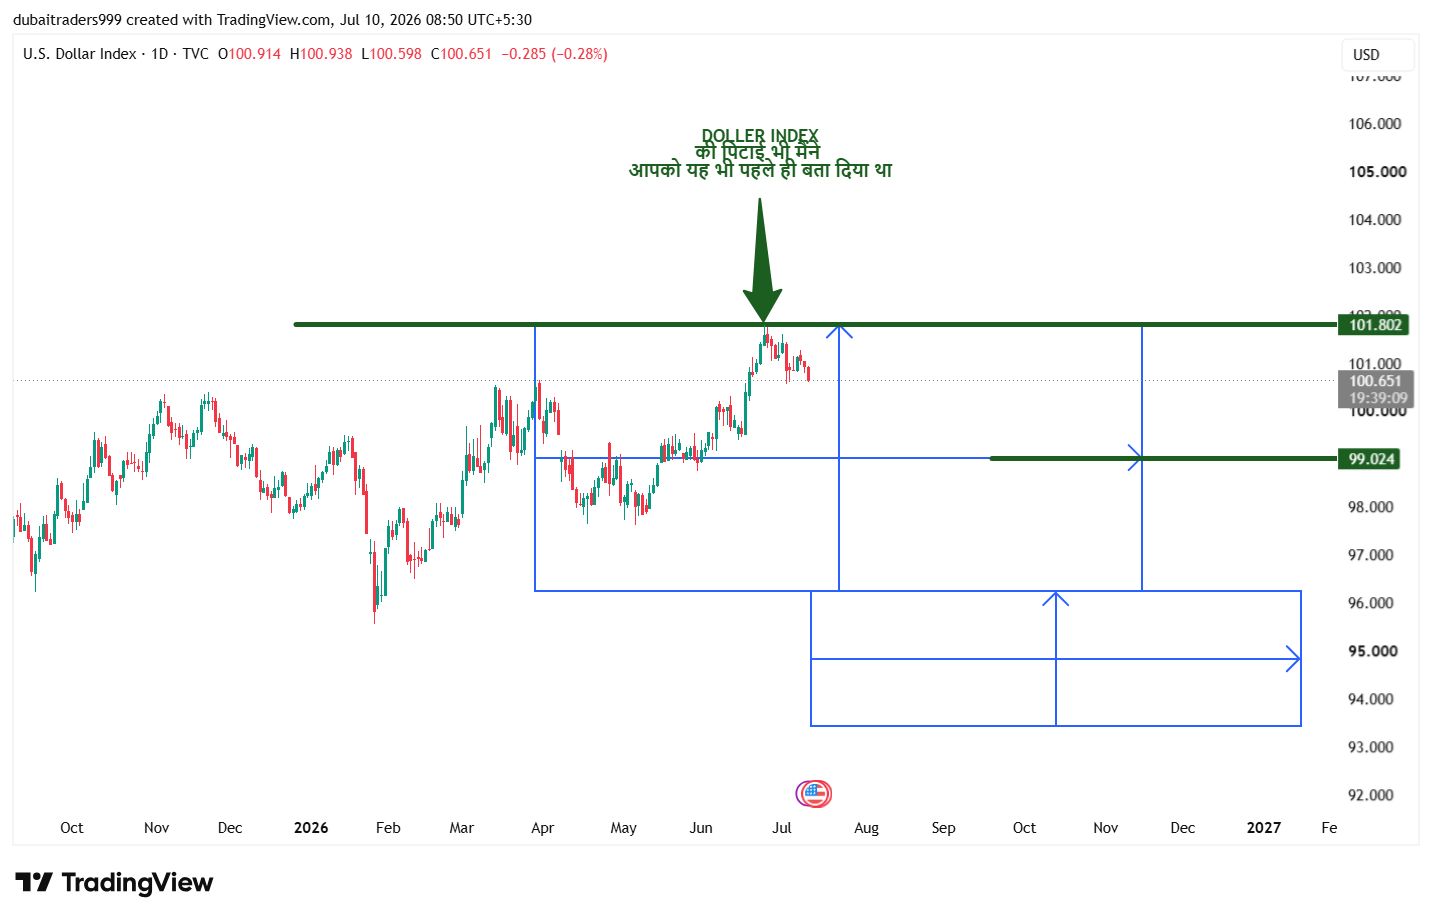
    my topa cousin allready dxy sell on top
    4969375 flag
    4122
    Mohamed Fe flag
    😆😆😆😆 liqudity taking both side
    THAKUR SAHAB flag
    na baby na
    Nawhdir Øt94 flag
    THAKUR SAHAB
    my topa cousin allready dxy sell on top
    @THAKUR SAHABfrom which price he does?
    Nawhdir Øt94 flag
    tommoffitt
    Before 3600 Gold is only sell.
    @tommoffittsuch as that the bias, pale.
    Type here...
    Add Symbol or Code

      No matching data

      All
      Recommend
      Stocks
      Cryptocurrencies
      Central Banks
      Trump Updates
      Featured News
      • All
      • Russia-Ukraine Conflict
      • Middle East Flashpoint
      • All
      • Russia-Ukraine Conflict
      • Middle East Flashpoint
      Search
      Products

      Charts Free Forever

      Chats Q&A with Experts
      Screeners Economic Calendar Data Tools
      Membership Features
      Data Warehouse Market Trends Institutional Data Policy Rates Macro

      Market Trends

      Market Sentiment Order Book Forex Correlations

      Top Indicators

      Charts Free Forever
      Markets

      News

      24/7 Analysis Education

      Latest Views

      Latest Update

      Signals

      Copy Rankings Latest Signals Become a signal provider AI Rating
      Contests
      Brokers

      Overview Brokers Assessment Rankings Regulators News Claims
      Broker listing Forex Brokers Comparison Tool Live Spread Comparison Scam
      Q&A Complaint Scam Alert Videos Tips to Detect Scam
      More

      Business
      Events
      Careers About Us Advertising Help Center

      White Label

      Broker API

      Data API

      Web Plug-ins

      Affiliate Program

      Awards Institution Evaluation IB Seminar Salon Event Exhibition
      Vietnam Thailand Singapore Dubai
      Fans Party Investment Sharing Session
      FastBull Summit BrokersView Expo
      Recent Searches
        Top Searches
          Markets
          Analysis
          User
          24/7
          Economic Calendar
          Education
          Data
          • Names
          • Latest
          • Prev

          View All

          No data

          Scan to Download

          Faster Charts, Chat Faster!

          Download
          English
          • English
          • Español
          • العربية
          • Bahasa Indonesia
          • Bahasa Melayu
          • Tiếng Việt
          • ภาษาไทย
          • Français
          • Italiano
          • Türkçe
          • Русский язык
          • 简中
          • 繁中
          Open Account
          Search
          Products
          Charts Free Forever
          Markets
          News
          Signals

          Copy Rankings Latest Signals Become a signal provider AI Rating
          Contests
          Brokers

          Overview Brokers Assessment Rankings Regulators News Claims
          Broker listing Forex Brokers Comparison Tool Live Spread Comparison Scam
          Q&A Complaint Scam Alert Videos Tips to Detect Scam
          More

          Business
          Events
          Careers About Us Advertising Help Center

          White Label

          Broker API

          Data API

          Web Plug-ins

          Affiliate Program

          Awards Institution Evaluation IB Seminar Salon Event Exhibition
          Vietnam Thailand Singapore Dubai
          Fans Party Investment Sharing Session
          FastBull Summit BrokersView Expo

          10 Best Free Stock Screeners in 2026: Tested and Compared

          zhan chen

          Stocks

          Summary:

          Discover the Best Free Stock Screeners in 2026, tested and compared. See real limits, data delays, and which tools fit your trading and investing style.

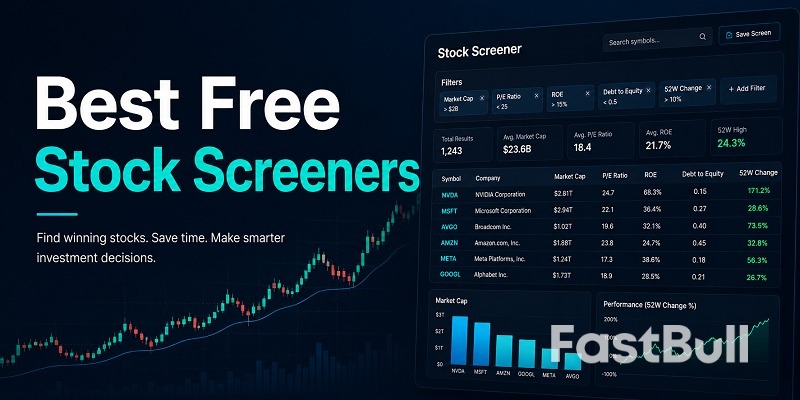
          Free stock screeners are widely used by investors to filter large markets into actionable watchlists, but not all “free” tools offer the same depth of data or speed. In this guide, we test and compare the Best Free Stock Screeners in 2026 to identify which platforms stand out in real use, focusing on filter limits, data delays, and which tools best fit different trading and investing styles.
          10 Best Free Stock Screeners in 2026: Tested and Compared_1

          How to Choose the Best Free Stock Screener for You

          Choosing the Best Free Stock Screeners is not about finding the tool with the longest feature list. The better approach is to match the screener to your data needs, market focus, and investing style.

          • Check the data delay first: Free screeners often use delayed quotes, so they are better for idea generation than real-time trade execution. Finviz, for example, uses delayed U.S. market data in its free version.
          • Match the tool to your strategy: Day traders need faster data and technical signals, swing traders can usually work with delayed data, and long-term investors should prioritize valuation, earnings, profitability, and financial history.
          • Look at market coverage: Some tools focus mainly on U.S. stocks, while others offer broader global or selected international coverage. This matters if you want to screen stocks outside NASDAQ, NYSE, and AMEX.
          • Check what is capped: A free screener may limit exports, saved screens, advanced filters, real-time feeds, historical financials, or the number of reports you can view.
          • Use more than one screener when needed: Many investors use Finviz for fast U.S. stock ideas, TradingView for technical chart-based workflows, and fundamental tools like Stock Analysis or WallStreetZen for deeper company research.

          In short, the best free stock screener is the one that fits your workflow without hiding the data, market, or feature limits that matter most to your strategy.

          1. TradingView Stock Screener

          TradingView Stock Screener is widely used for scanning global markets with technical and fundamental filters, but its free version has clear limitations in data speed and execution use cases.

          Key Free Features and Limits

          • Wide filter coverage: Includes technical indicators, fundamentals, and valuation metrics for equities, ETFs, and multiple asset classes.
          • Global market access: Covers thousands of instruments across major international exchanges.
          • Data delay: Free users may receive delayed or end-of-day pricing data for some exchanges unless real-time exchange data is separately enabled.
          • Feature gating: Advanced alerts, deeper analytics, and enhanced data feeds are restricted to paid plans.

          Pros and Cons

          • Pros: Strong filtering system, integrated charting tools, and broad market coverage.
          • Cons: Limited real-time data on free tier and key advanced features locked behind subscription.

          Best For

          Best suited for swing traders and long-term investors who use screening for idea generation and technical analysis rather than real-time trading execution.

          2. Finviz

          Finviz is one of the most widely used free stock screeners for U.S. equity markets, known for its fast interface and simple filtering system. Its strength is speed and simplicity, but its limitations become clear when you look at market coverage and data access.

          Key Free Features and Limits

          • Market coverage: Limited to U.S. listed stocks, including NASDAQ, NYSE, and AMEX. It does not support direct screening of most international markets.
          • Data delay: Free version typically provides delayed quotes around 15 minutes, making it less suitable for real-time intraday decision-making.
          • Filter system: Offers a large set of screening filters covering fundamentals, technical indicators, and valuation metrics.
          • Export limitations: Advanced export features such as detailed data downloads, including CSV exports, are restricted to the paid Elite version.

          Pros and Cons

          • Pros: Very fast screening interface, strong visual usability, and widely recognized for efficient U.S. stock filtering.
          • Cons: Limited to U.S. markets, delayed data in free version, and key export and advanced features locked behind paywall.

          Best For

          Finviz is best suited for U.S.-focused traders who need fast stock screening for idea generation and shortlisting, especially swing traders and active investors who do not rely on real-time data precision.

          3. Yahoo Finance Stock Screener

          Yahoo Finance Stock Screener is primarily designed for beginners who need a simple and accessible way to filter stocks, but it is not built for advanced trading strategies or real-time market analysis.

          Key Free Features and Limits

          • Beginner-friendly interface: Simple layout that allows users to quickly filter stocks based on common metrics such as price, market cap, and P/E ratio.
          • Basic screening depth: Suitable for simple stock discovery, but less advanced than dedicated technical screening tools used in active trading workflows.
          • No advanced intraday tools: Does not support detailed breakout scanning, relative volume alerts, or high-frequency technical signal filtering.
          • Limited strategy flexibility: Compared with dedicated screeners like Finviz or TradingView, it offers fewer customization options for complex technical screening strategies.

          Pros and Cons

          • Pros: Very easy to use, strong brand trust, and fully integrated with Yahoo Finance news and fundamental data ecosystem.
          • Cons: Limited technical screening depth, weaker active-trading capabilities, and not suitable for advanced intraday trading strategies.

          Best For

          Yahoo Finance Stock Screener is best for beginners and long-term investors who prioritize simplicity and fundamental stock discovery over advanced technical screening or real-time trading signals.

          4. FastBull Stock Screener

          FastBull Stock Screener stands out from typical U.S.-only free screeners by combining stock screening with an integrated research environment — charts, news, financial indicators, and technical analysis in one place, across both U.S. and Vietnamese markets.

          Key Free Features and Limits

          • U.S. and Vietnam screening: FastBull supports stock screening for U.S. and Vietnamese equities, making it useful for investors who want exposure beyond a purely U.S.-only workflow.
          • Integrated research workflow: Investors can move from screening results to price charts, market news, financial indicators, and technical analysis without switching between multiple platforms.
          • Emerging-market angle: FastBull is especially useful for users who want to monitor selected international and emerging market opportunities, rather than only scanning NASDAQ, NYSE, and AMEX stocks.
          • Flexible idea generation: The screener is suitable for building watchlists, comparing stocks, and identifying potential opportunities across different market environments.

          Pros and Cons

          • Pros: Strong fit for cross-market stock discovery, useful U.S. and Vietnam coverage, integrated charts and market news, and a smoother research workflow than many basic free screeners.
          • Cons: Current screener coverage is limited to two markets, which is narrower than global platforms like TradingView or Koyfin.

          Best For

          FastBull Stock Screener is best suited for investors who want a free, practical stock screening tool with U.S. and Vietnam coverage, especially those looking for international diversification ideas and a smoother research workflow beyond basic watchlists.

          5. Zacks Stock Screener

          Zacks Stock Screener is built around a proprietary ranking system that focuses on earnings-based performance signals rather than simple technical or price-based filters, making it more strategy-driven than most free screeners.

          Key Free Features and Limits

          • Zacks Rank integration: Uses a proprietary 1–5 ranking system that evaluates stocks based on earnings estimate revisions, a core factor in Zacks’ investment methodology.
          • Style Score system: Combines Value, Growth, and Momentum scores to help investors filter stocks based on different investment strategies.
          • Custom screener access: Free users can build and use a basic custom screener with standard filters across valuation, fundamentals, and performance metrics.
          • Premium gating: More advanced tools such as pre-built premium screens, Focus List strategies, and deeper research features are restricted to paid plans.

          Pros and Cons

          • Pros: Strong earnings-focused ranking system, structured investment framework, and useful for systematic stock selection.
          • Cons: Many advanced screening strategies are locked behind premium subscription, and the system is more oriented toward medium-term investing than intraday trading.

          Best For

          Zacks Stock Screener is best suited for fundamental investors who prioritize earnings momentum and structured ranking systems over technical chart-based screening, especially those following value, growth, or momentum strategies.

          6. Stock Analysis Stock Screener

          Stock Analysis Stock Screener is designed for users who want a clean, beginner-friendly interface for screening stocks, combining basic fundamental metrics with an easy-to-navigate layout. Its strength is simplicity, but deeper historical data access is limited in the free version.

          Key Free Features and Limits

          • Simple interface: Focuses on clarity and ease of use, making it suitable for beginners who are new to stock screening.
          • Broad fundamental metrics: Includes standard metrics such as valuation ratios, profitability indicators, financial health data, and other screening indicators for stock selection.
          • Limited historical depth: Extended financial history and deeper long-term datasets may be less suitable for institutional-style research compared with premium platforms.
          • Lightweight workflow: Optimized for quick screening and idea generation rather than deep institutional-style analysis.

          Pros and Cons

          • Pros: Very clean UI, easy learning curve, and suitable for quick stock discovery without complexity.
          • Cons: Limited advanced screening depth compared with professional terminals, less strategy automation, and less suitable for complex multi-factor workflows.

          Best For

          Stock Analysis Stock Screener is best suited for beginner and lightweight investors who want to quickly explore stocks and transition gradually into deeper fundamental analysis before upgrading to more advanced tools.

          7. Koyfin

          Koyfin is a more advanced stock screening and analytics platform designed for investors who need deeper market visibility than typical free beginner screeners. It combines global screening, charting, and financial data tools, but its free tier is intentionally limited for professional-scale use cases.

          Key Free Features and Limits

          • Global stock screener: Provides access to international equities screening across multiple regions, making it more global than most U.S.-focused free tools.
          • Watchlists and tracking tools: Users can build watchlists to monitor stocks and macro themes in a structured way.
          • Advanced charting: Includes institutional-style charts and financial visualization tools that go beyond basic screener interfaces.
          • Workflow limitations: Free users may face restrictions on advanced workflows, saved templates, exports, or deeper platform usage depending on the current plan structure.
          • Financial history limits: Access to deeper financial history and professional-scale datasets may require paid plans, which reduces deep fundamental analysis capability for free-only users.

          Pros and Cons

          • Pros: Strong global coverage, professional-grade interface, useful watchlist system, and more advanced analytics compared to beginner-focused screeners.
          • Cons: Some advanced features are limited in free plan, deeper financial history may require paid access, and it has a steeper learning curve compared to simple tools like Yahoo Finance or Stock Analysis.

          Best For

          Koyfin is best suited for intermediate to advanced investors who want a more institutional-style workflow, especially those who analyze multiple markets and require more structured financial data than beginner screeners provide.

          8. Simply Wall St

          Simply Wall St is a visually driven stock analysis platform designed to simplify fundamental investing by turning financial data into intuitive graphics, making it easier for investors to evaluate companies without relying on traditional tables and ratios.

          Key Free Features and Limits

          • Snowflake visualization: Core feature that summarizes a stock’s valuation, financial health, growth, and dividends in a single visual dashboard.
          • Simplified company reports: Provides easy-to-read breakdowns of fundamentals, suitable for non-technical investors.
          • Limited report access: Free users may face limits on how many full company reports or deeper analysis features they can access, depending on the current plan structure.
          • Restricted screener access: Full screening capabilities are limited in the free plan compared to paid tiers, especially for building custom multi-factor screens.

          Pros and Cons

          • Pros: Extremely user-friendly interface, strong visual storytelling via Snowflake model, and ideal for quick fundamental understanding without financial jargon.
          • Cons: Limited free access, reduced screening flexibility in free version, and less suitable for advanced or quantitative investors.

          Best For

          Simply Wall St is best suited for visual-oriented long-term investors who prefer simplified, graphics-based analysis over traditional financial tables, especially those who want quick company evaluation without deep technical screening.

          9. MarketWatch Stock Screener

          MarketWatch Stock Screener is designed as a lightweight entry-level tool that prioritizes simplicity and news integration over advanced screening depth, making it more of a discovery and research gateway than a professional screening platform.

          Key Free Features and Limits

          • Minimal filter set: Offers a small number of core screening inputs, including price, volume, market cap, P/E ratio, and technical filters.
          • Beginner-oriented design: Simplified structure intended for users who are new to stock markets and need basic filtering without complex setup.
          • Strong news integration: Screening results are tightly connected to MarketWatch news articles, analyst commentary, and related market context for each stock.
          • Limited screening depth: Lacks advanced technical filters such as breakout signals, relative volume analysis, or multi-factor screening logic.

          Pros and Cons

          • Pros: Extremely easy to use, strong integration with financial news and analysis content, and useful for initial stock discovery.
          • Cons: Very limited screening capabilities, not suitable for technical traders or strategy-based screening, and lacks customization depth.

          Best For

          MarketWatch Stock Screener is best suited for first-time investors who want a simple entry point into stock screening combined with immediate access to news, analyst opinions, and market context rather than advanced trading analysis.

          10. WallStreetZen Stock Screener

          WallStreetZen Stock Screener is built for long-term fundamental investors who prefer structured stock evaluation over technical or intraday trading tools. Its core system, Zen Ratings, simplifies complex financial analysis into a single score-based framework.

          Key Free Features and Limits

          • Zen Ratings system: Assigns stocks a composite rating based on approximately 115 fundamental factors, including valuation, growth, profitability, risk, and AI-driven analysis.
          • Due Diligence Score: Free users can view structured analysis for selected stocks, providing insight into company quality and risk profile.
          • Limited screening functionality: Some custom screener creation, saved screening strategies, or deeper analysis features may be restricted in the free version.
          • Focus on fundamentals: Designed primarily for long-term investing decisions rather than short-term trading signals or technical chart-based strategies.

          Pros and Cons

          • Pros: Strong fundamental scoring system, simplified decision-making framework, and useful for identifying long-term quality stocks.
          • Cons: Limited free access to deep analysis, some advanced workflows require paid access, and not suitable for day trading or technical trading workflows.

          Best For

          WallStreetZen is best suited for long-term fundamental investors who want a simplified, score-based approach to stock selection and prefer structured quality ratings over real-time or technical screening tools.

          Free Stock Screener Comparison Table

          This comparison highlights the Best Free Stock Screeners based on the factors that actually impact decision-making: filter depth, data delay, and most importantly, market coverage.

          ScreenerFilter DepthData DelayMarket Coverage
          TradingViewHighEnd-of-day / delayed for some markets unless real-time data is enabledGlobal multi-asset markets
          FinvizHighAround 15 min delayUS (NASDAQ / NYSE / AMEX)
          Yahoo FinanceLow to MediumDelayedUS + selected global exposure
          FastBullMediumVaries by marketUS + Vietnam
          KoyfinHighDelayed / mixed depending on market and planGlobal coverage
          Stock AnalysisMedium to HighFrequent updates, not positioned as a real-time trading toolUS + Global
          Simply Wall StMediumDelayedGlobal
          MarketWatchVery Low to LowDelayedUS-focused
          ZacksMediumDelayedUS stocks
          WallStreetZenMediumDelayedUS stocks

          FAQs About Free Stock Screeners

          Can I use ChatGPT as a stock screener?

          No, ChatGPT cannot function as a real-time stock screener. It does not have live market data or direct access to screening databases, so it cannot filter stocks dynamically.

          Is Finviz the best free stock screener?

          Finviz is one of the best free stock screeners for U.S. markets. It is especially strong for fast filtering, but it is limited to U.S. exchanges and delayed data.

          Which AI is best for stock screening?

          No single AI is the best for stock screening because screening requires structured market data, not just language models. Most “AI screeners” still rely on traditional financial databases combined with ranking algorithms.

          Is TradingView better than Finviz?

          TradingView is better for technical charting and global market coverage. Finviz is better for fast U.S.-focused screening, so the better choice depends on your trading style.

          Are free stock screeners accurate?

          Yes, but only for delayed and non-institutional use cases. Free screeners are generally accurate for idea generation, but they often lack real-time precision and advanced data depth.

          Conclusion

          The Best Free Stock Screeners depend on your trading style, data needs, and market focus rather than a single “best” tool. Day traders and technical users should prioritize TradingView or Finviz, beginners will find Yahoo Finance more suitable, investors looking for U.S. and Vietnam stock screening with broader market research tools should consider FastBull, while long-term fundamental investors are better served by WallStreetZen or Stock Analysis.

          Risk Warnings and Disclaimers
          You understand and acknowledge that there is a high degree of risk involved in trading. Following any strategies or investment methods may lead to potential losses. The content on the site is provided by our contributors and analysts for information purposes only. You are solely responsible for determining whether any trading assets, securities, strategy, or any other product is suitable for investing based on your own investment objectives and financial situation.
          Add to Favorites
          Share
          FastBull
          Copyright © 2026 FastBull Ltd

          728 RM B 7/F GEE LOK IND BLDG NO 34 HUNG TO RD KWUN TONG KLN HONG KONG

          TelegramInstagramTwitterfacebooklinkedin
          App Store Google Play Android Windows
          Products
          Charts

          Chats

          Q&A with Experts
          Screeners
          Economic Calendar
          Data
          Tools
          Membership
          Features
          Function
          Markets
          Copy Trading
          Latest Signals
          Contests
          24/7
          Analysis
          Education
          Company
          Careers
          About Us
          Contact Us
          Advertising
          Download FastBull
          Help Center
          Feedback
          User Agreement
          Privacy Policy
          Personal Information Protection Statement
          Business

          White Label

          Broker API

          Data API

          Web Plug-ins

          Poster Maker

          Affiliate Program

          Risk Disclosure

          The risk of loss in trading financial instruments such as stocks, FX, commodities, futures, bonds, ETFs and crypto can be substantial. You may sustain a total loss of the funds that you deposit with your broker. Therefore, you should carefully consider whether such trading is suitable for you in light of your circumstances and financial resources.

          No decision to invest should be made without thoroughly conducting due diligence by yourself or consulting with your financial advisors. Our web content might not suit you since we don't know your financial conditions and investment needs. Our financial information might have latency or contain inaccuracy, so you should be fully responsible for any of your trading and investment decisions. The company will not be responsible for your capital loss.

          Without getting permission from the website, you are not allowed to copy the website's graphics, texts, or trademarks. Intellectual property rights in the content or data incorporated into this website belong to its providers and exchange merchants.

          Not Logged In

          Log in to access more features

          Connect Broker
          Become a signal provider
          Help Center
          Customer Service
          Dark Mode
          Price Up/Down Colors

          Log In

          Sign Up

          Position
          Layout
          Fullscreen
          Default to Chart
          The chart page opens by default when you visit fastbull.com