

Markets
News
Analysis
User
24/7
Economic Calendar
Education
Data
- Names
- Latest
- Prev


Signal Accounts for Members
All Signal Accounts
All Contests
 Turkey Trade Balance
A:--
F: --
P: --
 Germany Construction PMI (SA) (Nov)
A:--
F: --
P: --
 Euro Zone IHS Markit Construction PMI (Nov)
A:--
F: --
P: --
 Italy IHS Markit Construction PMI (Nov)
A:--
F: --
P: --
 U.K. Markit/CIPS Construction PMI (Nov)
A:--
F: --
P: --
 France 10-Year OAT Auction Avg. Yield
A:--
F: --
P: --
Euro Zone Retail Sales MoM (Oct)A:--
F: --
P: --
Euro Zone Retail Sales YoY (Oct)A:--
F: --
P: --
 Brazil GDP YoY (Q3)
A:--
F: --
P: --
 U.S. Challenger Job Cuts (Nov)
A:--
F: --
P: --
U.S. Challenger Job Cuts MoM (Nov)A:--
F: --
P: --
U.S. Challenger Job Cuts YoY (Nov)A:--
F: --
P: --
U.S. Initial Jobless Claims 4-Week Avg. (SA)A:--
F: --
P: --
U.S. Weekly Initial Jobless Claims (SA)A:--
F: --
P: --
U.S. Weekly Continued Jobless Claims (SA)A:--
F: --
P: --
 Canada Ivey PMI (SA) (Nov)
A:--
F: --
P: --
Canada Ivey PMI (Not SA) (Nov)A:--
F: --
P: --
U.S. Non-Defense Capital Durable Goods Orders Revised MoM (Excl. Aircraft) (SA) (Sept)A:--
F: --
U.S. Factory Orders MoM (Excl. Transport) (Sept)A:--
F: --
P: --
U.S. Factory Orders MoM (Sept)A:--
F: --
P: --
U.S. Factory Orders MoM (Excl. Defense) (Sept)A:--
F: --
P: --
U.S. EIA Weekly Natural Gas Stocks ChangeA:--
F: --
P: --
Saudi Arabia Crude Oil ProductionA:--
F: --
P: --
U.S. Weekly Treasuries Held by Foreign Central BanksA:--
F: --
P: --
 Japan Foreign Exchange Reserves (Nov)
A:--
F: --
P: --
 India Repo Rate
A:--
F: --
P: --
India Benchmark Interest RateA:--
F: --
P: --
India Reverse Repo RateA:--
F: --
P: --
India Cash Reserve RatioA:--
F: --
P: --
Japan Leading Indicators Prelim (Oct)A:--
F: --
P: --
U.K. Halifax House Price Index YoY (SA) (Nov)--
F: --
P: --
U.K. Halifax House Price Index MoM (SA) (Nov)--
F: --
P: --
France Current Account (Not SA) (Oct)--
F: --
P: --
France Trade Balance (SA) (Oct)--
F: --
P: --
France Industrial Output MoM (SA) (Oct)--
F: --
P: --
Italy Retail Sales MoM (SA) (Oct)--
F: --
P: --
Euro Zone Employment YoY (SA) (Q3)--
F: --
P: --
Euro Zone GDP Final YoY (Q3)--
F: --
P: --
Euro Zone GDP Final QoQ (Q3)--
F: --
P: --
Euro Zone Employment Final QoQ (SA) (Q3)--
F: --
P: --
Euro Zone Employment Final (SA) (Q3)--
F: --
Brazil PPI MoM (Oct)--
F: --
P: --
 Mexico Consumer Confidence Index (Nov)
--
F: --
P: --
Canada Unemployment Rate (SA) (Nov)--
F: --
P: --
Canada Labor Force Participation Rate (SA) (Nov)--
F: --
P: --
Canada Employment (SA) (Nov)--
F: --
P: --
Canada Part-Time Employment (SA) (Nov)--
F: --
P: --
Canada Full-time Employment (SA) (Nov)--
F: --
P: --
U.S. Dallas Fed PCE Price Index YoY (Sept)--
F: --
P: --
U.S. PCE Price Index YoY (SA) (Sept)--
F: --
P: --
U.S. PCE Price Index MoM (Sept)--
F: --
P: --
U.S. Personal Outlays MoM (SA) (Sept)--
F: --
P: --
U.S. Core PCE Price Index MoM (Sept)--
F: --
P: --
U.S. UMich 5-Year-Ahead Inflation Expectations Prelim YoY (Dec)--
F: --
P: --
U.S. Core PCE Price Index YoY (Sept)--
F: --
P: --
U.S. 5-10 Year-Ahead Inflation Expectations (Dec)--
F: --
P: --
U.S. UMich Current Economic Conditions Index Prelim (Dec)--
F: --
P: --
U.S. UMich Consumer Sentiment Index Prelim (Dec)--
F: --
P: --
U.S. UMich 1-Year-Ahead Inflation Expectations Prelim (Dec)--
F: --
P: --
U.S. UMich Consumer Expectations Index Prelim (Dec)--
F: --
P: --

No matching data
Latest Views
Latest Views
Trending Topics
Top Columnists
Latest Update
White Label
Data API
Web Plug-ins
Affiliate Program
View All
No data
The dollar strengthened across the board following the publication of the minutes from the latest Federal Reserve meeting. The document confirmed the regulator's readiness to cut rates further, but without clear timing and with an emphasis on future decisions depending on incoming data.
The dollar strengthened across the board following the publication of the minutes from the latest Federal Reserve meeting. The document confirmed the regulator's readiness to cut rates further, but without clear timing and with an emphasis on future decisions depending on incoming data. For some market participants, this sounded less "dovish" than expected, prompting increased demand for the dollar, while Treasury yields held near local highs.
Another source of uncertainty remains the impact of the prolonged US government shutdown. Due to the suspension of statistical agencies, some key releases on employment and inflation were not published on schedule, meaning that the upcoming batch of labour-market data may bring surprises. Today, investors are focused on private-sector employment reports, jobless-claims data, and related indicators, which will help shape expectations ahead of the Fed's next decisions.
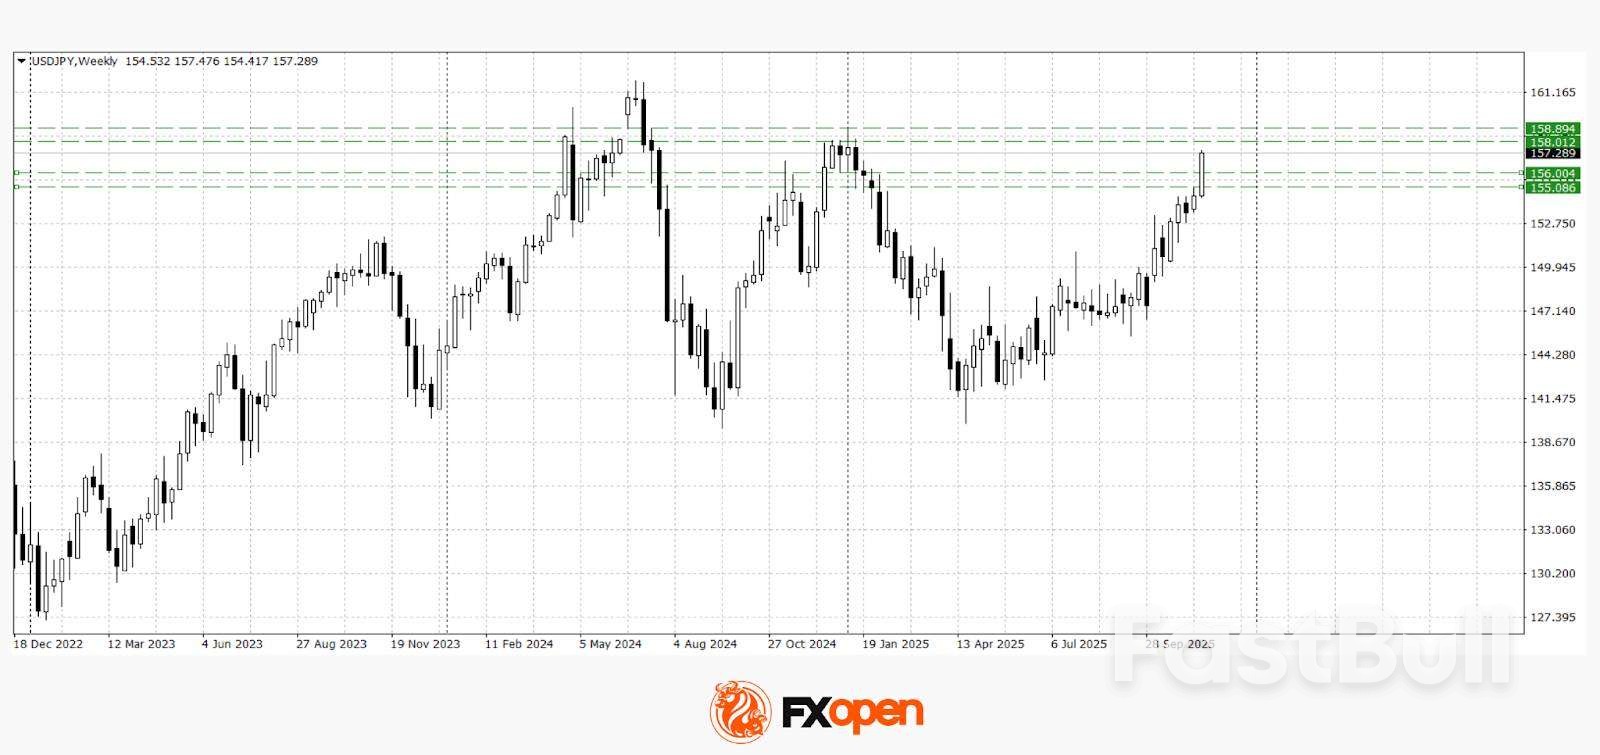
The USD/JPY pair has reached this year's extremes, reacting to the monetary-policy differential. The pair is trading above 157.00, reflecting a combination of a more resilient dollar and the Bank of Japan's persistently dovish stance. The market still does not see the Japanese regulator preparing for tightening, whereas the Fed, despite being in a rate-cutting cycle, maintains a cautious tone and highlights inflation risks.
Technical analysis of USD/JPY suggests a possible test of the key 158.00–158.90 range if the 157.00 level confirms itself as support. Should a downward pullback develop, the pair may decline towards 155.20–156.00.
Events that may influence USD/JPY pricing in the coming trading sessions include:
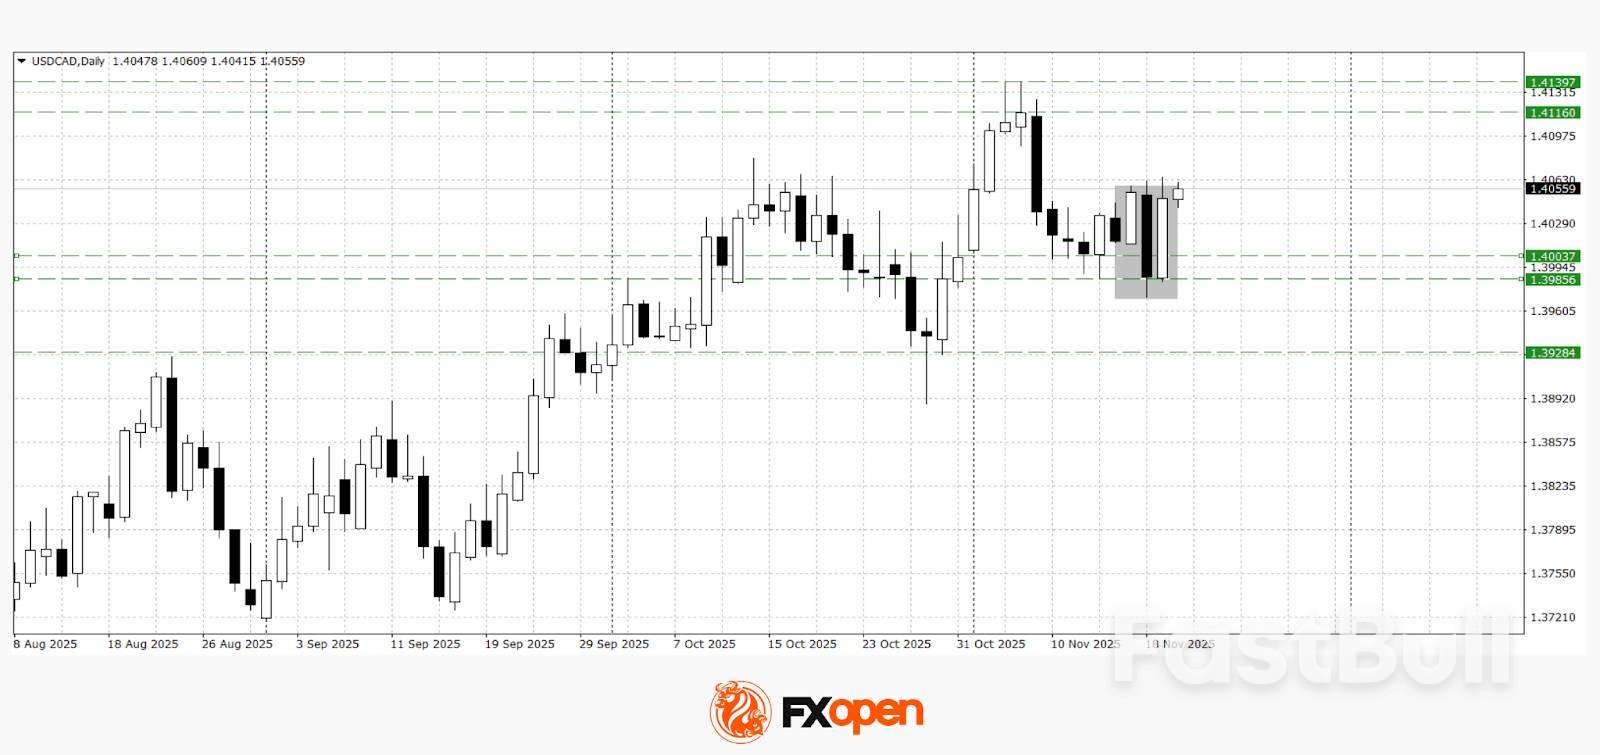
Sellers of USD/CAD made another attempt yesterday to break support at 1.3980, but were unsuccessful. The price rebounded sharply from this level and held above 1.4000. If the upward momentum continues, the pair may revisit recent highs near 1.4140. A firm move back below 1.4000 could trigger another approach towards 1.3930.
Events that may influence USD/CAD pricing in the coming trading sessions include:

This cardano ada price prediction examines whether the critical $0.51 support zone can act as a launchpad for a long-term move toward $10 between 2025 and 2030. By combining technical analysis, on-chain data, macro drivers and network development trends, this guide provides balanced scenarios to help traders and investors understand potential price paths, key risks and realistic expectations for ADA’s future performance.
The current cardano ada price prediction is highly sensitive to short-term volatility and broader market sentiment. ADA continues to trade within a compressed range, reflecting indecision among market participants and aligning with typical consolidation phases seen before major breakouts.
| Indicator | Current Signal |
|---|---|
| RSI (14) | Neutral to mildly bullish |
| MACD | Early convergence forming |
| 200-Day MA | Acting as dynamic resistance |
The $0.51 level remains the most closely watched zone in any ada cardano price prediction model. Historically, this level has acted as a liquidity magnet and structural base, reinforcing its importance in short and mid-term outlooks.
On-chain data reveals increasing whale wallet accumulation during consolidation phases, a behaviour often preceding larger directional moves. Exchange netflows indicate moderate outflows, suggesting investors are positioning for longer-term holding rather than immediate selling pressure.
This pattern aligns with broader narratives surrounding cardano ada price prediction crypto news, reinforcing the theory that institutional confidence may be rebuilding.
| Quarter | Projected Range (USD) | Market Theme |
|---|---|---|
| Q1 2025 | $0.60 – $0.88 | Accumulation phase |
| Q2 2025 | $0.75 – $1.05 | Speculative momentum |
| Q3 2025 | $0.85 – $1.25 | ETF sentiment anticipation |
| Q4 2025 | $1.10 – $1.60 | Trend confirmation phase |
If regulatory approval occurs, cardano ada price prediction 2025 models suggest accelerated capital inflows into ADA. ETF confirmation may attract institutional demand comparable to historical BTC and ETH behaviour.
Without ETF approval, price action may remain confined within a moderate growth band. This scenario still retains upward momentum but reflects conservative sentiment and delayed institutional commitment.
This outlook also aligns with conservative projections seen in cardano ada price prediction july 2025 discussions, which anticipate gradual progression rather than explosive price action.
Long-term scenarios for ADA between 2026 and 2030 depend on network execution, macro cycles and overall crypto market structure. The table below outlines an illustrative year-by-year range often considered in mid-term cardano ada price prediction models.
| Year | Min (USD) | Average (USD) | Max (USD) |
|---|---|---|---|
| 2026 | $0.90 | $1.60 | $2.40 |
| 2027 | $1.20 | $2.10 | $3.20 |
| 2028 | $1.50 | $2.80 | $4.50 |
| 2029 | $1.80 | $3.50 | $6.50 |
| 2030 | $2.20 | $4.80 | $10.00 |
These values are not guarantees but scenario ranges, providing a structured view for ada cardano price prediction discussions through 2030.
For any multi-year cardano ada price prediction 2030 roadmap, technical milestones are as important as market cycles. Some of the key checkpoints that could influence sentiment and valuation include:
If delivered on schedule, these milestones may support the thesis that ADA can gradually move into a higher valuation band over the 2026-2030 window.
DeFi activity and institutional interest are key pillars behind any ambitious cardano ada price prediction. Capital tends to follow robust ecosystems with real usage and reliable infrastructure.
Balanced analysis, rather than purely speculative cardano ada price prediction crypto news headlines, should weigh these adoption factors when assessing ADA’s potential path toward higher price targets by 2030.
On higher timeframes, ADA has at times formed structures resembling a falling wedge, a pattern that can precede bullish reversals if confirmed by volume and follow-through. Shorter-term charts may show nested wedges or channels inside the broader formation.
In this context, traders often frame cardano ada price prediction scenarios around whether a decisive breakout above wedge resistance can unlock a new trend leg.
Trend-following indicators provide additional confirmation for any falling wedge breakout thesis. Moving averages and momentum oscillators help distinguish between genuine reversals and short-lived rallies.
| Indicator | Typical Bullish Confirmation Signal |
|---|---|
| 50-Day MA | Price reclaiming and holding above after wedge breakout |
| 200-Day MA | Golden cross or sustained trade above long-term trendline |
| RSI | Move from oversold into 50–70 range with higher lows |
When these conditions align, they support more constructive cardano ada price prediction views, especially in multi-year frameworks extending to 2030.
Mapping long-term support and resistance gives structure to both conservative and aggressive targets used in extended forecasts such as cardano ada price prediction atgraphite.com or other research sources. Below is an illustrative level map for the coming years:
| Zone | Approximate Price Band (USD) | Role |
|---|---|---|
| Major Support | $0.50 – $0.70 | Structural base and long-term accumulation region |
| Intermediate Range | $1.00 – $3.00 | Rotation and consolidation area in many models |
| Expansion Zone | $3.00 – $6.50 | Potential mid-cycle rally targets |
| Speculative Upper Band | $6.50 – $10.00 | Aggressive upside target range toward 2030 |
These bands help frame both shorter-term ideas such as cardano ada price prediction 2025 and longer horizons like cardano ada price prediction 2030 within a consistent technical structure, rather than relying solely on isolated price points.
Smart contract expansion remains one of the most influential pillars behind any ada cardano price prediction. The continued evolution of Plutus scripts and developer tooling directly affects network usage, transaction volume and ecosystem maturity.
These metrics often provide a more grounded perspective than short-term cardano ada price prediction crypto news narratives focused solely on speculative momentum.
The Plomin hard fork represents a significant phase in Cardano’s governance and decentralization journey. Its implementation may improve network efficiency, security and participation in on-chain decision-making.
For long-term cardano ada price prediction 2030 models, sustained decentralization and reliable governance frameworks are critical in supporting institutional confidence and long-term valuation.
Cardano’s positioning as a third-generation blockchain places it in direct competition with Ethereum, Solana and other Layer-1 ecosystems. Its appeal lies in scalability, formal verification and academic-driven development.
How effectively Cardano captures market share in high-growth sectors such as DeFi and gaming will significantly shape any mid-to-long term cardano ada price prediction trajectory.
While optimistic projections exist, several risk elements could weaken or invalidate the $10 scenario often mentioned in cardano ada price prediction narratives.
Sustained failure to innovate would significantly challenge aggressive targets projected in some ada cardano price prediction models.
| Year | Projected Average Range (USD) | Key Assumptions |
|---|---|---|
| 2040 | $12.00 – $25.00 | Mass adoption and mature blockchain utility |
| 2050 | $25.00 – $50.00+ | Global integration and sustained institutional use |
These extended forecasts are speculative in nature and are meant to complement long-term perspectives such as cardano ada price prediction atgraphite.com and similar research-based models.
Effective planning is essential when interpreting any cardano ada price prediction 2025 or longer-term outlooks. Investors should balance optimism with realistic portfolio safeguards.
Rather than reacting to short-lived cardano ada price prediction july 2025 speculation spikes, disciplined strategies focused on fundamentals tend to provide more sustainable outcomes over multi-decade horizons.
Reaching $10 is possible under aggressive scenarios where sustained adoption, strong DeFi growth, major network upgrades and favourable macro conditions align. Most cardano ada price prediction models view $10 as a long-term target rather than a near-term expectation.
Estimates vary widely. Conservative projections place ADA between $2 and $4, while optimistic forecasts supported by widespread adoption and ecosystem maturity suggest prices could exceed $8 by 2030.
$100 remains a highly speculative level requiring massive market expansion, enterprise integration and global-scale usage. Most current cardano ada price prediction frameworks do not consider this level realistic within the next few decades.
This cardano ada price prediction highlights how ADA’s future depends on technical strength, ecosystem expansion and broader market conditions. While the $0.51 support zone may provide a base for growth, long-term progress toward higher targets requires sustained innovation and adoption. Investors should balance opportunity with careful risk evaluation and realistic expectations when assessing ADA’s potential through 2030 and beyond.
The GBP/USD pair fell sharply to 1.3048 on Thursday, pressured by a combination of soft domestic inflation data and a broadly stronger US dollar.
The pound's decline was triggered by the latest UK Consumer Price Index (CPI) report, which showed inflation slowed to 3.6% year-on-year in October, matching forecasts. This bolstered market expectations that the Bank of England (BoE) could initiate interest rate cuts as early as December. The data fits a broader narrative of weakening domestic demand: the labour market is cooling, GDP growth is undershooting the central bank's projections, and core inflation is tracking slightly below the BoE's anticipated path. In light of this, institutions, including Deutsche Bank, suggest the Monetary Policy Committee (MPC) will gain the confidence needed to lower the Bank Rate from its current 4.00% level.
Additional headwinds for sterling stemmed from a resurgent US dollar, which found support ahead of key US macroeconomic data and the highly anticipated earnings report from the AI-chip giant, Nvidia.
Globally, investor attention is also captivated by the Japanese yen, which slumped to a 10-month low after the Ministry of Finance issued a statement expressing a "high degree of caution" over the currency's movements. This phrase stopped short of threatening direct intervention.
Overall, market uncertainty is elevated. US statistical agencies are only just beginning to release the backlog of data delayed by the recent government shutdown, leaving traders to piece together the true state of the world's largest economy.
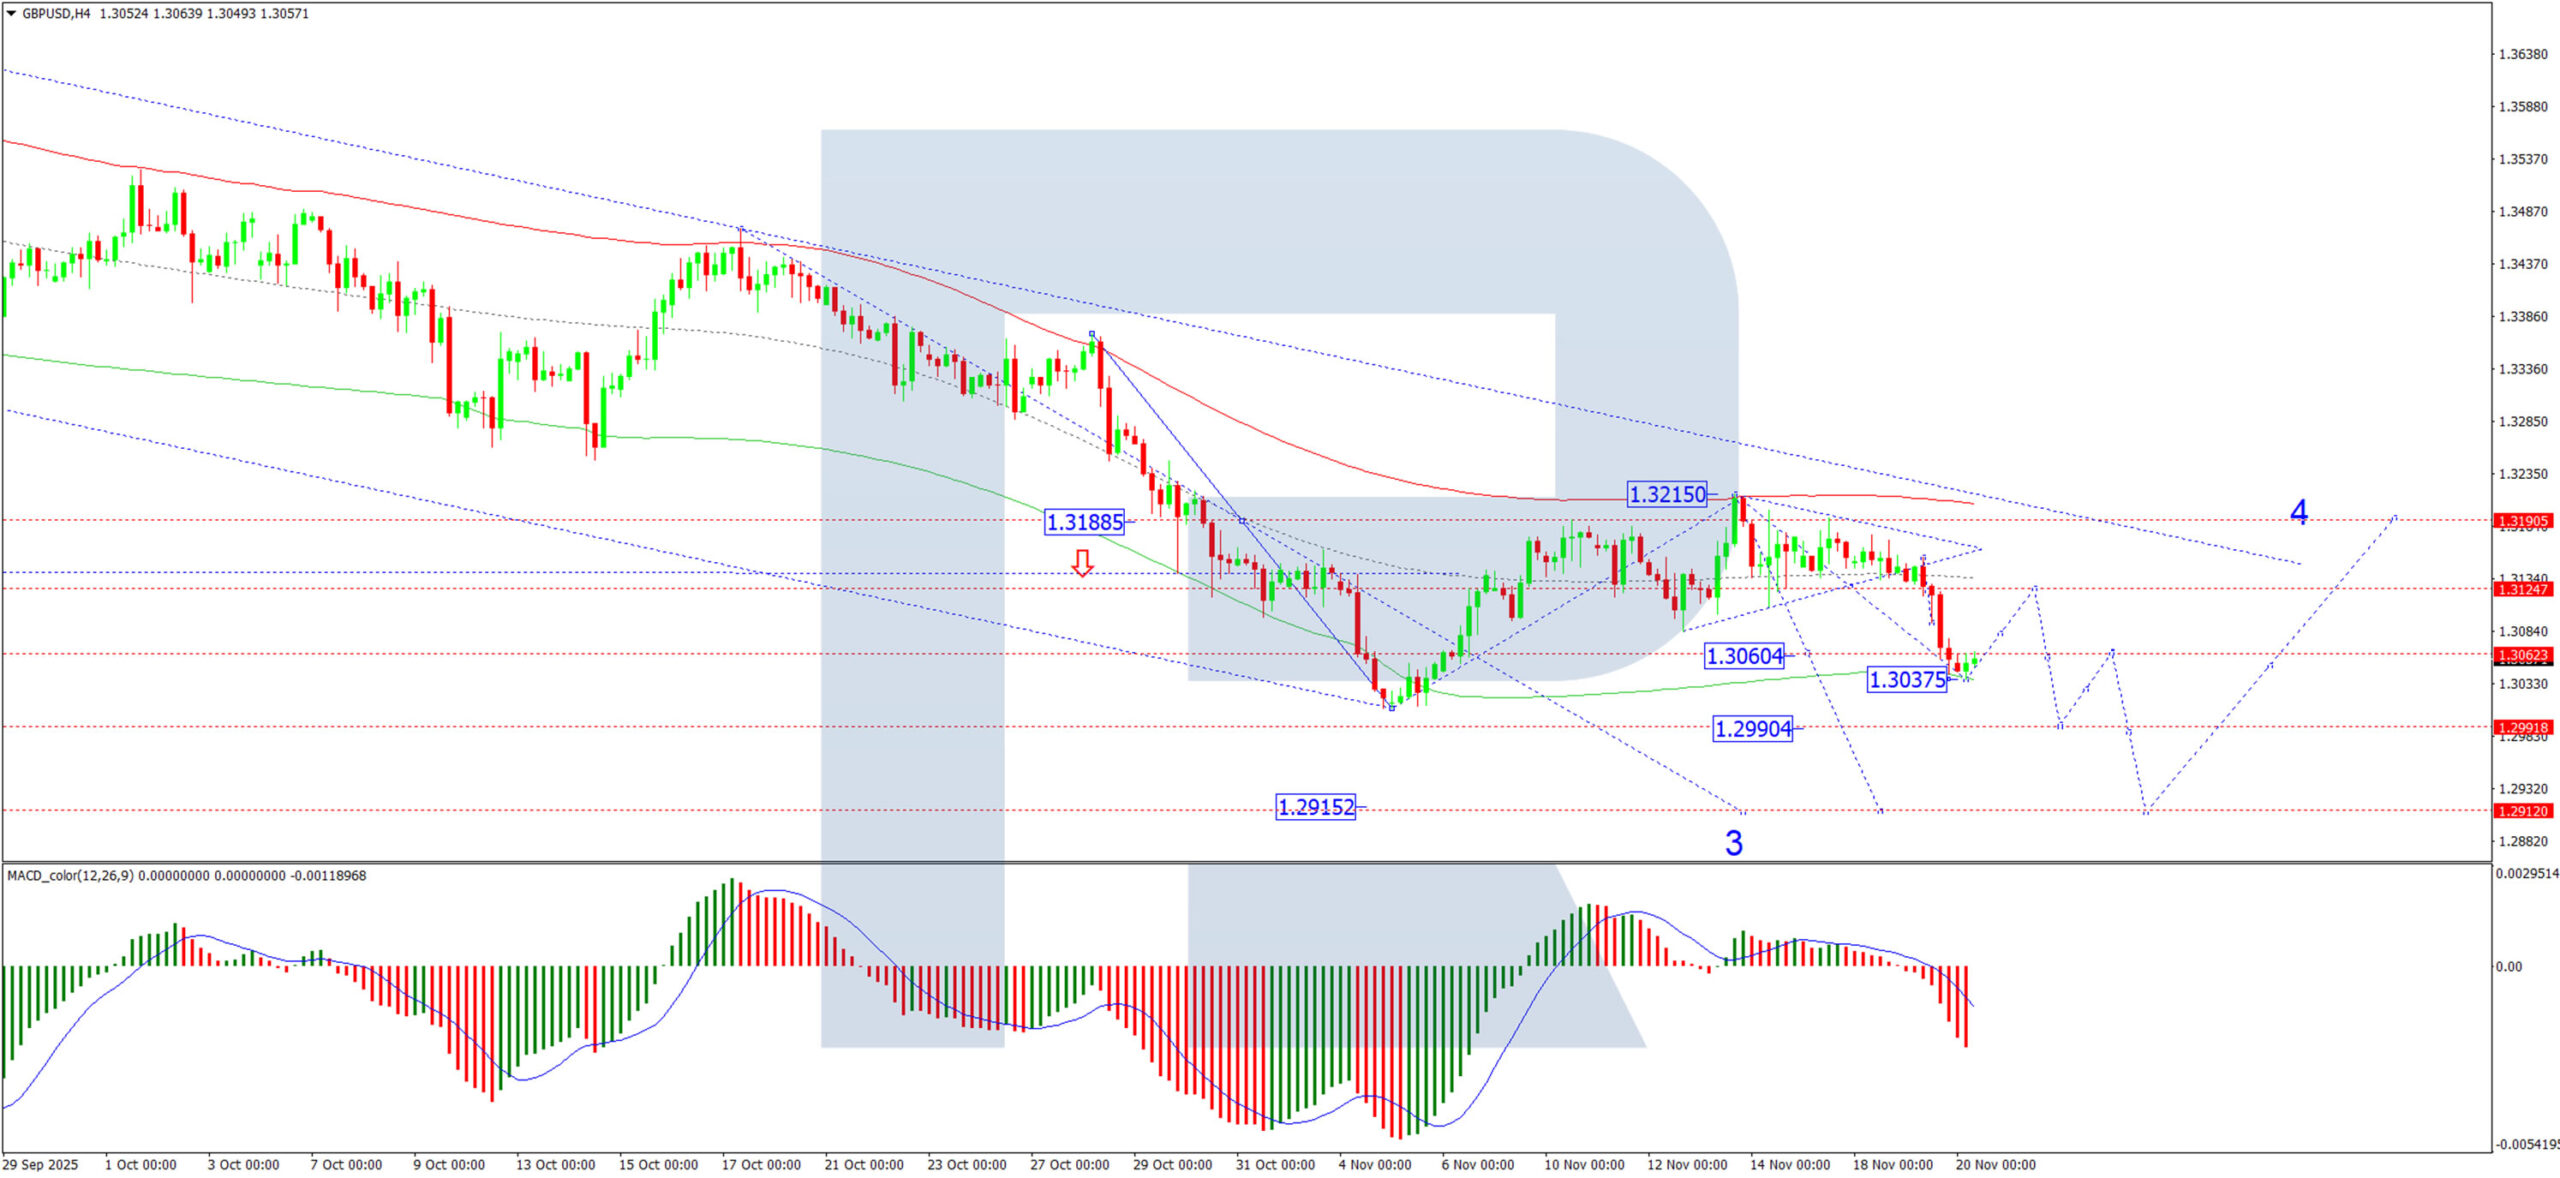
H4 Chart:
On the H4 chart, GBP/USD has completed a downward wave to 1.3037. We now anticipate a technical correction towards at least 1.3080. Following this pullback, the primary downtrend is expected to resume, driving the pair towards 1.2990, with a longer-term prospect of extending losses to 1.2915. This bearish scenario is confirmed by the MACD indicator. Its signal line is located below zero and pointing decisively downward, indicating that selling momentum remains firmly intact.
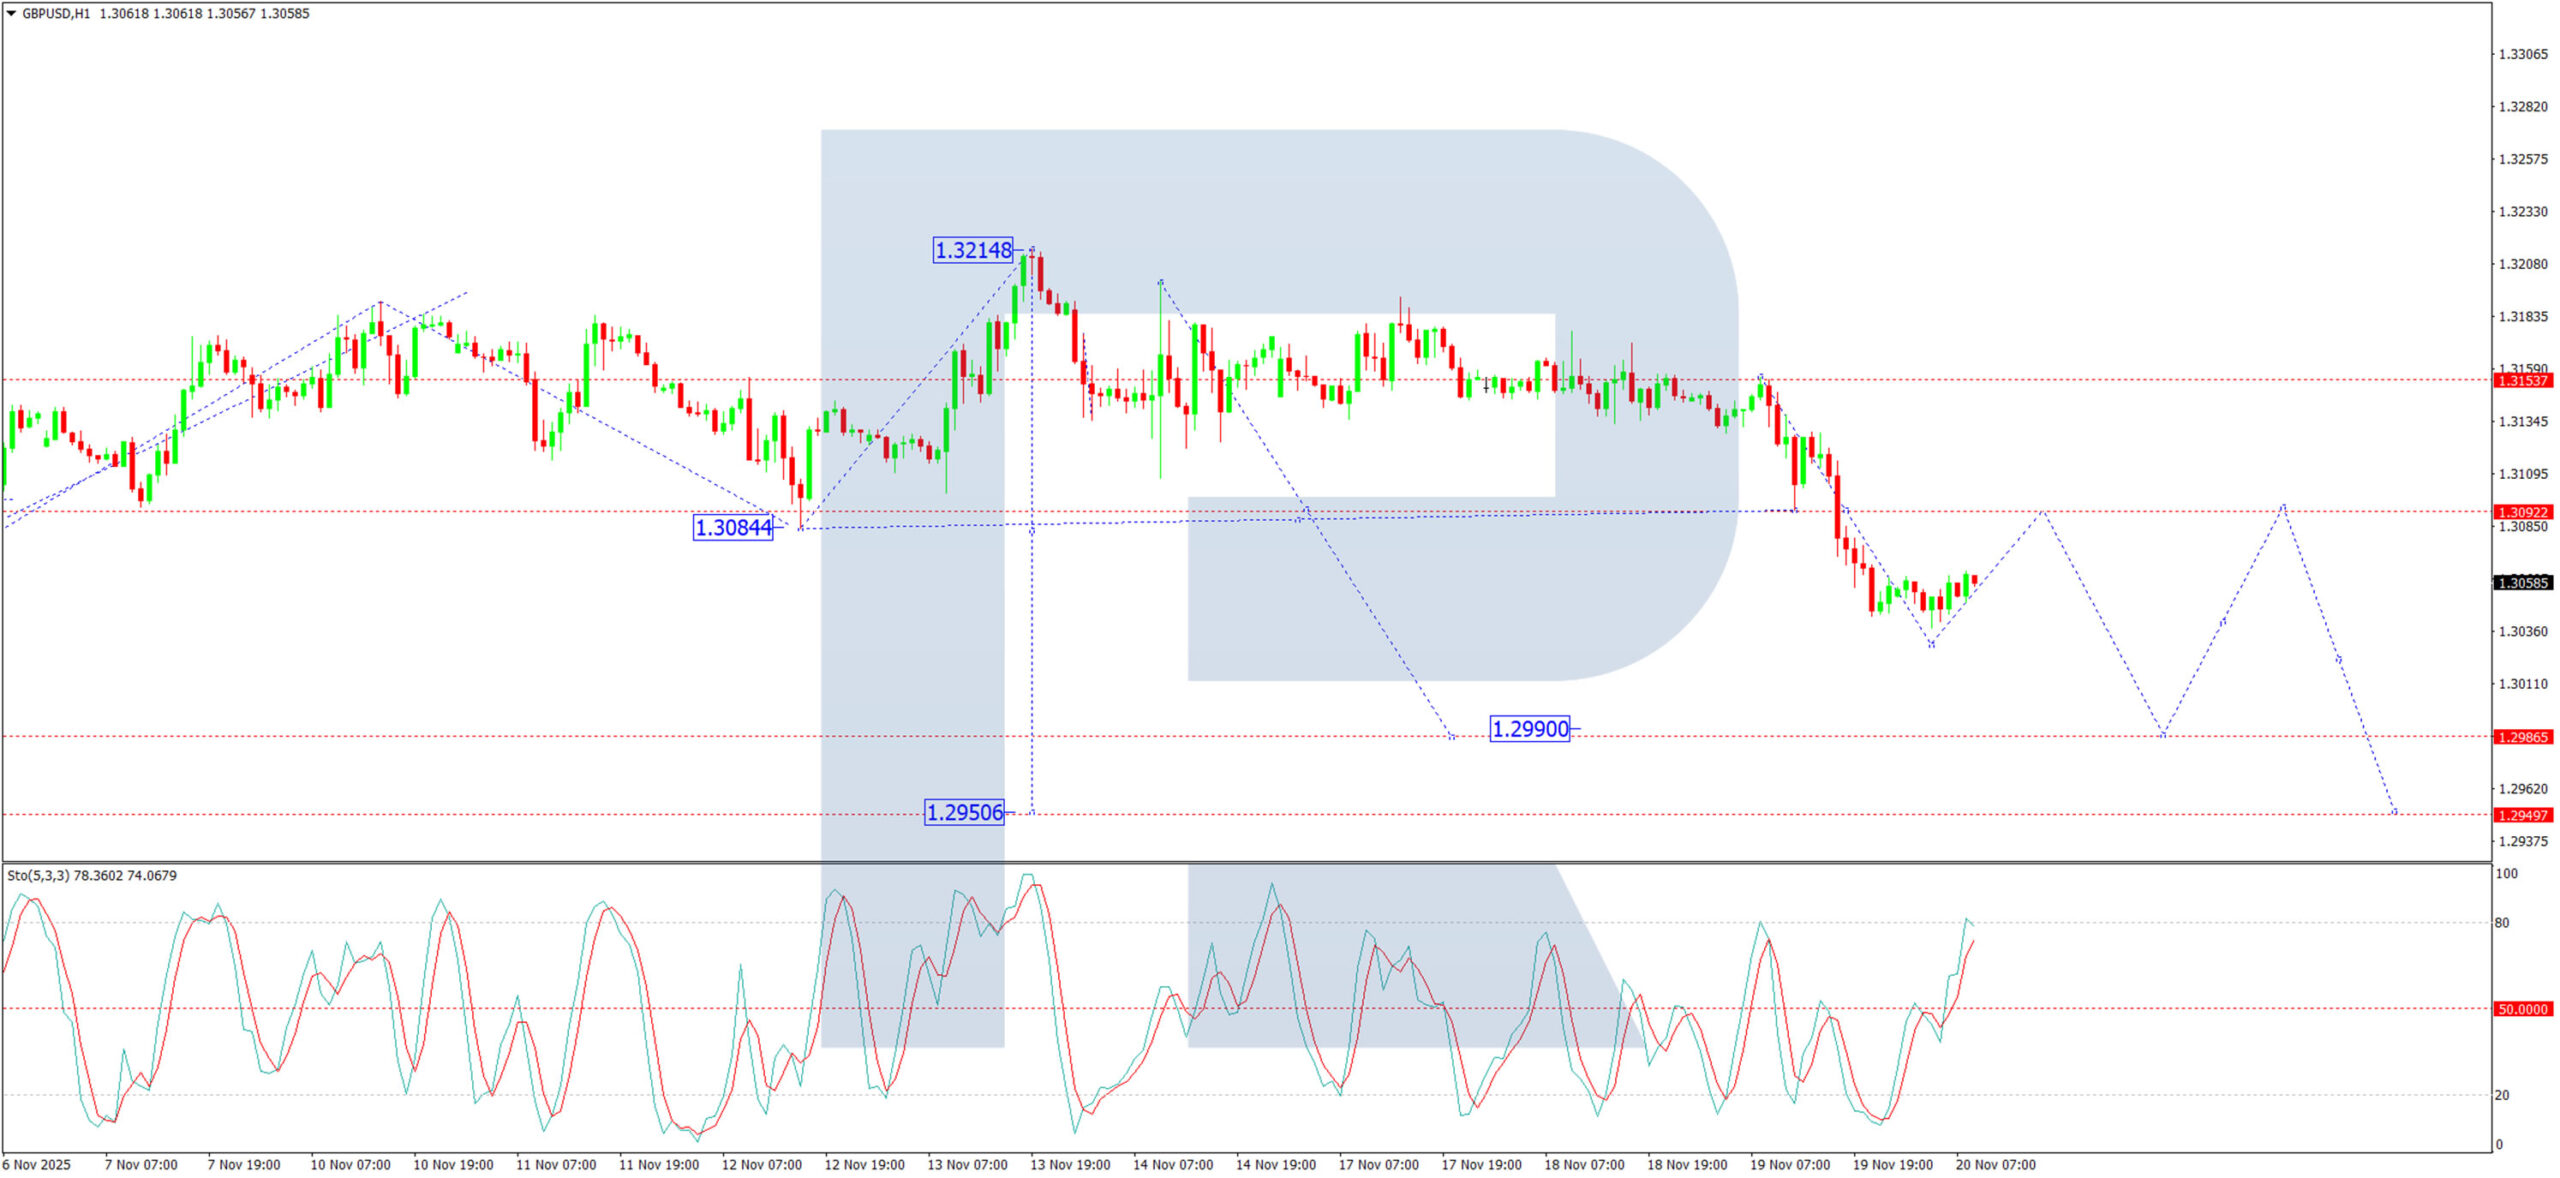
H1 Chart:
On the H1 chart, the pair broke downwards from a consolidation range around 1.3090, confirming the continuation of the bearish impulse. The immediate target for this leg is 1.3030. A corrective bounce to retest the 1.3090 level from below is likely before the next wave of selling takes the pair down to 1.2990 and potentially towards 1.2950. The Stochastic oscillator aligns with this view. Its signal line is above 50, indicating that a short-lived corrective bounce is underway before the dominant downtrend reasserts itself.
The GBP/USD is facing a perfect storm of domestic dovish shifts and external dollar strength. The softer inflation print has significantly increased the odds of a December BoE rate cut, eroding sterling's yield appeal. Technically, the path of least resistance remains firmly to the downside. While a short-term correction towards 1.3080 is likely, this should be viewed as a potential selling opportunity within the broader bearish trend, which has clear targets at 1.2990 and 1.2915.
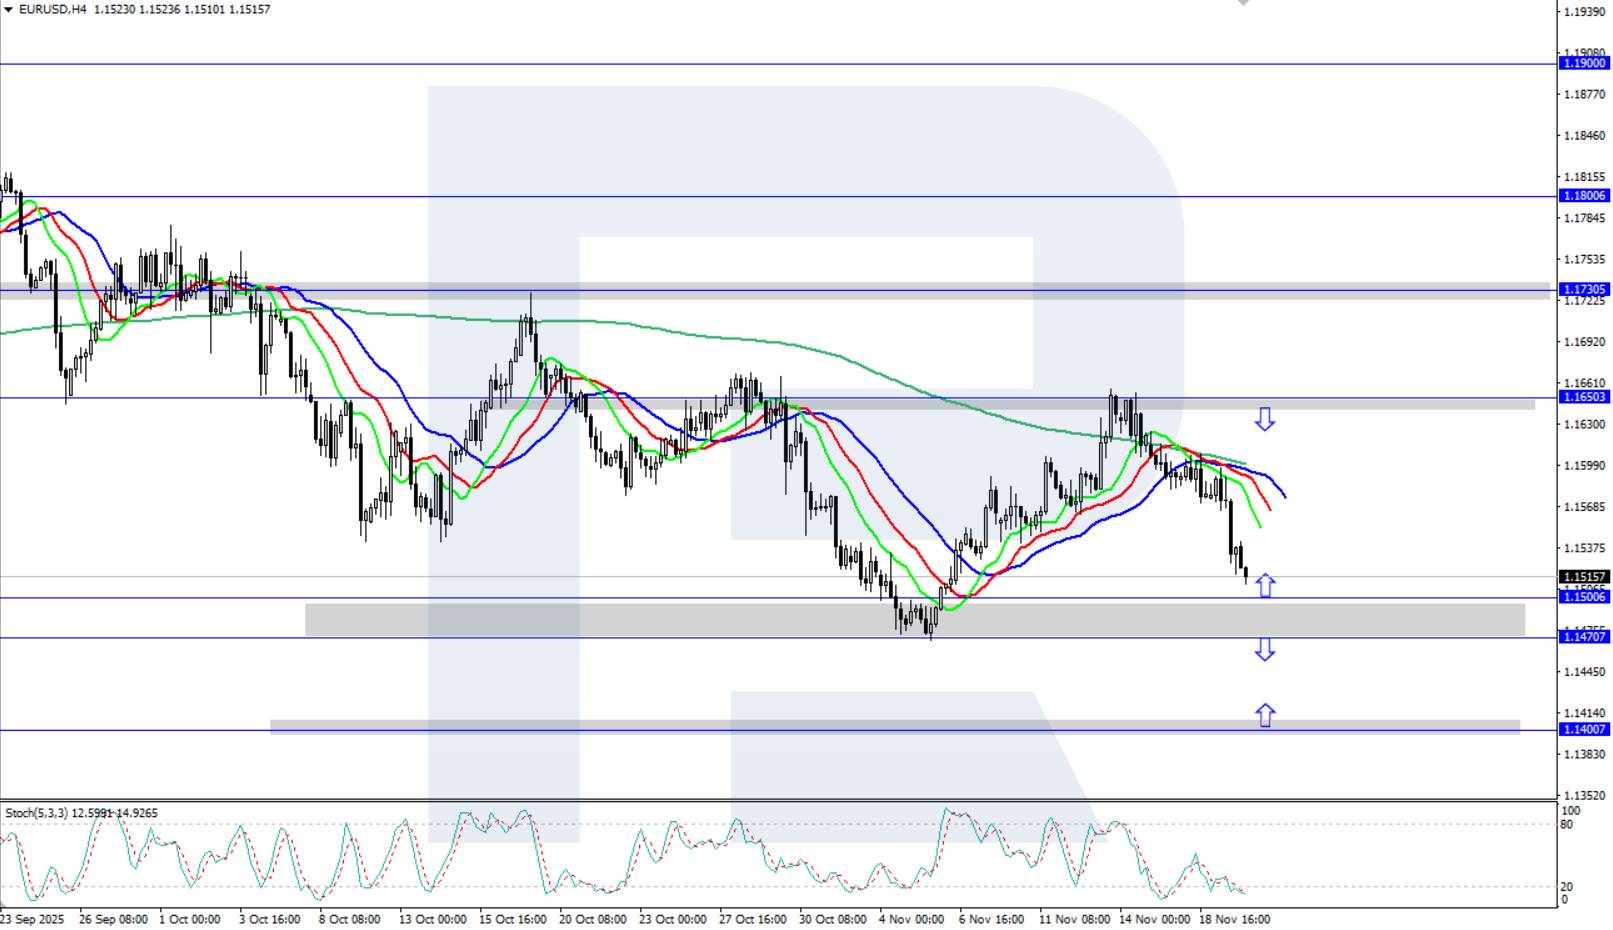
The EURUSD pair is declining, reaching the 1.1500 support level. Today, the market will focus on US labour market statistics for September.
The EURUSD rate corrected downwards to the 1.1500 support level. Today, the market's focus is on US labour market data for September. Find more details in our analysis for 20 November 2025.
The EURUSD pair is declining ahead of the key US employment report. The delayed Nonfarm Payrolls report for September will be published later today and is expected to show an increase in jobs.
The US Bureau of Labor Statistics stated that it will not release the regular October employment report because the household survey data cannot be collected retroactively, adding that the missing data will be incorporated into the postponed November report.
The latest FOMC meeting minutes showed policymakers split on whether further rate cuts are necessary, prompting traders to lower expectations for a December reduction. Markets are now pricing in roughly a 33% probability of a 25-basis-point rate cut next month, down from 50% a day earlier.
On the H4 chart, the EURUSD pair is moving lower, falling to the 1.1500 support level. The Alligator indicator is turning downwards. If the price fails to stay above 1.1500, the decline may continue.
The short-term EURUSD forecast suggests growth towards 1.1650 in the near term if buyers push the pair upwards from the 1.1500 support level. However, if sellers keep control, the decline may extend towards the 1.1400 support level.
While waiting for US statistics, XAUUSD is forming a correction and trading near 4,070 USD.
Today's XAUUSD price forecast shows that gold is forming a correction amid the broader recovery, with prices currently trading near 4,070 USD per ounce.
The XAUUSD forecast for 20 November 2025 takes into account that today, for the first time since the end of the US government shutdown, labour market data will be released.
US Nonfarm Payrolls for September are expected to rise to 53 thousand, up from 22 thousand previously. If the actual reading aligns with expectations, the market may see elevated volatility and a temporary strengthening of the US dollar. The publication of Nonfarm Payrolls almost always triggers turbulence in financial markets and can support the dollar or, on the contrary, sharply weaken it.
The XAUUSD forecast for today also considers that the US unemployment rate for September may remain unchanged at 4.3%. Stability relative to the previous reading would be a neutral factor for the USD.
On the H4 chart, XAUUSD prices have formed an Inverted Hammer reversal pattern near the lower Bollinger Band. Prices are now forming an upward wave following the signal from the pattern. Since XAUUSD quotes are trading within an ascending channel, the next upside target may be 4,220 USD.
At the same time, today's technical outlook also considers an alternative scenario with a correction towards 4,025 USD before further growth.
The potential for continued upward momentum remains intact, and XAUUSD may soon head towards the next psychological level of 4,500 USD.
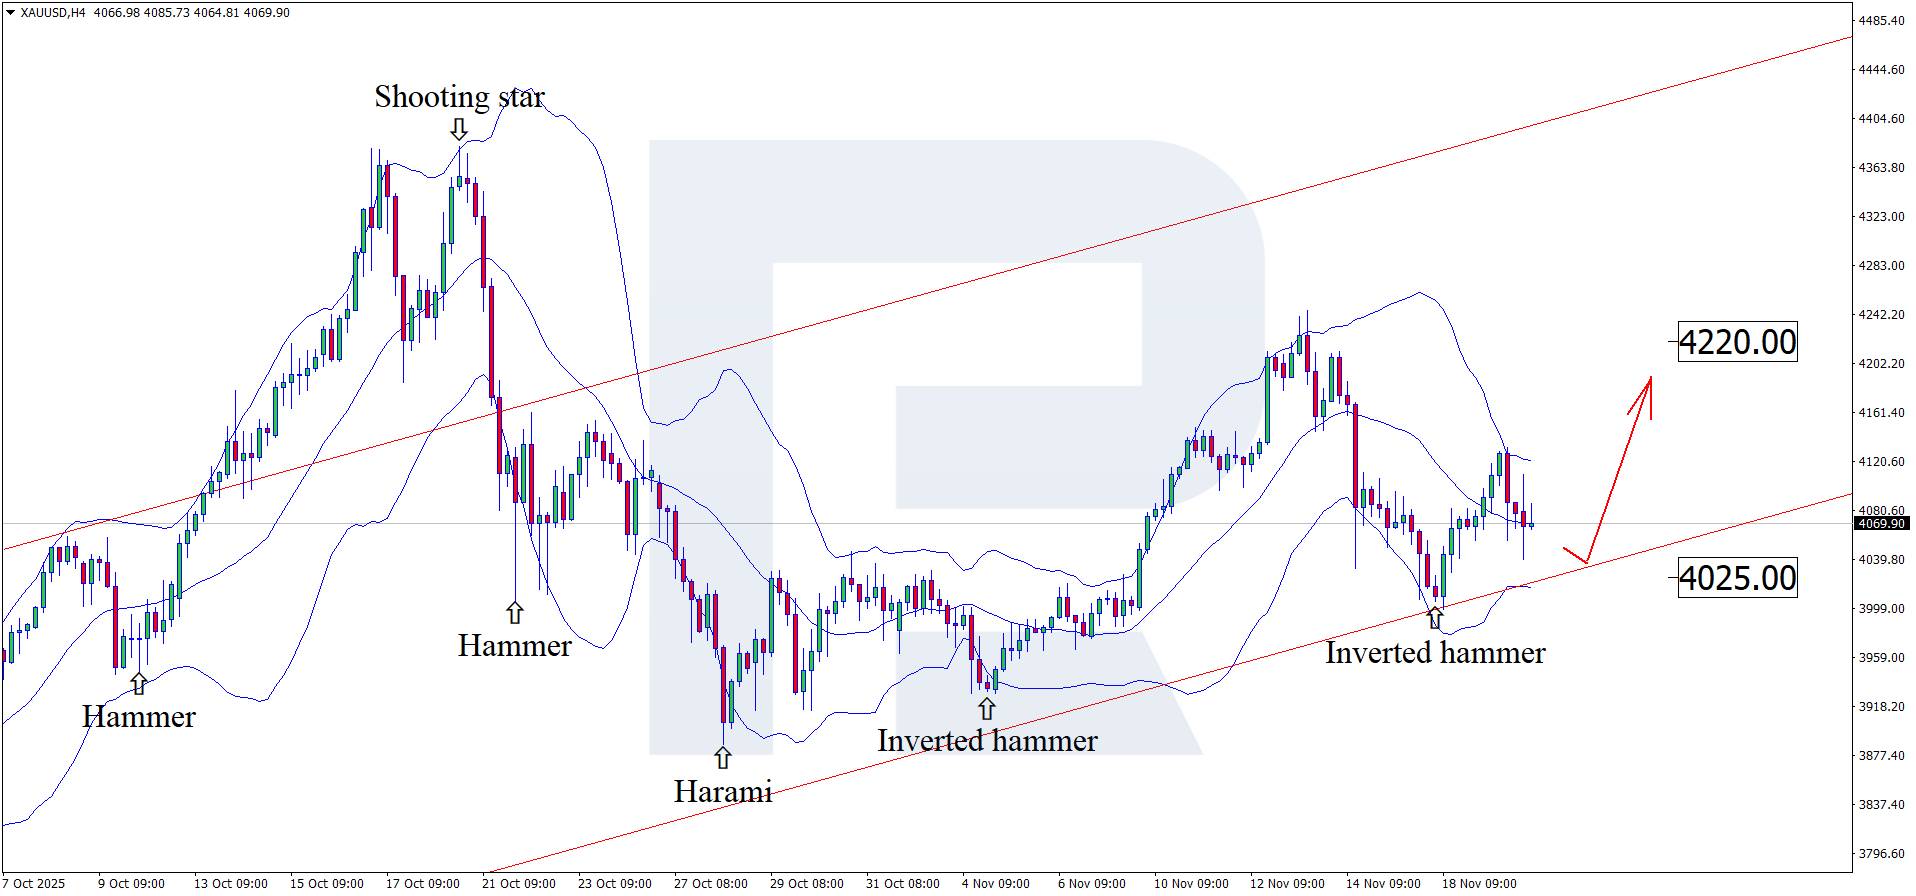
Gold continues to regain lost ground, and the release of actual US data may become a catalyst for further gains. The XAUUSD technical analysis suggests further growth once the correction is complete.
728 RM B 7/F GEE LOK IND BLDG NO 34 HUNG TO RD KWUN TONG KLN HONG KONG


White Label
Data API
Web Plug-ins
Poster Maker
Affiliate Program
The risk of loss in trading financial instruments such as stocks, FX, commodities, futures, bonds, ETFs and crypto can be substantial. You may sustain a total loss of the funds that you deposit with your broker. Therefore, you should carefully consider whether such trading is suitable for you in light of your circumstances and financial resources.
No decision to invest should be made without thoroughly conducting due diligence by yourself or consulting with your financial advisors. Our web content might not suit you since we don't know your financial conditions and investment needs. Our financial information might have latency or contain inaccuracy, so you should be fully responsible for any of your trading and investment decisions. The company will not be responsible for your capital loss.
Without getting permission from the website, you are not allowed to copy the website's graphics, texts, or trademarks. Intellectual property rights in the content or data incorporated into this website belong to its providers and exchange merchants.
Not Logged In
Log in to access more features

FastBull Membership
Not yet
Purchase


Log In
Sign Up


