Markets
News
Analysis
User
24/7
Economic Calendar
Education
Data
- Names
- Latest
- Prev


Signal Accounts for Members
All Signal Accounts
All Contests


Japan Tankan Small Manufacturing Outlook Index (Q4)A:--
F: --
P: --
Japan Tankan Large Non-Manufacturing Outlook Index (Q4)A:--
F: --
P: --
Japan Tankan Large Manufacturing Outlook Index (Q4)A:--
F: --
P: --
Japan Tankan Small Manufacturing Diffusion Index (Q4)A:--
F: --
P: --
Japan Tankan Large-Enterprise Capital Expenditure YoY (Q4)A:--
F: --
P: --
U.K. Rightmove House Price Index YoY (Dec)A:--
F: --
P: --
China, Mainland Industrial Output YoY (YTD) (Nov)A:--
F: --
P: --
China, Mainland Urban Area Unemployment Rate (Nov)A:--
F: --
P: --
Saudi Arabia CPI YoY (Nov)A:--
F: --
P: --
Euro Zone Industrial Output YoY (Oct)A:--
F: --
P: --
Euro Zone Industrial Output MoM (Oct)A:--
F: --
P: --
Canada Existing Home Sales MoM (Nov)A:--
F: --
P: --
Canada National Economic Confidence IndexA:--
F: --
P: --
Canada New Housing Starts (Nov)A:--
F: --
U.S. NY Fed Manufacturing Employment Index (Dec)A:--
F: --
P: --
U.S. NY Fed Manufacturing Index (Dec)A:--
F: --
P: --
Canada Core CPI YoY (Nov)A:--
F: --
P: --
Canada Manufacturing Unfilled Orders MoM (Oct)A:--
F: --
P: --
U.S. NY Fed Manufacturing Prices Received Index (Dec)A:--
F: --
P: --
U.S. NY Fed Manufacturing New Orders Index (Dec)A:--
F: --
P: --
Canada Manufacturing New Orders MoM (Oct)A:--
F: --
P: --
Canada Core CPI MoM (Nov)A:--
F: --
P: --
Canada Trimmed CPI YoY (SA) (Nov)A:--
F: --
P: --
Canada Manufacturing Inventory MoM (Oct)A:--
F: --
P: --
Canada CPI YoY (Nov)A:--
F: --
P: --
Canada CPI MoM (Nov)A:--
F: --
P: --
Canada CPI YoY (SA) (Nov)A:--
F: --
P: --
Canada Core CPI MoM (SA) (Nov)A:--
F: --
P: --
Canada CPI MoM (SA) (Nov)A:--
F: --
P: --
Federal Reserve Board Governor Milan delivered a speech
U.S. NAHB Housing Market Index (Dec)A:--
F: --
P: --
Australia Composite PMI Prelim (Dec)--
F: --
P: --
Australia Services PMI Prelim (Dec)--
F: --
P: --
Australia Manufacturing PMI Prelim (Dec)--
F: --
P: --
Japan Manufacturing PMI Prelim (SA) (Dec)--
F: --
P: --
U.K. 3-Month ILO Employment Change (Oct)--
F: --
P: --
U.K. Unemployment Claimant Count (Nov)--
F: --
P: --
U.K. Unemployment Rate (Nov)--
F: --
P: --
U.K. 3-Month ILO Unemployment Rate (Oct)--
F: --
P: --
U.K. Average Weekly Earnings (3-Month Average, Including Bonuses) YoY (Oct)--
F: --
P: --
U.K. Average Weekly Earnings (3-Month Average, Excluding Bonuses) YoY (Oct)--
F: --
P: --
France Services PMI Prelim (Dec)--
F: --
P: --
France Composite PMI Prelim (SA) (Dec)--
F: --
P: --
France Manufacturing PMI Prelim (Dec)--
F: --
P: --
Germany Services PMI Prelim (SA) (Dec)--
F: --
P: --
Germany Manufacturing PMI Prelim (SA) (Dec)--
F: --
P: --
Germany Composite PMI Prelim (SA) (Dec)--
F: --
P: --
Euro Zone Composite PMI Prelim (SA) (Dec)--
F: --
P: --
Euro Zone Services PMI Prelim (SA) (Dec)--
F: --
P: --
Euro Zone Manufacturing PMI Prelim (SA) (Dec)--
F: --
P: --
U.K. Services PMI Prelim (Dec)--
F: --
P: --
U.K. Manufacturing PMI Prelim (Dec)--
F: --
P: --
U.K. Composite PMI Prelim (Dec)--
F: --
P: --
Euro Zone ZEW Economic Sentiment Index (Dec)--
F: --
P: --
Germany ZEW Current Conditions Index (Dec)--
F: --
P: --
Germany ZEW Economic Sentiment Index (Dec)--
F: --
P: --
Euro Zone Trade Balance (Not SA) (Oct)--
F: --
P: --
Euro Zone ZEW Current Conditions Index (Dec)--
F: --
P: --
Euro Zone Trade Balance (SA) (Oct)--
F: --
P: --
Euro Zone Total Reserve Assets (Nov)--
F: --
P: --
U.K. Inflation Rate Expectations--
F: --
P: --


No matching data
Latest Views
Latest Views
Trending Topics
Top Columnists
Latest Update
White Label
Data API
Web Plug-ins
Affiliate Program
View All

No data
The USD/JPY pair climbed to 147.67 on Monday as the Japanese yen underwent a correction following Friday’s volatile trading session, with investors closely monitoring macroeconomic developments.
Market focus remains on shifting US Federal Reserve policy expectations after the release of softer labour market data. Although Friday’s report bolstered predictions of a rate cut, Fed officials have maintained a cautious tone, citing persistent inflation risks. Proposed large-scale tariffs from US President Donald Trump have further amplified these concerns.
Against this backdrop, the US dollar has partially regained strength, exerting downward pressure on the yen.
Investors are now awaiting the release of the Bank of Japan (BoJ) meeting minutes, hoping for clues on the timing of a potential rate hike. Last week, the Japanese central bank left interest rates unchanged but raised its inflation forecast and highlighted growing uncertainty due to global trade risks.
Overall, the outlook for the JPY remains subdued. The BoJ has ample room to delay rate hikes, justifying its stance with ongoing caution.
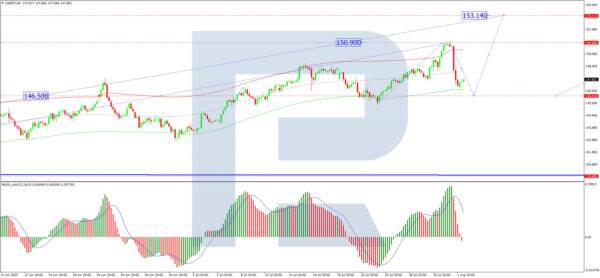
H4 Chart:
On the H4 chart, USD/JPY completed an upward wave to 150.90 before entering a correction phase. A further decline towards 146.52 is anticipated today. Once this level is reached, the pair may initiate a new growth wave, potentially targeting 151.00, with a longer-term prospect of extending the trend to 153.10. This scenario is supported by the MACD indicator, where the signal line remains above zero but is trending sharply downward.
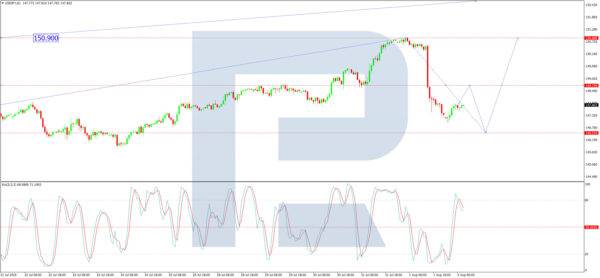
H1 Chart:
On the H1 chart, USD/JPY is forming a corrective structure towards 146.52. A temporary rebound to 148.70 (testing from below) is expected today, followed by a possible resumption of the correction to 146.52. Once this correction concludes, a fresh upward wave towards 151.00 could materialise. The Stochastic oscillator validates this outlook, with its signal line positioned above 50 and pointing upwards.

The yen remains under pressure amid shifting Fed expectations and cautious BoJ signals. Technically, USD/JPY is poised for further correction before potentially resuming its uptrend.
The USDCAD rate reversed downwards and consolidated below 1.3800 following the release of weak US Nonfarm Payrolls data on Friday.
USDCAD forecast: key trading points
The Canadian dollar strengthened after the release of US employment data. The July Nonfarm Payrolls report disappointed the market as only 73 thousand jobs were created, and previous months’ data were significantly revised downwards, worsening the outlook for US economic growth.At the same time, the Canadian economy showed some resilience: a 0.1% GDP contraction in May was followed by a 0.1% rebound in June, alongside a 0.7% increase in manufacturing output. This supported the Bank of Canada's decision to hold its key interest rate steady at 2.75%, which contrasts with the Federal Reserve's dovish stance.
On the H4 chart, the USDCAD pair is reversing down from the local daily high of 1.3880. The Alligator indicator is attempting to turn downwards, indicating a high probability of a continued downward movement.The short-term USDCAD forecast suggests a further decline if the bears keep the price below 1.3800. However, if the bulls regain control and push the pair back above 1.3800, growth towards the daily high of 1.3880 may follow.

The USDCAD pair reversed lower and dropped below 1.3800, as the US dollar came under pressure following the release of weak Nonfarm Payrolls data.
Key Points:
Bitcoin is trading at $114,418.76 after falling 3.84% in the past seven days, reflecting growing short-term pressure.
However, the market continues to show resilience as long-term holders maintain high unrealized profits, based on CryptoQuant’s cohort data.
The net unrealized profit/loss (NUPL) for long-term holders remains elevated, supporting an ongoing bullish macro trend.
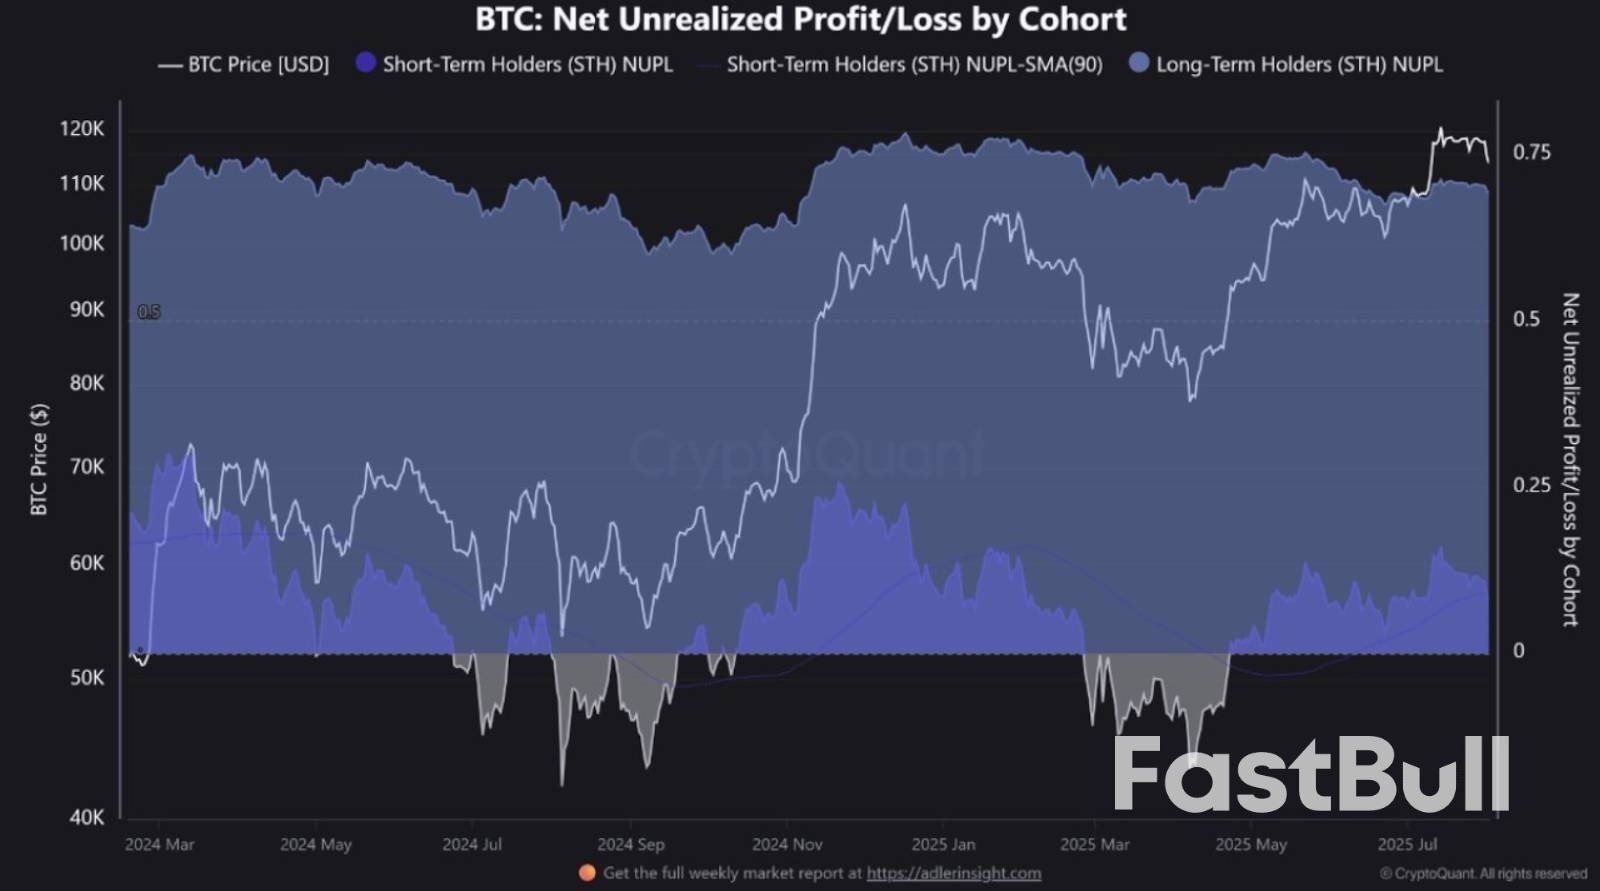
BTC Net Unrealized Profit/Loss by Chort : Source : CryptoQuantApparent demand has remained positive, with over 160,000 BTC added in the past 30 days, based on CryptoQuant metrics.
This consistent accumulation has aligned with Bitcoin’s price recovery since late May, showing demand strength amid volatility.
The demand from accumulator addresses has reached its highest point in months, nearing 320,000 BTC on a 30-day rolling sum.
Sell-side liquidity has continued to decline sharply, with total BTC held across exchanges and GBTC falling under 150,000.
This contraction in liquid supply reduces available Bitcoin for selling, which often helps support long-term price appreciation.
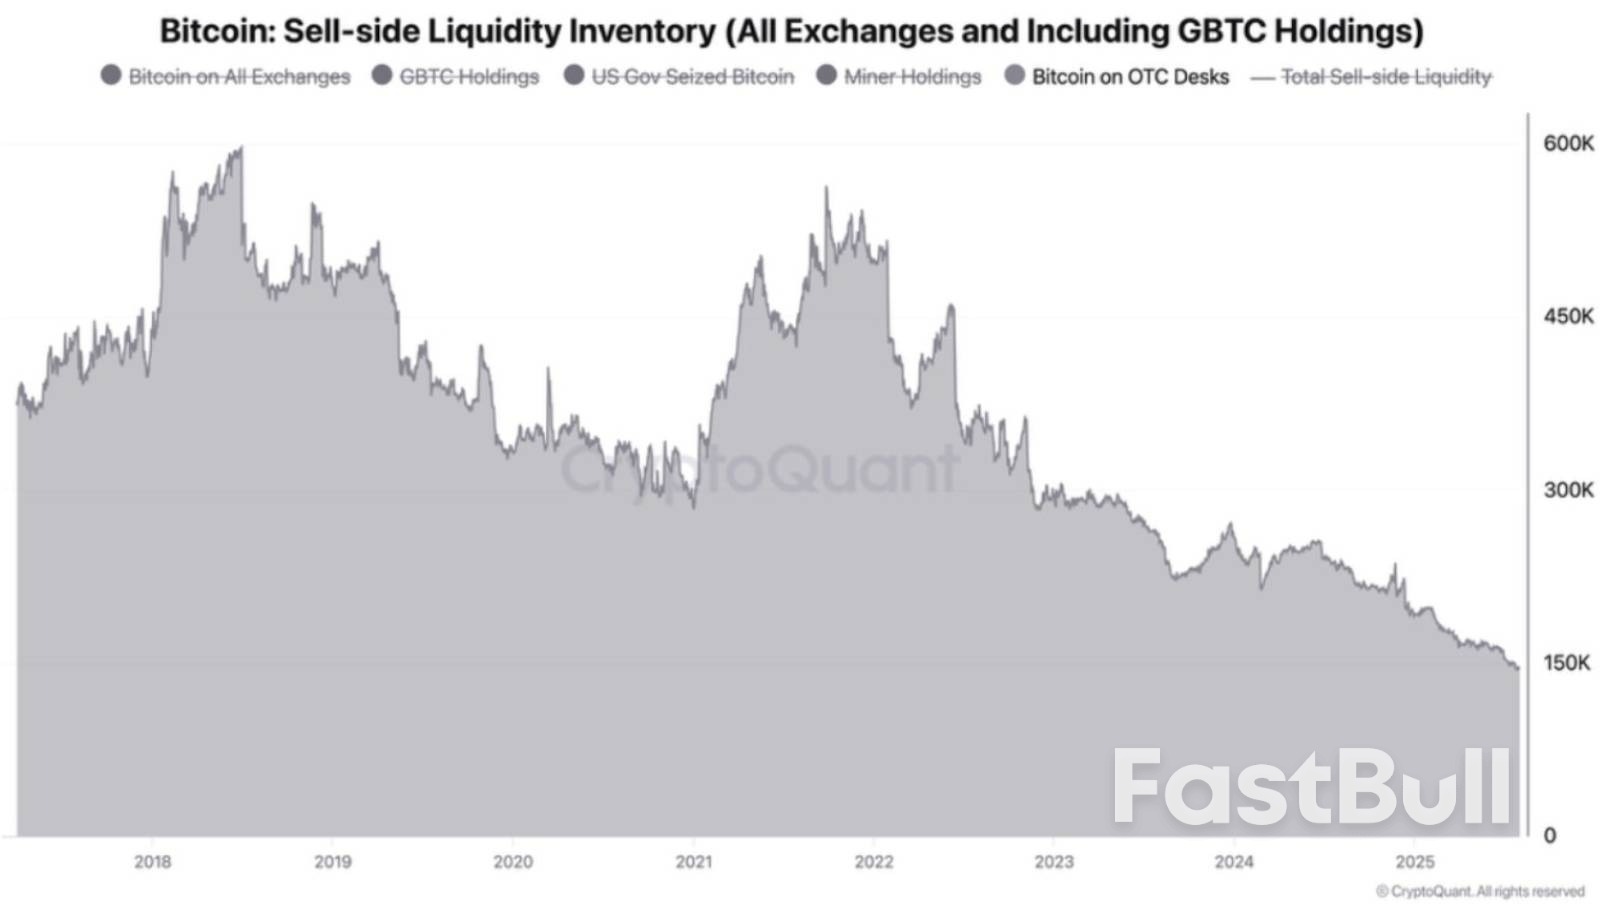
Bitcoin sell-side liquidity inventory : Source : CryptoQuantCryptoQuant data confirms sell-side liquidity is at its lowest since 2018, reinforcing a long-term supply crunch scenario.
Binance Futures data shows 60.65% of accounts are long, with a long/short ratio of 1.54, suggesting bullish trader bias.

This trend continues despite a 3.57% drop in Bitcoin’s price since August 1, highlighting strong conviction among leveraged traders.
Bitfinex also reports a 20% increase in long positions during this decline, supporting ongoing accumulation behavior.
Meanwhile, short-term holders are realizing slight profit declines, as seen in the recent dip in STH-NUPL values.
This aligns with increased volatility and minor corrections driven by fast-moving positions, while long-term trends remain intact.
Despite short-term uncertainty, structural indicators continue to suggest long-term strength backed by demand and declining liquidity.
The European Union is expecting US President Donald Trump to announce executive actions this week to formalize the bloc’s lower tariffs for cars and grant exemptions from levies for some industrial goods such as aviation parts, according to people familiar with the matter.
The two sides are also anticipated to publish a joint statement outlining the political commitments agreed by Trump and European Commission President Ursula von der Leyen last month, said the people, who spoke on condition of anonymity to discuss private deliberations. The legal form the actions would take is up to the US, the people added.
Under the terms agreed with Washington, the 27-nation bloc faces a 15% US tariff on most of its exports. That rate would also apply to cars rather than the current 25% level, as well as to any future sectoral measures targeting pharmaceuticals and semiconductors, officials on both sides have previously said.
An executive order released by the White House last week confirmed that the universal levy would apply to the EU as a ceiling, while most other trading partners will see their baseline rate added on to existing so-called most-favored-nation tariffs.
However, the order only covered so-called reciprocal rates and didn’t spell out any exemptions, nor how Trump’s sectoral measures would apply to trading partners. In addition to a universal levy, the US president has imposed 25% tariffs on cars and car parts and double that rate on steel and aluminum. He has also threatened to target pharmaceuticals and semiconductors in the near future.
Officials expect only a limited number of goods, including some generic medicines and aviation, to be granted a lower rate than the 15% baseline this week. The two sides will continue to negotiate exemptions for other goods such as wine and spirits as well as other items that could benefit from zero-for-zero tariff arrangements, Bloomberg previously reported.
The EU is also pushing for an agreement that would allow a certain volume of steel and aluminum to be exported to the US at a lower rate than the 50% levy currently imposed on the metals. Those negotiations are taking place alongside discussions aimed at protecting supply chains from overcapacity.
Any sign of the US not holding up its side of agreed political commitments would see renewed calls from EU member states to respond, some of the people said. The bloc has prepared countermeasures covering nearly €100 billion ($116 billion) worth of goods that could be deployed automatically if needed.
White Label
Data API
Web Plug-ins
Poster Maker
Affiliate Program
The risk of loss in trading financial instruments such as stocks, FX, commodities, futures, bonds, ETFs and crypto can be substantial. You may sustain a total loss of the funds that you deposit with your broker. Therefore, you should carefully consider whether such trading is suitable for you in light of your circumstances and financial resources.
No decision to invest should be made without thoroughly conducting due diligence by yourself or consulting with your financial advisors. Our web content might not suit you since we don't know your financial conditions and investment needs. Our financial information might have latency or contain inaccuracy, so you should be fully responsible for any of your trading and investment decisions. The company will not be responsible for your capital loss.
Without getting permission from the website, you are not allowed to copy the website's graphics, texts, or trademarks. Intellectual property rights in the content or data incorporated into this website belong to its providers and exchange merchants.
Not Logged In
Log in to access more features

FastBull Membership
Not yet
Purchase
Log In
Sign Up