

Markets
News
Analysis
User
24/7
Economic Calendar
Education
Data
- Names
- Latest
- Prev


Signal Accounts for Members
All Signal Accounts
All Contests
 U.K. Trade Balance Non-EU (SA) (Oct)
A:--
F: --
P: --
U.K. Trade Balance (Oct)A:--
F: --
P: --
U.K. Services Index MoMA:--
F: --
P: --
U.K. Construction Output MoM (SA) (Oct)A:--
F: --
P: --
U.K. Industrial Output YoY (Oct)A:--
F: --
P: --
U.K. Trade Balance (SA) (Oct)A:--
F: --
P: --
U.K. Trade Balance EU (SA) (Oct)A:--
F: --
P: --
U.K. Manufacturing Output YoY (Oct)A:--
F: --
P: --
U.K. GDP MoM (Oct)A:--
F: --
P: --
U.K. GDP YoY (SA) (Oct)A:--
F: --
P: --
U.K. Industrial Output MoM (Oct)A:--
F: --
P: --
U.K. Construction Output YoY (Oct)A:--
F: --
P: --
 France HICP Final MoM (Nov)
A:--
F: --
P: --
 China, Mainland Outstanding Loans Growth YoY (Nov)
A:--
F: --
P: --
China, Mainland M2 Money Supply YoY (Nov)A:--
F: --
P: --
China, Mainland M0 Money Supply YoY (Nov)A:--
F: --
P: --
China, Mainland M1 Money Supply YoY (Nov)A:--
F: --
P: --
 India CPI YoY (Nov)
A:--
F: --
P: --
India Deposit Gowth YoYA:--
F: --
P: --
 Brazil Services Growth YoY (Oct)
A:--
F: --
P: --
 Mexico Industrial Output YoY (Oct)
A:--
F: --
P: --
 Russia Trade Balance (Oct)
A:--
F: --
P: --
 Philadelphia Fed President Henry Paulson delivers a speech
 Canada Building Permits MoM (SA) (Oct)
A:--
F: --
P: --
Canada Wholesale Sales YoY (Oct)A:--
F: --
P: --
Canada Wholesale Inventory MoM (Oct)A:--
F: --
P: --
Canada Wholesale Inventory YoY (Oct)A:--
F: --
P: --
Canada Wholesale Sales MoM (SA) (Oct)A:--
F: --
P: --
 Germany Current Account (Not SA) (Oct)
A:--
F: --
P: --
U.S. Weekly Total Rig CountA:--
F: --
P: --
U.S. Weekly Total Oil Rig CountA:--
F: --
P: --
 Japan Tankan Large Non-Manufacturing Diffusion Index (Q4)
--
F: --
P: --
Japan Tankan Small Manufacturing Outlook Index (Q4)--
F: --
P: --
Japan Tankan Large Non-Manufacturing Outlook Index (Q4)--
F: --
P: --
Japan Tankan Large Manufacturing Outlook Index (Q4)--
F: --
P: --
Japan Tankan Small Manufacturing Diffusion Index (Q4)--
F: --
P: --
Japan Tankan Large Manufacturing Diffusion Index (Q4)--
F: --
P: --
Japan Tankan Large-Enterprise Capital Expenditure YoY (Q4)--
F: --
P: --
U.K. Rightmove House Price Index YoY (Dec)--
F: --
P: --
China, Mainland Industrial Output YoY (YTD) (Nov)--
F: --
P: --
China, Mainland Urban Area Unemployment Rate (Nov)--
F: --
P: --
 Saudi Arabia CPI YoY (Nov)
--
F: --
P: --
 Euro Zone Industrial Output YoY (Oct)
--
F: --
P: --
Euro Zone Industrial Output MoM (Oct)--
F: --
P: --
Canada Existing Home Sales MoM (Nov)--
F: --
P: --
Euro Zone Total Reserve Assets (Nov)--
F: --
P: --
U.K. Inflation Rate Expectations--
F: --
P: --
Canada National Economic Confidence Index--
F: --
P: --
Canada New Housing Starts (Nov)--
F: --
P: --
U.S. NY Fed Manufacturing Employment Index (Dec)--
F: --
P: --
U.S. NY Fed Manufacturing Index (Dec)--
F: --
P: --
Canada Core CPI YoY (Nov)--
F: --
P: --
Canada Manufacturing Unfilled Orders MoM (Oct)--
F: --
P: --
Canada Manufacturing New Orders MoM (Oct)--
F: --
P: --
Canada Core CPI MoM (Nov)--
F: --
P: --
Canada Manufacturing Inventory MoM (Oct)--
F: --
P: --
Canada CPI YoY (Nov)--
F: --
P: --
Canada CPI MoM (Nov)--
F: --
P: --
Canada CPI YoY (SA) (Nov)--
F: --
P: --
Canada Core CPI MoM (SA) (Nov)--
F: --
P: --

No matching data
Latest Views
Latest Views
Trending Topics
Top Columnists
Latest Update
White Label
Data API
Web Plug-ins
Affiliate Program
View All
No data
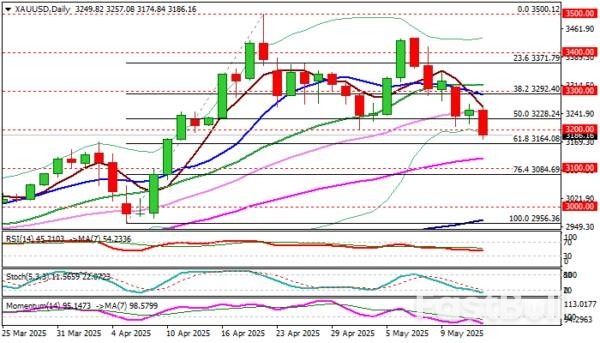
Gold price fell through key supports on Wednesday, deflated by growing optimism on US-China trade deal that cooled fears about deeper economic crisis and offset other factors that boost safe haven demand.
Gold price fell through key supports on Wednesday, deflated by growing optimism on US-China trade deal that cooled fears about deeper economic crisis and offset other factors that boost safe haven demand.
Fresh wave of risk appetite pushed gold through pivots at $3228 (50% retracement of $2956/$3500 upleg) which recently contained several attacks and $3200 (psychological/low of pullback from new record high).
Sustained break of $3200 to complete bearish failure swing pattern and generate signal of potential deeper pullback from $3500 peak.
Daily studies are weakening as 14-d momentum is heading deeper into negative territory and the price fell below 10/20/30 DMA’s which also formed bear-crosses.
However, oversold stochastic warns of possible increased headwinds that may result in hesitation at $3200 zone and keep near term price action in extended consolidation.
The price should stay under broken Fibo 50% ($3228) and extended upticks not to exceed daily highs of Tuesday / today ($3265/57 respectively) to keep bears intact.
Res: 3200; 3228; 3265; 3292.
Sup: 3164; 3126; 3100; 3084.
India and the United Kingdom officially signed a free trade agreement (FTA) on May 6, marking the culmination of over three years of negotiations that began in January 2022.
By the standards of negotiating timelines, the FTA with the U.K. has been rather swift. India’s potential FTA with the EU in particular has been languishing for almost two decades, although it has picked up momentum recently. The other vital one with the U.S. – after initial discussions in 2017 – had not been in serious contention until earlier this year.
Timing, after all, is everything. The U.K. formally exited the EU in December 2020 and understandably has since sought to establish new trade relationships to compensate for the loss of EU market access. Since then, it has struck deals with Japan, Singapore, and Vietnam and even entered the Comprehensive and Progressive Agreement for Trans-Pacific Partnership or CPTPP, a mega trade-bloc of 12 countries including Australia, Canada, and Mexico, among others.
In many ways, the FTA with India is London’s most significant trade deal since leaving the EU because India is one of the world’s fastest-growing major economies. British Prime Minister Keir Starmer acclaimed it as the U.K.’s “biggest trade deal” since Brexit, and went on to describe it as the “most ambitious” agreement in India’s history. Both assertions might even be true.
The FTA promises improved access for the U.K.’s high-value exports – automobiles, Scotch whisky, legal and financial services, not to mention the English Premier League (EPL) – to tap into India’s famed and at times overrated middle class.
Estimates of India’s middle class population have varied between 60-350 million in recent times. Even at the lower end of the range, India offers a young and digitally savvy consumer base with vast opportunities for British technology, education, and professional services.
India is projected to move from being the fifth-largest global economy to third in the next three years. By 2035, demand for imports is on course to reach 1.38 trillion pounds per year.
India, once a force to reckon with in world trade, finds itself increasingly marginalized in world markets. Colonial exploitation brought India’s share in world trade down from around 33 percent to 2 percent at the time of independence in 1947.
Happily, the country recognizes the inevitability of engaging more with the outside world to achieve its own ambition of becoming “Viksit” or developed by 2047. Alas, the “developed India” dream will remain unrealized without enhanced global engagement and trade. That is why the FTA with the U.K., while positive, marks only the beginning of a long and hard negotiating period ahead.
These negotiations will inter alia focus on how much India can resist or delay harmonization in standards customary in Anglo-Saxon countries (labor, environment, competition, intellectual property, etc.) and gain increased market access for its IT professionals and other skilled labor, always a difficult task.
For now, India will gain better (duty-free or reduced duty) access for its exports – mineral fuels, machinery, precious stones, pharmaceuticals, apparel, iron and steel, and chemicals to name a few. Significantly, the FTA also includes provisions for easing mobility for Indian professionals and students, facilitating greater access to U.K. opportunities, while at the same time addressing their ageing-related constraints.
For a trade economist, the FTA between India and the U.K. is a manifestation of the Ricardian school of thought based on comparative advantage. Two dissimilar nations with sizable differences in levels of development and per capita incomes have much to gain from each other by specializing in their chosen areas of advantage. This is not to say that countries at similar and high levels of development do not gain from trade (West European countries gain extensively from what is called intra-industry trade), but arguably the gains from an India-U.K. deal are likely to be quite significant.
Nations engage with each other via trade because it is beneficial to do so. Accordingly, the FTA has been described as ambitious and mutually beneficial, aiming to enhance trade, investment, economic growth, job creation, and innovation in both nations.
Safeguards are also in place, naturally, to prevent immediate disruptions. The much-discussed tariff reductions on goods from the U.K. such as whisky, automobiles, and agricultural products have been phased in and are subject to quotas in case there is a flood of imports. The U.K., in turn, will eliminate tariffs on Indian textiles, which is anticipated to boost labor-intensive manufacturing in India.
For the record, the total bilateral trade between India and the U.K. reached approximately 42 billion pounds by mid-2024 with India maintaining a trade surplus of about 8 billion pounds. The FTA aims to double this trade by 2030.
The U.K. ranks as the sixth-largest investor in India, with cumulative investments exceeding 38 billion pounds over the past three years in sectors such as financial services and manufacturing. India was the second-largest source of FDI in the U.K. in 2023.
While the India-U.K. FTA lays the groundwork for a more integrated economic partnership, ongoing dialogue and cooperation will be essential to reduce the divergence in standards and to fully realize the agreement’s potential benefits.
The growing importance of e-commerce, digital trade and climate change necessitates an innovative approach to trade rules that includes standards not only for finished products, but also for processes underlying their production.
For now, India has been cautious about committing to binding labor and environmental standards within the FTA, preferring non-binding “best endeavor” clauses. India is of the view that adopting “Western” labor standards and environmental protection straight away will interfere with its growth and development agenda.
The FTA also encourages the development of Mutual Recognition Agreements particularly in professional services, to facilitate the recognition of qualifications and licenses between the two countries. The FTA endorses initiatives like the U.K.-India Education and Research Initiative and promotes mutual recognition of academic qualifications to enhance student mobility and employment opportunities.
Interestingly, the University of Southampton has already begun establishing the first U.K. campus in India’s National Capital Region and has been permitted to offer three-year undergraduate degrees in India, even as the rest offer the now standard four-year ones.
By signing the FTA with the U.K., India has finally displayed conviction in the utility of trade agreements. Its periodic assertions of a desire to integrate into regional and global value chains seemed at odds with the stance it took on such agreements. Hopefully, this signals a new dawn, and agreements with the EU and the United States will follow in due course.
Individually and collectively, these agreements, however, will not deliver unless accompanied by domestic reforms to remove structural deficiencies. These are the well-known impediments such as lack of scale, labor market rigidities, logistical pains, and transactional harassment, to name a few. The U.K. FTA and the others to follow can become the preferred instruments for domestic reform, thus easing the political resistance and setting the stage for an economic upgrade.
With multilateralism in an indefinite coma, cleverly negotiated FTAs can play a similar role for the Indian economy that global markets and the WTO played in the upgradation of the Chinese economy. It is for India to squander the momentum.


Data showing temperate consumer inflation in April does not necessarily reflect the impact of rising U.S. import tariffs, with the Federal Reserve still needing more data to discern the direction of prices and the economy, Chicago Fed President Austan Goolsbee said on Wednesday.
Consumer prices rose a less-than-expected 2.3% in April, for the smallest annual increase in four years, but the headline number was held down by falling food prices, which can be volatile from month to month.
Excluding food and energy, so-called "core" inflation was 2.8%, the same as in March.
"There are moments of a lot of dust in the air," Goolsbee said on NPR's Morning Edition radio show. "We've got a bunch of noise ... We're trying to figure out the through line."
The Fed has held interest rates steady since December, and is likely to keep doing so as officials wait to see how the Trump administration's tariff increases and ongoing trade negotiations play out.
"We continue to get these numbers that at least suggest that it's going okay," said Goolsbee, a current voter on the Fed committee that sets interest rates.
"It's just, I think, not realistic to expect businesses or central banks to be jumping to conclusions about long-term things when you've got so much short-term variability. That's just a very difficult environment."

728 RM B 7/F GEE LOK IND BLDG NO 34 HUNG TO RD KWUN TONG KLN HONG KONG


White Label
Data API
Web Plug-ins
Poster Maker
Affiliate Program
The risk of loss in trading financial instruments such as stocks, FX, commodities, futures, bonds, ETFs and crypto can be substantial. You may sustain a total loss of the funds that you deposit with your broker. Therefore, you should carefully consider whether such trading is suitable for you in light of your circumstances and financial resources.
No decision to invest should be made without thoroughly conducting due diligence by yourself or consulting with your financial advisors. Our web content might not suit you since we don't know your financial conditions and investment needs. Our financial information might have latency or contain inaccuracy, so you should be fully responsible for any of your trading and investment decisions. The company will not be responsible for your capital loss.
Without getting permission from the website, you are not allowed to copy the website's graphics, texts, or trademarks. Intellectual property rights in the content or data incorporated into this website belong to its providers and exchange merchants.
Not Logged In
Log in to access more features

FastBull Membership
Not yet
Purchase


Log In
Sign Up


