• Trade
  • Markets
  • Copy
  • Contests
  • News
  • 24/7
  • Calendar
  • Q&A
  • Chats
Trending
Screeners
SYMBOL
LAST
BID
ASK
HIGH
LOW
NET CHG.
%CHG.
SPREAD
SPX
S&P 500 Index
6870.39
6870.39
6870.39
6895.79
6858.28
+13.27
+ 0.19%
--
DJI
Dow Jones Industrial Average
47954.98
47954.98
47954.98
48133.54
47871.51
+104.05
+ 0.22%
--
IXIC
NASDAQ Composite Index
23578.12
23578.12
23578.12
23680.03
23506.00
+72.99
+ 0.31%
--
USDX
US Dollar Index
98.940
99.020
98.940
98.960
98.730
-0.010
-0.01%
--
EURUSD
Euro / US Dollar
1.16476
1.16484
1.16476
1.16717
1.16341
+0.00050
+ 0.04%
--
GBPUSD
Pound Sterling / US Dollar
1.33155
1.33164
1.33155
1.33462
1.33136
-0.00157
-0.12%
--
XAUUSD
Gold / US Dollar
4211.73
4212.16
4211.73
4218.85
4190.61
+13.82
+ 0.33%
--
WTI
Light Sweet Crude Oil
59.172
59.202
59.172
60.084
59.160
-0.637
-1.07%
--

Community Accounts

Signal Accounts
--
Profit Accounts
--
Loss Accounts
--
View More

Become a signal provider

Sell trading signals to earn additional income

View More

Guide to Copy Trading

Get started with ease and confidence

View More

Signal Accounts for Members

All Signal Accounts

Best Return
  • Best Return
  • Best P/L
  • Best MDD
Past 1W
  • Past 1W
  • Past 1M
  • Past 1Y

All Contests

  • All
  • Trump Updates
  • Recommend
  • Stocks
  • Cryptocurrencies
  • Central Banks
  • Featured News
Top News Only
Share

India Foreign Ministry: New Deputy USA Trade Representative Will Visit India On Dec 10-11

Share

India Foreign Ministry: Advise Indian Nationals To Exercise Caution While Travelling To Or Transiting Through China

Share

Agrural - Brazil's 2025/26 Total Corn Output Seen At 135.3 Million Tonnes Versus 141.1 Million Tonnes In Previous Season

Share

Agrural - Brazil's 2025/26 Soybean Planting Hits 94% Of Expected Area As Of Last Thursday

Share

SEBI: Modalities For Migration To Ai Only Schemes And Relaxations To Large Value Funds For Accredited Investors

Share

All 6 Bank Of Israel Monetary Policy Committee Members Voted To Lower Benchmark Interest Rate 25 Bps To 4.25% On Nov 24

Share

India Government: Cancellations Are On Account Of Developer Delays And Not Due To Transmission Side Delays

Share

Fitch: We See Moderation Of Export Performance In China In 2026

Share

India Government: Revokes Grid Access Permissions For Renewable Energy Projects

Share

Stats Office - Tanzania Inflation At 3.4% Year-On-Year In November

Share

Temasek CEO Dilhan Pillay: We Are Taking A Conservative Stance On Allocating Capital

Share

Brazil Economists See Brazilian Real At 5.40 Per Dollar By Year-End 2025 Versus 5.40 In Previous Estimate - Central Bank Poll

Share

Brazil Economists See Year-End 2026 Interest Rate Selic At 12.25% Versus 12.00% In Previous Estimate - Central Bank Poll

Share

Brazil Economists See Year-End 2025 Interest Rate Selic At 15.00% Versus 15.00% In Previous Estimate - Central Bank Poll

Share

EU Commission Says Meta Has Committed To Give EU Users Choice On Personalised Ads

Share

Sources Revealed That The Bank Of England Has Invited Employees To Voluntarily Apply For Layoffs

Share

The Bank Of England Plans To Cut Staff Due To Budget Pressures

Share

Traders Believe There Is Less Than A 10% Chance That The European Central Bank Will Cut Interest Rates By 25 Basis Points In 2026

Share

Egypt, European Bank For Reconstruction And Development Sign $100 Million Financing Agreement

Share

Israel Budget Deficit 4.5% Of GDP In November Over Past 12 Months Versus 4.9% Deficit In October

TIME
ACT
FCST
PREV
France Industrial Output MoM (SA) (Oct)

A:--

F: --

P: --
France Trade Balance (SA) (Oct)

A:--

F: --

P: --
Euro Zone Employment YoY (SA) (Q3)

A:--

F: --

P: --
Canada Part-Time Employment (SA) (Nov)

A:--

F: --

P: --

Canada Unemployment Rate (SA) (Nov)

A:--

F: --

P: --

Canada Full-time Employment (SA) (Nov)

A:--

F: --

P: --

Canada Labor Force Participation Rate (SA) (Nov)

A:--

F: --

P: --

Canada Employment (SA) (Nov)

A:--

F: --

P: --

U.S. PCE Price Index MoM (Sept)

A:--

F: --

P: --

U.S. Personal Income MoM (Sept)

A:--

F: --

P: --

U.S. Core PCE Price Index MoM (Sept)

A:--

F: --

P: --

U.S. PCE Price Index YoY (SA) (Sept)

A:--

F: --

P: --

U.S. Core PCE Price Index YoY (Sept)

A:--

F: --

P: --

U.S. Personal Outlays MoM (SA) (Sept)

A:--

F: --

P: --
U.S. 5-10 Year-Ahead Inflation Expectations (Dec)

A:--

F: --

P: --

U.S. Real Personal Consumption Expenditures MoM (Sept)

A:--

F: --

P: --
U.S. Weekly Total Rig Count

A:--

F: --

P: --

U.S. Weekly Total Oil Rig Count

A:--

F: --

P: --

U.S. Consumer Credit (SA) (Oct)

A:--

F: --

P: --
China, Mainland Foreign Exchange Reserves (Nov)

A:--

F: --

P: --

Japan Trade Balance (Oct)

A:--

F: --

P: --

Japan Nominal GDP Revised QoQ (Q3)

A:--

F: --

P: --

China, Mainland Imports YoY (CNH) (Nov)

A:--

F: --

P: --

China, Mainland Exports (Nov)

A:--

F: --

P: --

China, Mainland Imports (CNH) (Nov)

A:--

F: --

P: --

China, Mainland Trade Balance (CNH) (Nov)

A:--

F: --

P: --

China, Mainland Exports YoY (USD) (Nov)

A:--

F: --

P: --

China, Mainland Imports YoY (USD) (Nov)

A:--

F: --

P: --

Germany Industrial Output MoM (SA) (Oct)

A:--

F: --

P: --
Euro Zone Sentix Investor Confidence Index (Dec)

A:--

F: --

P: --

Canada National Economic Confidence Index

--

F: --

P: --

U.K. BRC Like-For-Like Retail Sales YoY (Nov)

--

F: --

P: --

U.K. BRC Overall Retail Sales YoY (Nov)

--

F: --

P: --

Australia Overnight (Borrowing) Key Rate

--

F: --

P: --

RBA Rate Statement
RBA Press Conference
Germany Exports MoM (SA) (Oct)

--

F: --

P: --

U.S. NFIB Small Business Optimism Index (SA) (Nov)

--

F: --

P: --

Mexico 12-Month Inflation (CPI) (Nov)

--

F: --

P: --

Mexico Core CPI YoY (Nov)

--

F: --

P: --

Mexico PPI YoY (Nov)

--

F: --

P: --

U.S. Weekly Redbook Index YoY

--

F: --

P: --

U.S. JOLTS Job Openings (SA) (Oct)

--

F: --

P: --

China, Mainland M1 Money Supply YoY (Nov)

--

F: --

P: --

China, Mainland M0 Money Supply YoY (Nov)

--

F: --

P: --

China, Mainland M2 Money Supply YoY (Nov)

--

F: --

P: --

U.S. EIA Short-Term Crude Production Forecast For The Year (Dec)

--

F: --

P: --

U.S. EIA Natural Gas Production Forecast For The Next Year (Dec)

--

F: --

P: --

U.S. EIA Short-Term Crude Production Forecast For The Next Year (Dec)

--

F: --

P: --

EIA Monthly Short-Term Energy Outlook
U.S. API Weekly Gasoline Stocks

--

F: --

P: --

U.S. API Weekly Cushing Crude Oil Stocks

--

F: --

P: --

U.S. API Weekly Crude Oil Stocks

--

F: --

P: --

U.S. API Weekly Refined Oil Stocks

--

F: --

P: --

South Korea Unemployment Rate (SA) (Nov)

--

F: --

P: --

Japan Reuters Tankan Non-Manufacturers Index (Dec)

--

F: --

P: --

Japan Reuters Tankan Manufacturers Index (Dec)

--

F: --

P: --

Japan Domestic Enterprise Commodity Price Index MoM (Nov)

--

F: --

P: --

Japan Domestic Enterprise Commodity Price Index YoY (Nov)

--

F: --

P: --

China, Mainland PPI YoY (Nov)

--

F: --

P: --

China, Mainland CPI MoM (Nov)

--

F: --

P: --

Q&A with Experts
    • All
    • Chatrooms
    • Groups
    • Friends
    Connecting
    .
    .
    .
    Type here...
    Add Symbol or Code

      No matching data

      All
      Trump Updates
      Recommend
      Stocks
      Cryptocurrencies
      Central Banks
      Featured News
      • All
      • Russia-Ukraine Conflict
      • Middle East Flashpoint
      • All
      • Russia-Ukraine Conflict
      • Middle East Flashpoint
      Search
      Products

      Charts Free Forever

      Chats Q&A with Experts
      Screeners Economic Calendar Data Tools
      Membership Features
      Data Warehouse Market Trends Institutional Data Policy Rates Macro

      Market Trends

      Market Sentiment Order Book Forex Correlations

      Top Indicators

      Charts Free Forever
      Markets

      News

      News Analysis 24/7 Columns Education
      From Institutions From Analysts
      Topics Columnists

      Latest Views

      Latest Views

      Trending Topics

      Top Columnists

      Latest Update

      Signals

      Copy Rankings Latest Signals Become a signal provider AI Rating
      Contests
      Brokers

      Overview Brokers Assessment Rankings Regulators News Claims
      Broker listing Forex Brokers Comparison Tool Live Spread Comparison Scam
      Q&A Complaint Scam Alert Videos Tips to Detect Scam
      More

      Business
      Events
      Careers About Us Advertising Help Center

      White Label

      Data API

      Web Plug-ins

      Affiliate Program

      Awards Institution Evaluation IB Seminar Salon Event Exhibition
      Vietnam Thailand Singapore Dubai
      Fans Party Investment Sharing Session
      FastBull Summit BrokersView Expo
      Recent Searches
        Top Searches
          Markets
          News
          Analysis
          User
          24/7
          Economic Calendar
          Education
          Data
          • Names
          • Latest
          • Prev

          View All

          No data

          Scan to Download

          Faster Charts, Chat Faster!

          Download App
          English
          • English
          • Español
          • العربية
          • Bahasa Indonesia
          • Bahasa Melayu
          • Tiếng Việt
          • ภาษาไทย
          • Français
          • Italiano
          • Türkçe
          • Русский язык
          • 简中
          • 繁中
          Open Account
          Search
          Products
          Charts Free Forever
          Markets
          News
          Signals

          Copy Rankings Latest Signals Become a signal provider AI Rating
          Contests
          Brokers

          Overview Brokers Assessment Rankings Regulators News Claims
          Broker listing Forex Brokers Comparison Tool Live Spread Comparison Scam
          Q&A Complaint Scam Alert Videos Tips to Detect Scam
          More

          Business
          Events
          Careers About Us Advertising Help Center

          White Label

          Data API

          Web Plug-ins

          Affiliate Program

          Awards Institution Evaluation IB Seminar Salon Event Exhibition
          Vietnam Thailand Singapore Dubai
          Fans Party Investment Sharing Session
          FastBull Summit BrokersView Expo

          USD/JPY Extends Decline As Yen Recovers on Intervention Fears

          Blue River

          Forex

          Technical Analysis

          Summary:

          The USD/JPY pair fell to 156.13 on Thursday, with the Japanese yen recouping recent losses as markets remain on high alert for potential intervention by Japanese authorities.

          The USD/JPY pair fell to 156.13 on Thursday, with the Japanese yen recouping recent losses as markets remain on high alert for potential intervention by Japanese authorities.

          Traders are speculating that the US Thanksgiving holiday, which typically sees lower liquidity and thinner market conditions, could provide a strategic "window" for regulators to intervene and support the yen. Notably, the mere risk of intervention is already acting as a deterrent, effectively capping the currency's recent decline.

          Fundamentally, sentiment is also shifting as investors reassess the Bank of Japan's (BoJ) policy trajectory. Recent media reports suggest the central bank is actively preparing for a potential rate hike as early as next month. This shift is driven by persistent inflationary pressures, the pass-through effects of a weak yen, and a perceived easing of political pressure to maintain ultra-loose monetary settings.

          Externally, the yen has found additional support from a broadly weaker US dollar. Markets have increased bets on further Fed easing, weighing on the greenback across the board.
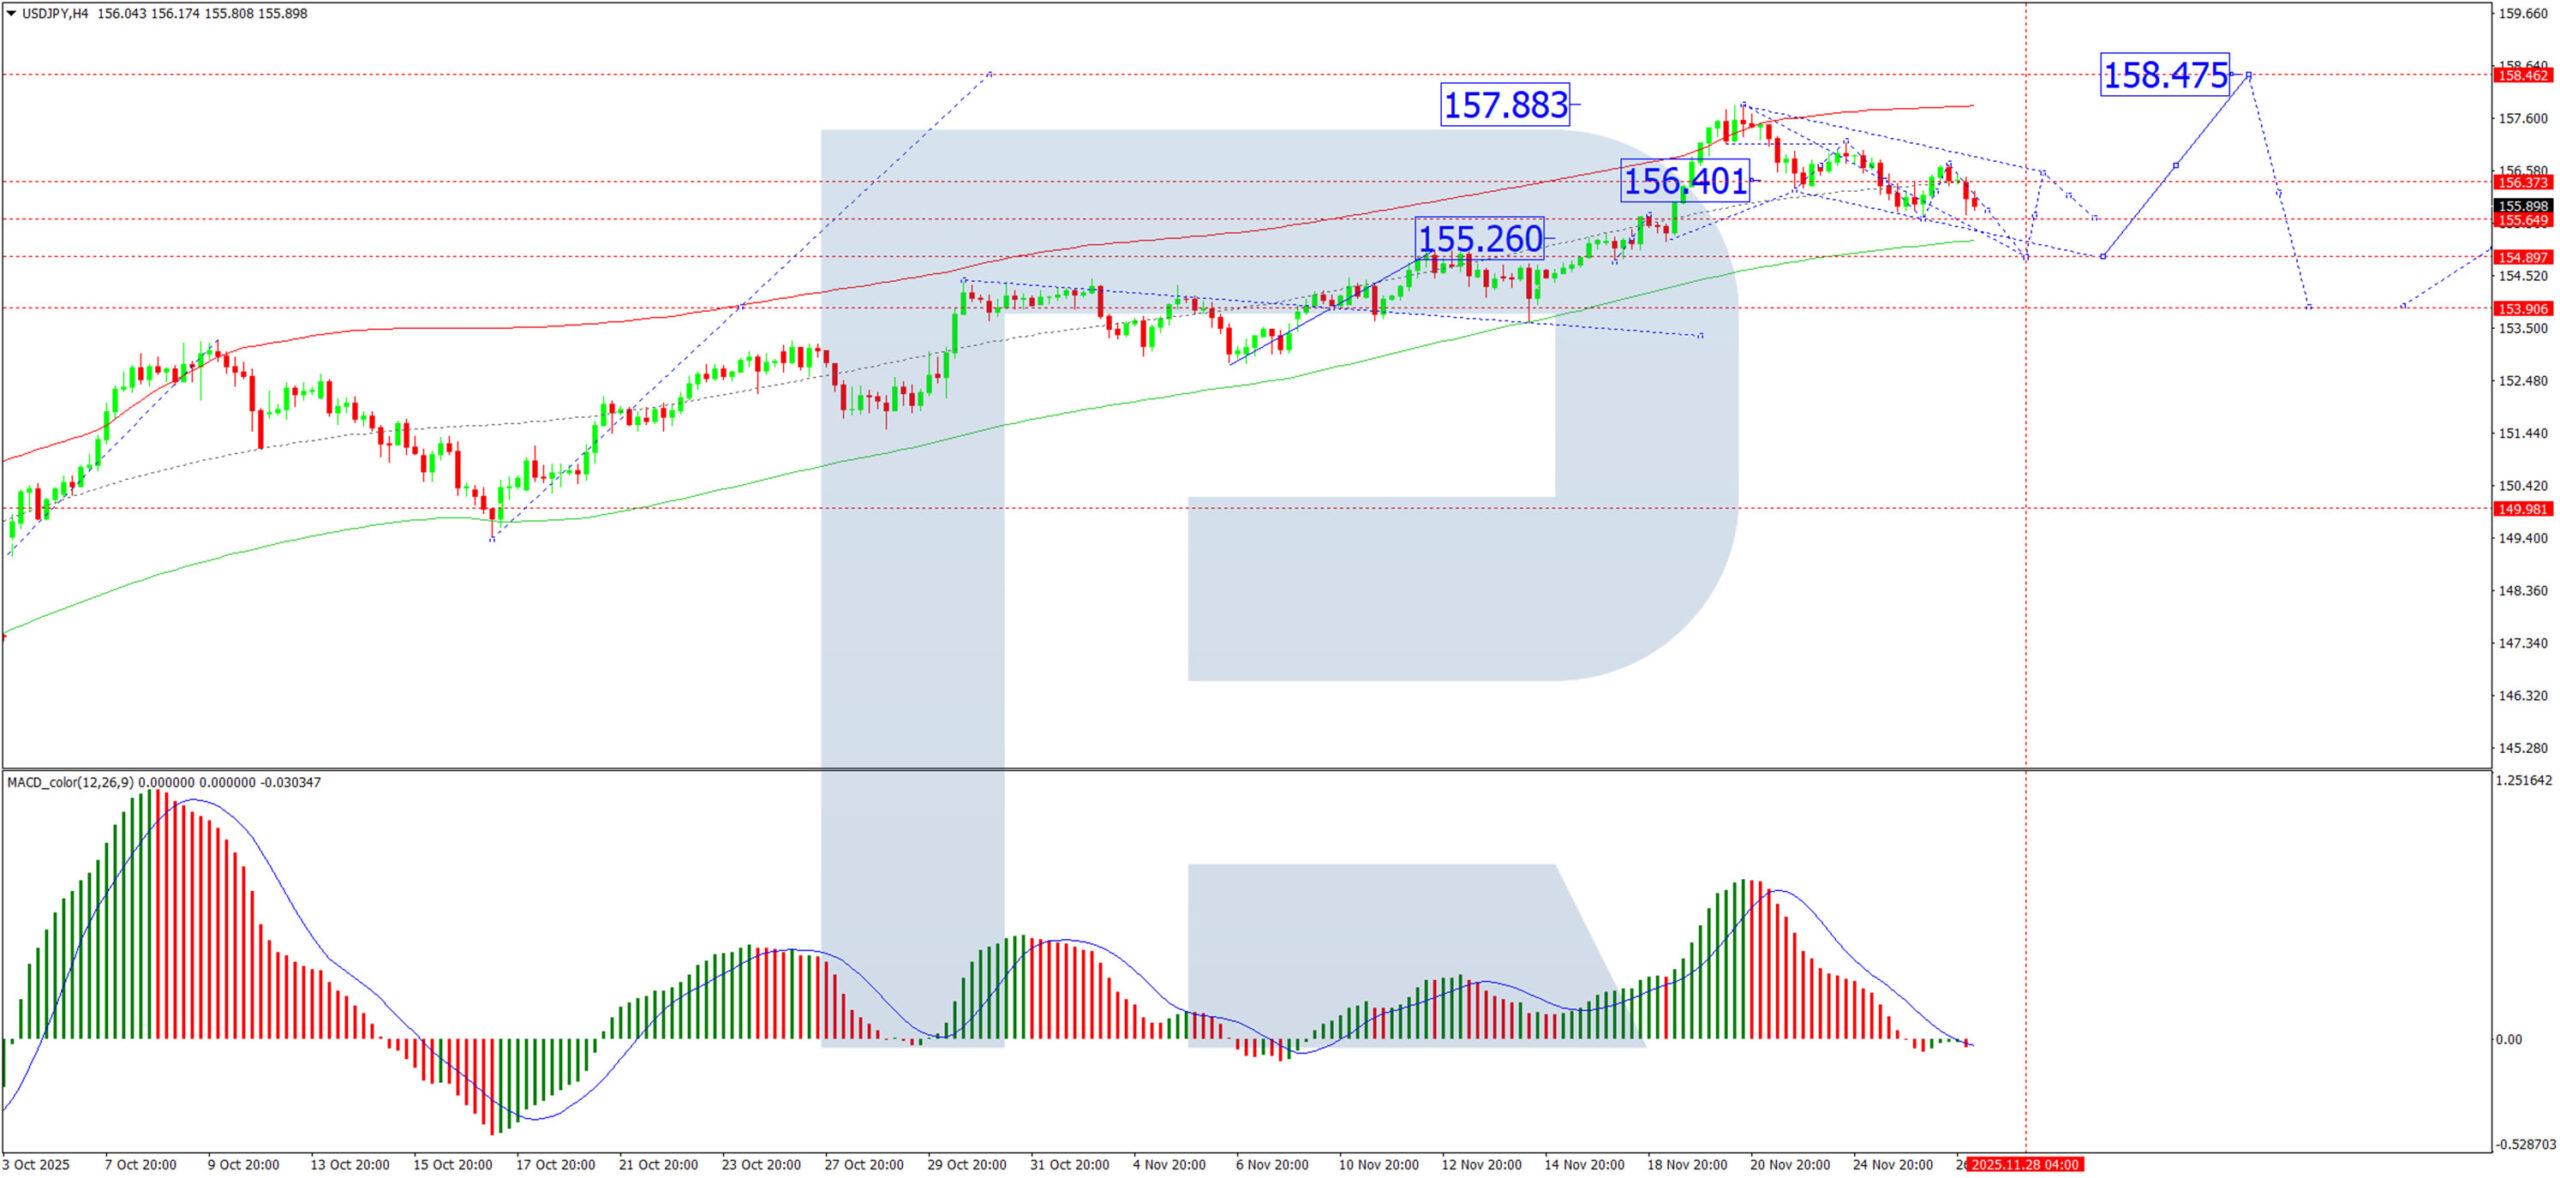
          Technical Analysis: USD/JPY

          H4 Chart:

          On the H4 chart, USD/JPY is forming a consolidation range around 156.40. We anticipate a near-term decline to 154.90, which is likely to be followed by a technical rebound to retest the 156.40 level. A decisive upward breakout above this resistance would open the path for a more significant rally towards 158.47. However, following such a move, we would expect the formation of a new lower high and the start of a fresh downward impulse, targeting 154.00 and potentially extending the correction to 153.30. The MACD indicator supports this bearish medium-term bias. Its signal line is below zero, pointing downward, confirming that selling momentum remains strong.
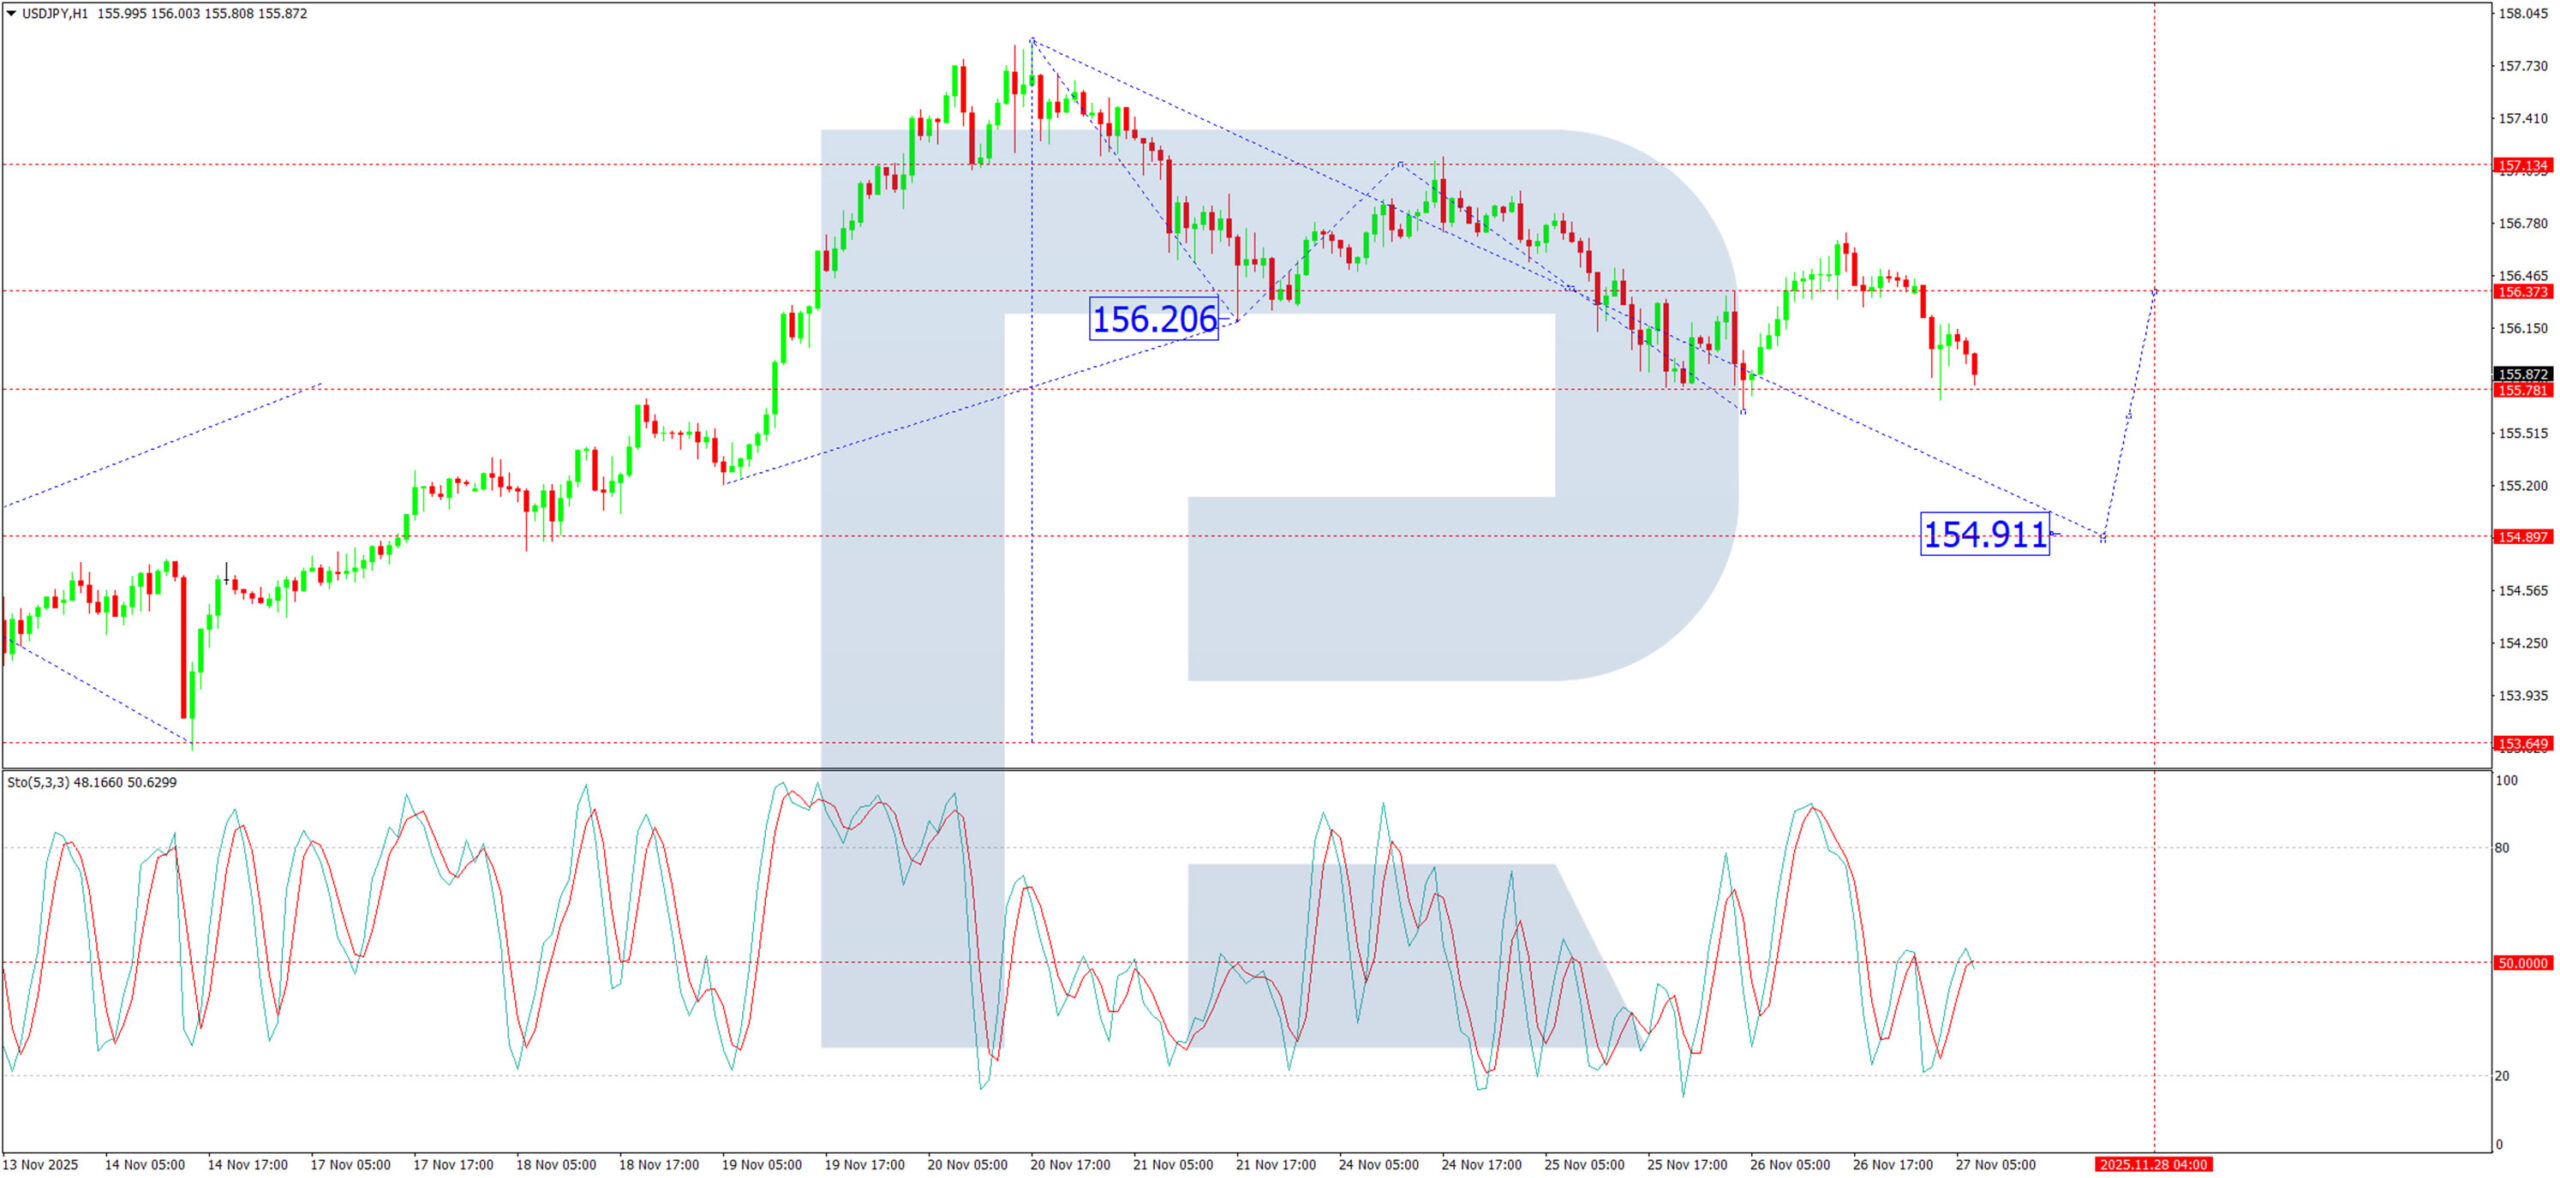
          H1 Chart:

          On the H1 chart, the pair is developing a clear downward wave structure with an initial target at 154.90. We expect this target to be reached, after which a corrective wave of growth should emerge, retesting the 156.40 level from below. The Stochastic oscillator corroborates this near-term bearish view. Its signal line is below 50 and falling towards 20, indicating that short-term downward momentum remains intact for now.

          Conclusion

          The yen is strengthening on a confluence of intervention threats and a fundamental reassessment of BoJ policy. Technically, USD/JPY is in a corrective phase with an immediate target at 154.90. While a rebound to 156.40 is expected thereafter, the broader risk is tilted to the downside. A break above 158.47 would be required to invalidate the current bearish corrective structure. Traders should remain vigilant for intervention-driven volatility, particularly during periods of low liquidity.

          Source: ACTIONFOREX

          Risk Warnings and Disclaimers
          You understand and acknowledge that there is a high degree of risk involved in trading. Following any strategies or investment methods may lead to potential losses. The content on the site is provided by our contributors and analysts for information purposes only. You are solely responsible for determining whether any trading assets, securities, strategy, or any other product is suitable for investing based on your own investment objectives and financial situation.
          Add to Favorites
          Share

          Gold (XAUUSD) & Silver Price Forecast: Dovish Fed Signals Hit Dollar, Metals Eye Breakout

          Glendon

          Commodity

          Economic

          Market Overview

          Gold softened in early European trading as improving risk sentiment and rising expectations of a December Federal Reserve rate cut pulled investors away from haven assets. Recent remarks from senior Fed officials signaled growing support for policy easing, prompting markets to reassess the US rate outlook.

          New York Fed President John Williams called policy "modestly restrictive" and said rate adjustments remain possible if inflation keeps easing. Governor Christopher Waller added that labor-market cooling provides room for a cut, while former Fed official Stephen Miran argued that weakening economic conditions warrant "a quicker shift toward neutral."

          Rate expectations moved sharply. Futures markets now assign an added 85% probability to a quarter-point cut next month, up from roughly 50% a week earlier. The shift pushed the US Dollar to a one-week low, though stronger risk appetite limited gold's upside.

          Mixed US Data Keeps Traders Cautious

          US economic figures delivered a mixed signal. Durable goods orders rose 0.5%, beating forecasts but slowing from the prior month, while unemployment claims fell to 216,000, the lowest in seven months. However, the Chicago PMI dropped to 36.3, its deepest contraction in months, highlighting ongoing business weakness.

          Despite the divergence, traders focused more on the Fed's dovish tone than the data itself, keeping pressure on gold and silver as markets rotated into risk assets.

          Silver Tracks Gold as Risk Appetite Improves

          Silver eased alongside gold, with sentiment supported by signs of progress in geopolitical negotiations and firming global equities. As an industrial-linked metal, silver remains particularly sensitive to shifting growth expectations, and the improved risk backdrop tempered haven demand.

          For now, both metals remain anchored to the Fed's policy trajectory. With markets heavily pricing in a December cut, upcoming inflation data and scheduled Fed speeches will likely guide the next move.

          Short-Term Forecast

          Gold may range between $4,122–$4,179 as traders await a breakout from the triangle, while silver holds a bullish bias above $52.26, eyeing $53.46–$54.44 if momentum strengthens.
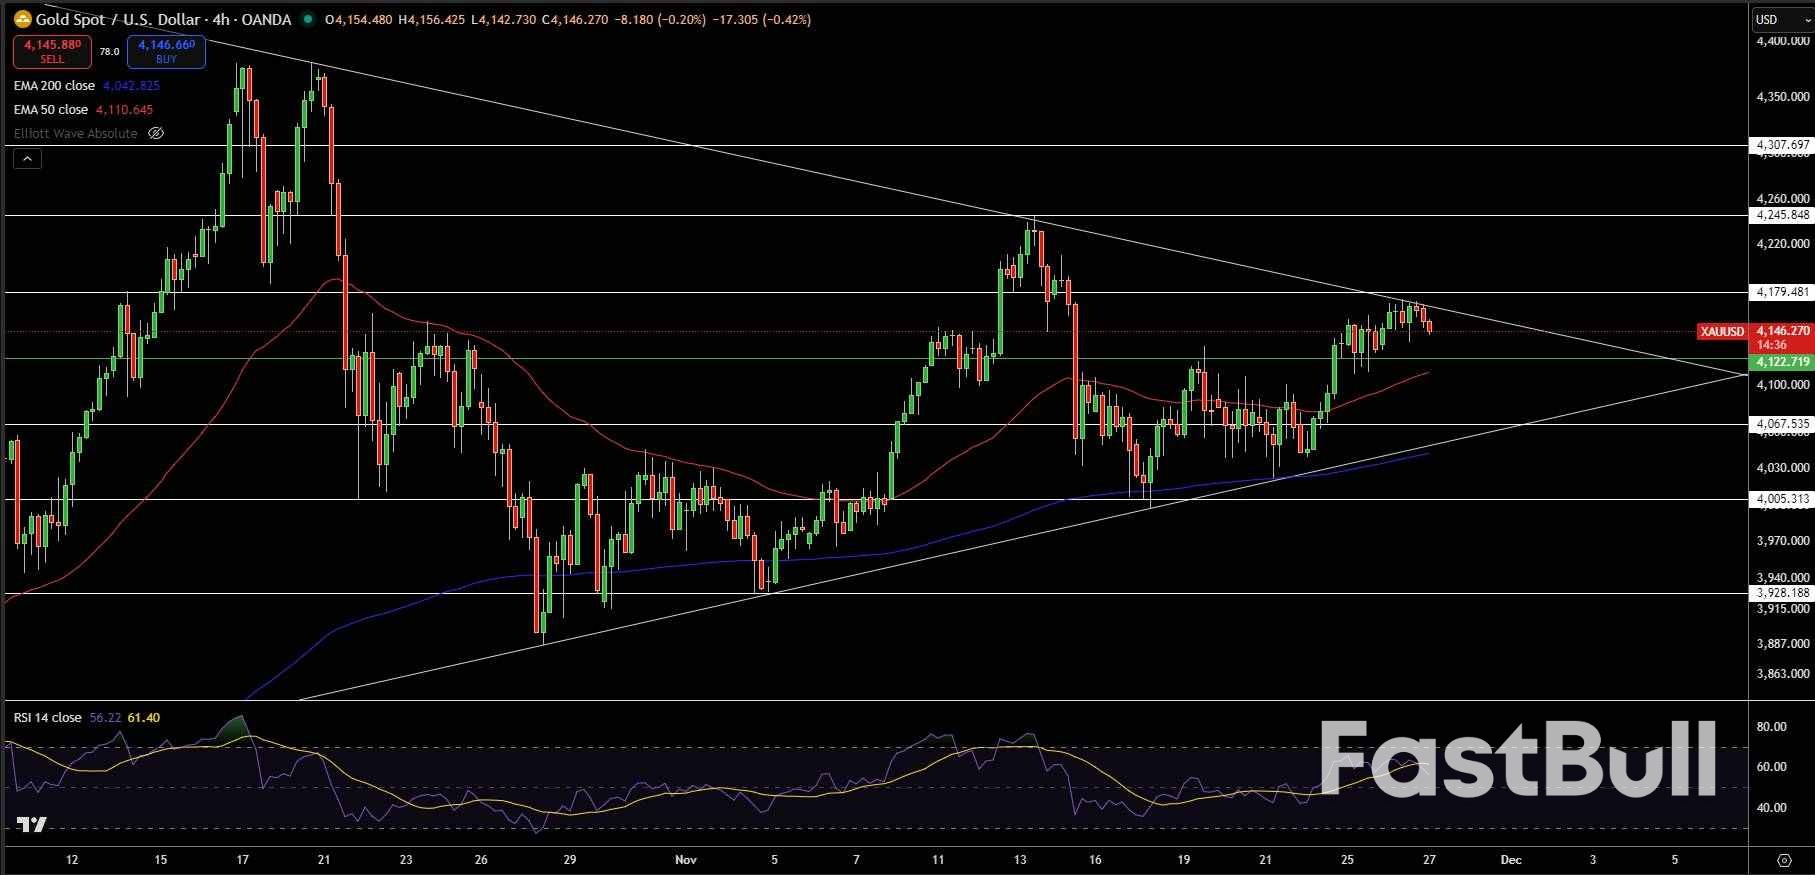
          Gold Prices Forecast: Technical Analysis

          Gold – Chart

          Gold is consolidating near $4,146, trading inside a tightening symmetrical triangle that has been developing through November. The metal continues to respect its rising trendline from the November 13 low, while the upper boundary near $4,180 remains firm resistance. Price is holding above the 50-EMA and 200-EMA, signaling underlying support even as upside momentum slows.

          The RSI sits around 56, reflecting steady but controlled buying interest. A breakout above $4,179 would expose $4,245, while a close below $4,122 threatens a move back toward $4,067 and the triangle's lower trendline.

          Gold remains at an inflection point, with traders watching for a decisive break before positioning for the next directional move.
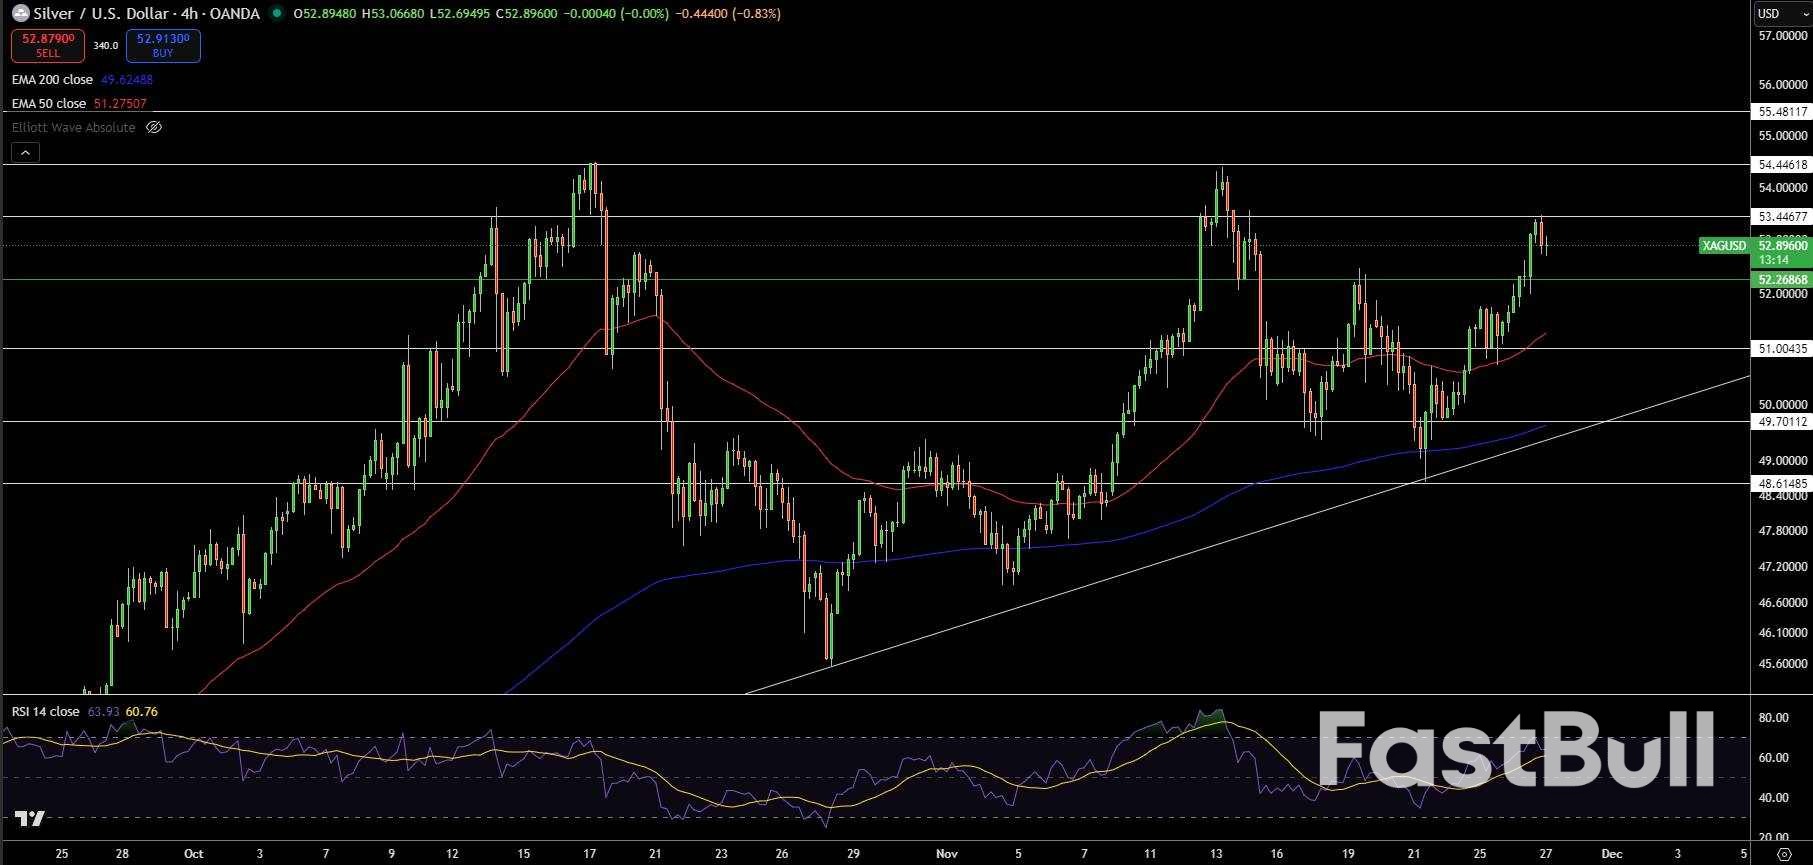
          Silver (XAG/USD) Price Forecast: Technical Outlook

          Silver – Chart

          Silver is consolidating near $52.89, holding firmly above the key support at $52.26 after a strong recovery from the $49.70 region. Price continues to trade above the 50-EMA and 200-EMA, signaling a stable bullish bias while respecting the broader ascending trendline from late October. The RSI sits around 63, showing improving momentum without overextended conditions.

          Immediate resistance is positioned at $53.46, a level that capped the previous rally. A decisive break above this zone could open a continuation move toward $54.44.

          If sellers return, support at $52.26 and $51.00 becomes the first downside cushion. Silver remains in a constructive structure, with traders watching for a clean breakout before confirming the next direction.

          Source: FX Empire

          To stay updated on all economic events of today, please check out our Economic calendar
          Risk Warnings and Disclaimers
          You understand and acknowledge that there is a high degree of risk involved in trading. Following any strategies or investment methods may lead to potential losses. The content on the site is provided by our contributors and analysts for information purposes only. You are solely responsible for determining whether any trading assets, securities, strategy, or any other product is suitable for investing based on your own investment objectives and financial situation.
          Add to Favorites
          Share

          Asian Markets Rally on Wall Street Momentum as Fed Rate Cut Bets Strengthen

          Gerik

          Economic

          Stocks

          Asian Equities Climb as Global Markets Ride Wall Street’s Upward Wave

          Equity markets across Asia traded higher on Thursday, drawing clear momentum from Wall Street's sustained rally. The Nasdaq, S&P 500, and Dow Jones all posted solid gains for a fourth straight session, with investor sentiment buoyed by rising confidence in a forthcoming U.S. interest rate cut.
          Japan’s Nikkei 225 jumped 1% to 50,069.33, bolstered by expectations that the Federal Reserve will lower its benchmark rate during the December 10 meeting. The rally was further amplified by reports that Tokyo plans to inject 11 trillion yen ($70.5 billion) via bond issuance into economic stimulus supporting corporate earnings prospects and financial system liquidity.

          Regional Gains Mixed as Domestic Headwinds Persist

          Elsewhere in Asia, markets also posted modest gains, though underlying data and domestic factors tempered enthusiasm. The Hang Seng index in Hong Kong rose 0.3% to 25,927.96 and the Shanghai Composite edged up 0.1% to 3,883.01. However, sentiment in China remained fragile due to lackluster industrial profit growth. Earnings at large Chinese industrial firms rose just 1.9% year-on-year in the first ten months of 2025, a marked slowdown from the previous 3.2%, indicating persistent challenges in the manufacturing and export sectors. This weak profit momentum though correlated with broader economic softness also highlights potential structural concerns that may require more forceful policy responses.
          In South Korea, the Kospi advanced 0.7% to 3,986.54 as the Bank of Korea maintained its policy rate at 2.5%, seeking to support financial stability amid rising household debt and ongoing currency weakness. This rate hold aligns with efforts to stabilize both housing markets and capital flows, suggesting that domestic policy remains tightly coupled to inflation and credit risk dynamics.
          Australia's S&P/ASX 200 inched up less than 0.1%, while Taiwan’s tech-heavy Taiex index gained 0.2%, reflecting limited movement amid regional caution and mixed earnings sentiment.

          U.S. Market Momentum Continues on Rate Cut Optimism and Strong Earnings

          In the U.S., the S&P 500 closed up 0.7% at 6,812.61, the Dow gained 0.7% to 47,427.12, and the Nasdaq climbed 0.8% to 23,214.69. The rally was supported by market participants increasingly betting at an estimated 83% probability per CME Group data that the Fed will lower rates next month. This optimism has helped reverse much of the early November selloff, particularly in rate-sensitive sectors like technology and real estate.
          Strong performances in the tech sector, led by AI-related optimism, pushed the market higher. Dell Technologies surged 5.8% on record AI server orders, while Nvidia rose 1.4%, Microsoft added 1.8%, and Broadcom advanced 3.3%. These gains suggest a continued causal link between AI infrastructure demand and equity performance in the tech space.
          Financials also participated in the rally. Robinhood Markets posted the strongest S&P 500 gain, rising 10.9% after announcing plans to launch a futures and derivatives exchange signaling a potential business model expansion and capturing investor excitement over diversified revenue streams.
          Retail stocks added further breadth to the rally. Urban Outfitters jumped 13.5% after beating Wall Street forecasts, extending a trend of upbeat retail earnings that reflect stronger-than-expected consumer demand in the final quarter of the year.

          Bond Market and Commodities Reflect Mixed Signals

          The bond market presented a nuanced picture. The 10-year Treasury yield fell to 3.99%, reflecting increased demand for long-term government securities likely driven by expectations of looser monetary policy. Meanwhile, the 2-year yield edged up to 3.48%, suggesting a slight divergence in investor views on short-term rate paths an indication of near-term uncertainty despite broader optimism.
          Oil prices fell modestly, with U.S. crude dipping 28 cents to $58.37 and Brent crude losing 33 cents to $61.84. The decline reflects a combination of anticipated supply adjustments from OPEC+ and ongoing geopolitical negotiations, particularly U.S.-led Ukraine peace talks.
          Currency movements were largely muted. The U.S. dollar softened to 156.14 yen from 156.40, while the euro made a marginal gain to $1.1609 from $1.1601. These shifts are likely the result of investors rebalancing positions ahead of expected central bank moves in both the U.S. and Japan.

          Rate Cuts, Earnings, and Liquidity Conditions to Drive Momentum

          With U.S. markets closed Thursday and trading hours shortened Friday due to the Thanksgiving holiday, volumes are expected to be light. However, market direction will remain sensitive to new economic data, forward guidance from Fed officials, and developments in corporate earnings.
          Investor focus is likely to remain fixated on December’s monetary policy decision, which may serve as the key catalyst to either extend the current rally or trigger renewed caution. Meanwhile, Asian markets will continue tracking both external sentiment and local economic data, particularly in China where industrial and property sector risks remain elevated.
          In sum, global markets are in a fragile rebound phase, driven by soft expectations of monetary easing and selective earnings strength. The sustainability of the rally, however, will depend on whether economic fundamentals can catch up with investor optimism.

          Source: AP

          To stay updated on all economic events of today, please check out our Economic calendar
          Risk Warnings and Disclaimers
          You understand and acknowledge that there is a high degree of risk involved in trading. Following any strategies or investment methods may lead to potential losses. The content on the site is provided by our contributors and analysts for information purposes only. You are solely responsible for determining whether any trading assets, securities, strategy, or any other product is suitable for investing based on your own investment objectives and financial situation.
          Add to Favorites
          Share

          Kiwi, Aussie Power Ahead While Dollar Sinks

          Michelle

          Forex

          Economic

          New Zealand Dollar's broad-based rally extended through today's Asian session as a run of solid domestic data continued to bolster confidence in the country's recovery. Strong retail sales in Q3 suggested the rebound is already underway, while the surge in business confidence and activity pointed to a more durable upturn. Together, the indicators painted a picture of improving real-side momentum rather than a temporary sentiment bounce.

          The optimism was reinforced by outgoing RBNZ Governor Christian Hawkesby, who made clear that the hurdle for further rate cuts is now very high. Hawkesby emphasized that only a significant deterioration in the outlook would justify a shift away from the central bank's current projection of holding rates through next year. His comments reinforce the perception that the easing phase has ended and that policy is likely to remain on hold for an extended period.

          Aussie also traded strongly, buoyed by shifting expectations around the RBA outlook. Some economists have flipped their calls and now argue the next move may in fact be a rate hike rather than a cut. NAB said that if growth accelerates and the labor market tightens, a hike as early as the first half of 2026 is possible. Some others have taken an even more hawkish view, penciling in increases in both May and August next year.

          Dollar, by contrast, stayed broadly weak. Markets are firming expectations that the Fed will deliver another risk-management cut before year-end. At the same time, risk appetite has returned to U.S. equities, while 10-year Treasury yield has slipped back below the 4% mark. These factors are interconnected, reinforcing downward pressure on the greenback as investors rotate toward higher-beta currencies.

          Taken together, the macro backdrop has encouraged further selling in the Dollar while supporting the antipodeans, particularly Kiwi. Risk-sensitive FX is benefitting from the combination of solid domestic fundamentals and a friendlier global risk tone.

          For the week so far, Kiwi remains at the top, followed by Aussie and then Sterling, which emerged from the UK Autumn Budget without major damage. At the bottom end, Dollar sits as the weakest performer, trailed by Yen and then Loonie. Euro and Swiss Franc are hovering in the middle of the pack.

          In Asia, at the time of writing, Nikkei is up 1.24%. Hong Kong HSI is up 0.53%. China Shanghai SSE is up 0.59%. Singapore Strait Times is up 0.44%. Japan 10-year JGB yield is down -0.02 at 1.799. Overnight, DOW rose 0.67%. S&P 500 rose 0.69%. NASDAQ rose 0.82%. 10-year yield fell -0.004 to 3.998.

          Noguchi says BoJ can restart hikes gradually as Yen weakness turns problematic

          BoJ board member Asahi Noguchi said today that the central bank could resume interest rate hikes once U.S. tariff risks recede, but emphasized that any tightening must "measured, step-by-step".

          He warned that maintaining very low real interest rates for too long risks undermining the economy by pushing Yen lower and stoking undesirable inflation. A weaker currency, he said, lifts prices through import costs and boosts exports in a way that can overheat the economy .

          Noguchi highlighted that Yen depreciation was once a tailwind during Japan's deflation era, supporting exporters and helping revive demand. However, "as supply constraints intensify, the positive effects eventually disappear and are replaced by negative effects that merely push inflation higher than needed," he added.<

          NZ ANZ business confidence jumps to 11 year high, green shoots well established

          New Zealand's ANZ Business Confidence index jumped from 58.1 to 67.1 in November, the strongest reading in 11 years. The survey's own-activity outlook also surged from 44.6 to 53.1, marking the highest level since 2014 and signaling a material improvement in real economic momentum rather than sentiment alone. ANZ noted that "green shoots are looking well established", with recent gains increasingly rooted in actual activity.

          Inflation signals were more mixed. The share of firms planning to raise prices over the next three months climbed from 44% to 51%, the highest since March. However, expected cost increases eased slightly from 76% to 74%, and one-year-ahead inflation expectations were steady at 2.7%. The combination points to stabilizing inflation pressures, but not yet disinflation strong enough to encourage fresh easing from the RBNZ.

          ANZ said the underlying improvement in conditions offers reassurance that the pickup is likely to be sustained. With the recovery underway and CPI sitting at the top of the target band, the bank sees little reason for further OCR cuts "barring unexpected developments."

          NZ retail sales surge 1.9% qoq in Q3, strongest since 2021

          New Zealand retail sales delivered a strong upside surprise in Q3, rising 1.9% qoq versus expectations of 0.6%. Ex-auto sales also beat forecasts, up 1.2% qoq compared with 0.8% consensus.

          Statistics New Zealand said this was the largest quarterly increase in retail activity since late 2021, with broad-based gains across the sector. Most industries recorded growth during the September.

          The details showed particularly strong demand in motor vehicles and electrical and electronic goods retailing, which posted the biggest increases. Eight of the 15 retail industries reported higher volumes compared with Q2.

          Fed's Beige Book: Activity little changed, employment eases, costs still rising

          The Fed's Beige Book indicated an economy that has largely stalled, with activity "little changed" across Districts. Consumer spending declined again, while manufacturing posted slight improvement despite the drag from tariffs and uncertainty around their future path. Outlooks were broadly unchanged, though several contacts flagged "increased risk of slower activity in coming months.

          The labor market showed clearer signs of easing, with employment slipping "slightly" and around half of Districts reporting "weaker labor demand". Wage gains were generally "modest", consistent with a gradual loosening in labor conditions.

          Price growth remained moderate but continued to reflect tariff-related pressures on input costs, especially in manufacturing and retail. Firms reported uneven ability to pass these higher costs through, with outcomes shaped by competition, consumer sensitivity, and client resistance. While businesses expect cost pressures to persist, "plans to raise prices in the near term were mixed," suggesting a more uneven path for inflation heading into early 2026.

          ECB's Lane says more cooling needed in core inflation

          ECB chief economist Philip Lane said overnight that while headline inflation has hovered near target for most of the year, the picture is still flattered by energy deflation. Non-energy inflation remains "well above 2%," and Lane stressed that a further slowdown is required to ensure inflation is sustainably anchored at target. Nevertheless, he added "We're confident that's going to happen because everything we look at tells us wage dynamics are set to decelerate further."

          Lane also addressed concerns around U.S. tariffs and Europe's export exposure. He argued the hit may be smaller than feared, as the AI-driven expansion and high U.S. government spending are supporting American demand. Under these conditions, firms still have room to pass through tariff-related costs to U.S. importers and consumers. While the U.S. is an important partner, Lane underlined that it is "not the predominant driver of the European economy."

          However, he warned that tariffs are reshaping global trade flows in meaningful ways, particularly in Asia. China is exporting more to Southeast Asia, Southeast Asia is exporting more to the U.S., and China is simultaneously increasing its footprint in Europe and other markets. Lane called this a "very big reconfiguration" of the global system, one that intensifies competitive pressure on European firms even at home.

          AUD/USD Daily Report

          Daily Pivots: (S1) 0.6482; (P) 0.6501; (R1) 0.6538;

          AUD/USD's rise from 0.6420 accelerates higher today and intraday bias remains on the upside for 0.6579 resistance. Decisive break there should confirm that whole fall from 0.6706 has completed as a three wave correction. Stronger rally should then be seen back to retest 0.6706. On the downside, below 0.6483 minor support will turn intraday bias neutral first.

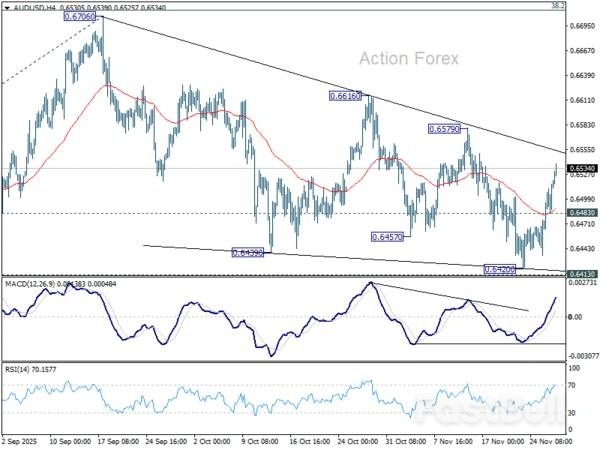
          In the bigger picture, there is no clear sign that down trend from 0.8006 (2021 high) has completed. Rebound from 0.5913 is seen as a corrective move. Outlook will remain bearish as long as 38.2% retracement of 0.8006 to 0.5913 at 0.6713 holds. Break of 0.6413 support will suggest rejection by 0.6713 and solidify this bearish case. Nevertheless, considering bullish convergence condition in W MACD, sustained break of 0.6713 will be a strong sign of bullish trend reversal, and pave the way to 0.6941 structural resistance for confirmation.

          Source: ACTIONFOREX

          To stay updated on all economic events of today, please check out our Economic calendar
          Risk Warnings and Disclaimers
          You understand and acknowledge that there is a high degree of risk involved in trading. Following any strategies or investment methods may lead to potential losses. The content on the site is provided by our contributors and analysts for information purposes only. You are solely responsible for determining whether any trading assets, securities, strategy, or any other product is suitable for investing based on your own investment objectives and financial situation.
          Add to Favorites
          Share

          Were The Brits Behind Bloomberg’s Russian-US Leaks?

          Andrew Korybko

          Political

          Russia-Ukraine Conflict

          Bloomberg shared what it claimed to be the transcripts of calls between Trump’s Special Envoy Steve Witkoff and Putin’s top foreign policy aide Yury Ushakov as well as between Ushakov and Putin’s other advisor Kirill Dmitriev about the Ukrainian peace process. The gist of the Witkoff-Ushakov call was Witkoff’s proposal to have Putin suggest a Gaza-like 20-point peace deal for Ukraine during an upcoming call with Trump while the Ushakov-Dmitriev one implied that the leaked draft was Russian-influenced.
          Ushakov declined to comment on his talks with Witkoff but said that “Somebody tapped, somebody leaked, but not us” whereas Dmitriev flat-out described his purported call with Ushakov as “fake”. For his part, Trump defended Witkoff’s alleged “coaching” of Ushakov on how Putin should deal with him by reminding everyone “That’s what a dealmaker does. You got to say, ‘Look, they want this – you got to convince them with this.’ That’s a very standard form of negotiations.”
          As regards the possibility that the draft framework was Russian-influenced, the notion of which has been pushed by the legacy media to discredit the proposed mutual compromises therein, that was already debunked. Secretary of State Marco Rubio, who also serves as National Security Advisor, said that “The peace proposal was authored by the U.S. It is offered as a strong framework for ongoing negotiations It is based on input from the Russian side. But it is also based on previous and ongoing input from Ukraine.”
          Therefore, neither transcript is scandalous even if their contents were accurately reported, yet the question arises of who might have tapped and leaked these calls. Intriguingly, earlier the same day that Bloomberg later published their report, Russia’s Foreign Intelligence Service warned that the UK “aims to undermine Trump's efforts to resolve the conflict by discrediting him.” Readers will recall the UK’s role in Russiagate, which they conspired with the CIA, FBI, and the Clinton camp to cook up to against him.
          Seeing as how they can no longer collude in this way with their three prior conspirators, the UK might therefore have resorted to leaking those two calls with Ushakov that they might have tapped (possibly among many others) as a last-ditch attempt to discredit the latest unprecedented progress towards peace. This provocation might also have been meant to make Trump panic and fire Witkoff out of fear of another Russiagate 2.0 investigation if this scandal helps the Democrats flip Congress next year.
          Firing Witkoff, who’s been central to the recent progress towards peace, could ruin the process right at its most pivotal moment as Zelensky is reportedly considering meeting with Trump very soon to finalize the details of the US-mediated peace framework with Russia. By holding firm, Trump is therefore obstructing efforts to ruin everything that he’s achieved thus far on a Russian-Ukrainian peace deal and consequently revive the Russiagate hoax for helping the Democrats during next year’s midterms.
          Accordingly, Bloomberg’ Russian-US leaks can be considered a British intelligence operation for derailing the peace process and perpetuating the conflict from which the UK profits, not to mention meddling in the midterms by giving a fake news-driven boost to the Democrats. Trump revealed that Witkoff will meet with Putin on Monday and might even be joined by his son-in-law Jared Kushner, who helped negotiate the Gaza deal, so more British provocations are expected out of desperation to ruin their talks.
          Risk Warnings and Disclaimers
          You understand and acknowledge that there is a high degree of risk involved in trading. Following any strategies or investment methods may lead to potential losses. The content on the site is provided by our contributors and analysts for information purposes only. You are solely responsible for determining whether any trading assets, securities, strategy, or any other product is suitable for investing based on your own investment objectives and financial situation.
          Add to Favorites
          Share

          Canada Tightens Steel Tariffs as Trade Tensions With U.S. Escalate and Global Pressures Mount

          Gerik

          Economic

          Ottawa Escalates Steel Tariffs Amid Strained U.S. Relations and Chinese Oversupply

          Prime Minister Mark Carney has unveiled sweeping trade measures aimed at fortifying Canada’s steel and softwood lumber industries in response to intensifying U.S. trade tensions and the continuing influx of cheap Chinese metal. At the heart of the strategy is a new 25% tariff on a range of imported steel derivative products valued at approximately C$10 billion annually including wind towers, prefabricated buildings, wires, and fasteners. About 40% of these products are typically imported from the United States.
          The move marks Carney’s most assertive shift in trade policy since September, when Canada dropped most retaliatory tariffs on U.S. goods. While a broad 25% tariff on U.S. steel and aluminum remains in place, Canada has so far resisted matching U.S. President Donald Trump’s aggressive 50% duties on those base metals. This latest announcement appears to recalibrate that stance, albeit with cautious language.

          Strategic Protection or Political Retaliation?

          Carney was quick to reject the notion that the new tariffs were a retaliatory move against Washington, stating at a press conference, “It’s not targeted at the U.S. It’s a global approach.” Nonetheless, the timing and composition of the measures suggest otherwise. Trump abruptly terminated bilateral trade negotiations on October 23 following a controversial Ontario anti-tariff ad, and there has been little sign of movement since. The Canadian government maintains that it remains open to re-engaging in talks.
          While Carney’s public tone is conciliatory, his government has taken steps that exert quiet pressure on the U.S. trade position. In addition to the new tariffs, Ottawa will also lower the quota threshold for triggering tariffs on steel from countries without free trade agreements. Tariffs will now apply once imports exceed 20% of 2024 volumes, down from 50%. Even for countries with trade pacts excluding the U.S. and Mexico the tariff trigger will drop to 75% of prior levels.
          These changes increase the likelihood that steel exporters to Canada will hit tariff limits sooner, reinforcing the message that Canada is moving to aggressively shelter its domestic production.

          Domestic Industry Support Expands Amid Competitive Squeeze

          To offset global pressures and stimulate internal demand, Ottawa announced a series of domestic subsidies and financing facilities. An additional C$500 million will be allocated to the Business Development Bank of Canada to support softwood lumber businesses, alongside another C$500 million under the Large Enterprise Tariff Loan facility.
          Transportation incentives are also being introduced, with Canadian National Railway Co. and Canadian Pacific Kansas City Ltd. receiving federal support to offer 50% discounts on domestic steel and lumber shipments. These measures aim to facilitate internal market absorption of Canadian-made goods amid export restrictions.
          For workers affected by trade turbulence and reduced industrial activity, more than C$100 million will be added over two years to a program supporting reduced work hours, potentially benefiting up to 26,000 employees across various sectors.
          The government also recommitted to its "Buy Canada" policy, set to launch later this year. All defense and construction contracts worth more than C$25 million will be required to prioritize domestic steel and lumber inputs. This mandate extends across federal grants and procurement channels and is expected to channel billions into local manufacturing.

          Market Reactions and Policy Implications

          Industry groups have largely welcomed the tariffs and subsidies. Keanin Loomis, CEO of the Canadian Institute of Steel Construction, applauded the measures, saying they represent a more confident and informed approach by the government. Carney’s handling of the steel file has shifted from reactive to proactive, Loomis suggested, aligning government policy more closely with domestic producers’ demands.
          Despite the broad support, the stakes remain high. Canadian exporters such as Algoma Steel Group, already grappling with Trump's 50% steel tariffs, remain exposed to U.S. protectionism. The Ontario government has extended emergency financial support, but longer-term viability may depend on whether U.S. trade policies soften in the near future a prospect that remains uncertain.
          Meanwhile, the Canadian government is walking a delicate line between deterring foreign dumping and maintaining trade stability. Officials emphasize that the latest tariffs aim to create a fair playing field rather than provoke further trade conflict.

          Policy at a Crossroads

          Carney is scheduled to attend the 2026 World Cup draw in Washington on December 5, which could offer a chance for a diplomatic thaw. However, no formal trade meetings with President Trump are on the agenda, and a recent phone conversation between the two leaders was described as “not newsworthy.”
          Whether or not these new tariffs provoke further escalation or open the door to renewed negotiations remains to be seen. What is clear, however, is that Canada is taking more aggressive steps to insulate its industries from external shocks both geopolitical and economic while signaling to Washington that its patience may be wearing thin.
          In sum, Canada’s evolving trade posture reflects a broader recalibration. With global oversupply threatening domestic margins and political risks rising across borders, Ottawa is preparing for a longer game one in which self-reliance and strategic protection may increasingly outweigh the pursuit of short-term diplomacy.

          Source: Bloomberg

          To stay updated on all economic events of today, please check out our Economic calendar
          Risk Warnings and Disclaimers
          You understand and acknowledge that there is a high degree of risk involved in trading. Following any strategies or investment methods may lead to potential losses. The content on the site is provided by our contributors and analysts for information purposes only. You are solely responsible for determining whether any trading assets, securities, strategy, or any other product is suitable for investing based on your own investment objectives and financial situation.
          Add to Favorites
          Share

          Oil Prices Slide Amid Ukraine Peace Diplomacy and OPEC+ Output Freeze Speculation

          Gerik

          Commodity

          Economic

          Crude Market Dips as Geopolitics and Supply Outlook Weigh Heavily

          Oil prices declined sharply on Thursday, reflecting heightened investor sensitivity to geopolitical developments and structural supply dynamics. Brent crude approached $62 a barrel, while West Texas Intermediate settled near $58 both reversing Wednesday’s modest gains. This marked the fourth consecutive monthly decline for crude, a trend not seen since 2023, underscoring a sustained downtrend linked to both real and speculative pressures.
          The shift in sentiment this week has been largely driven by expectations surrounding renewed peace talks between the United States and Russia. U.S. presidential envoy Steve Witkoff is scheduled to lead a delegation to Moscow next week, prompting speculation over the potential normalization of crude exports from Russia. However, while this diplomatic activity introduces an element of optimism, traders remain skeptical about its immediate impact on oil supply flows.
          This skepticism stems from the understanding that peace agreements, especially in conflict zones such as Ukraine, do not automatically translate into physical market changes. As Haris Khurshid of Karobaar Capital LP aptly noted, symbolic political agreements lack material effect unless they are accompanied by logistical capacity such as restored pipelines, renewed shipping contracts, and operational infrastructure. Therefore, the relationship between peace negotiations and oil prices remains correlational rather than immediately causal.

          OPEC+ Meeting Looms with Output Policy in Focus

          Simultaneously, all eyes are on the upcoming OPEC+ meeting scheduled for November 30. The alliance, led by Saudi Arabia and Russia, has been cautiously managing its production policy. Earlier this month, eight member nations chose to halt any new supply increases in early 2026 following an aggressive ramp-up through much of 2025. This pause reflects a strategic pivot in response to weaker-than-anticipated global demand growth.
          Nevertheless, the current downtrend in oil prices suggests that the market views this output freeze as insufficient to rebalance supply-demand fundamentals. Concerns about a potential surplus remain prevalent, particularly as inventories build and refining margins contract in some regions. This disconnection between supply controls and market pricing points to a potential misalignment in policy timing or market expectations.

          Structural Headwinds and Market Sentiment Alignment

          Underlying these short-term factors are broader structural headwinds that continue to pressure the oil market. Demand growth has lagged behind supply expansion throughout the second half of 2025, driven in part by weakening global manufacturing activity and a gradual transition towards alternative energy sources in key economies. As a result, even geopolitical instability a traditionally bullish driver has been insufficient to offset bearish macroeconomic forces.
          Importantly, this week’s market behavior reflects a broader shift in sentiment where geopolitical events are no longer producing automatic price spikes unless accompanied by clear supply-side disruptions. This evolving dynamic indicates that oil markets are increasingly pricing in medium-term fundamentals over short-term headlines.

          Muted Trading Expected Amid U.S. Holiday

          With the Thanksgiving holiday in the U.S., trading volumes are expected to remain light, potentially exaggerating price movements in thin liquidity conditions. However, barring any immediate supply shocks or unexpected policy moves from OPEC+, oil prices are likely to remain under pressure in the near term.
          In conclusion, the current downturn in crude oil prices is the result of a complex interplay between diplomacy, supply management, and macroeconomic sentiment. While peace negotiations in Ukraine and OPEC+ policy shifts offer potential triggers for future price corrections, the market’s immediate focus remains on the tangible balance between barrels produced and barrels consumed. Until that equation shifts, oil is likely to remain in a subdued pricing environment.

          Source: Bloomberg

          To stay updated on all economic events of today, please check out our Economic calendar
          Risk Warnings and Disclaimers
          You understand and acknowledge that there is a high degree of risk involved in trading. Following any strategies or investment methods may lead to potential losses. The content on the site is provided by our contributors and analysts for information purposes only. You are solely responsible for determining whether any trading assets, securities, strategy, or any other product is suitable for investing based on your own investment objectives and financial situation.
          Add to Favorites
          Share
          FastBull
          Copyright © 2025 FastBull Ltd

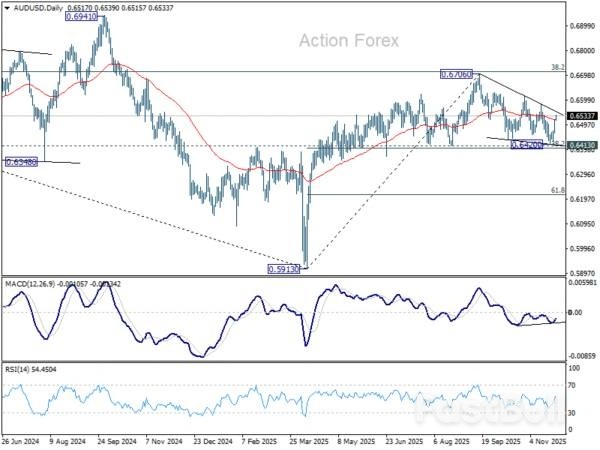
          728 RM B 7/F GEE LOK IND BLDG NO 34 HUNG TO RD KWUN TONG KLN HONG KONG

          TelegramInstagramTwitterfacebooklinkedin
          App Store Google Play Google Play
          Products
          Charts

          Chats

          Q&A with Experts
          Screeners
          Economic Calendar
          Data
          Tools
          Membership
          Features
          Function
          Markets
          Copy Trading
          Latest Signals
          Contests
          News
          Analysis
          24/7
          Columns
          Education
          Company
          Careers
          About Us
          Contact Us
          Advertising
          Help Center
          Feedback
          User Agreement
          Privacy Policy
          Business

          White Label

          Data API

          Web Plug-ins

          Poster Maker

          Affiliate Program

          Risk Disclosure

          The risk of loss in trading financial instruments such as stocks, FX, commodities, futures, bonds, ETFs and crypto can be substantial. You may sustain a total loss of the funds that you deposit with your broker. Therefore, you should carefully consider whether such trading is suitable for you in light of your circumstances and financial resources.

          No decision to invest should be made without thoroughly conducting due diligence by yourself or consulting with your financial advisors. Our web content might not suit you since we don't know your financial conditions and investment needs. Our financial information might have latency or contain inaccuracy, so you should be fully responsible for any of your trading and investment decisions. The company will not be responsible for your capital loss.

          Without getting permission from the website, you are not allowed to copy the website's graphics, texts, or trademarks. Intellectual property rights in the content or data incorporated into this website belong to its providers and exchange merchants.

          Not Logged In

          Log in to access more features

          FastBull Membership

          Not yet

          Purchase

          Become a signal provider
          Help Center
          Customer Service
          Dark Mode
          Price Up/Down Colors

          Log In

          Sign Up

          Position
          Layout
          Fullscreen
          Default to Chart
          The chart page opens by default when you visit fastbull.com