• Trade
  • Markets
  • Copy
  • Contests
  • News
  • 24/7
  • Calendar
  • Q&A
  • Chats
Trending
Screeners
SYMBOL
LAST
BID
ASK
HIGH
LOW
NET CHG.
%CHG.
SPREAD
SPX
S&P 500 Index
6861.94
6861.94
6861.94
6901.43
6857.40
-34.30
-0.50%
--
DJI
Dow Jones Industrial Average
48147.67
48147.67
48147.67
48394.51
48110.85
-219.38
-0.45%
--
IXIC
NASDAQ Composite Index
23292.85
23292.85
23292.85
23445.26
23272.98
-126.22
-0.54%
--
USDX
US Dollar Index
97.970
98.050
97.970
98.180
97.850
+0.090
+ 0.09%
--
EURUSD
Euro / US Dollar
1.17444
1.17451
1.17444
1.17591
1.17198
-0.00030
-0.03%
--
GBPUSD
Pound Sterling / US Dollar
1.34695
1.34704
1.34695
1.34763
1.34014
+0.00020
+ 0.01%
--
XAUUSD
Gold / US Dollar
4319.61
4320.02
4319.61
4373.05
4274.29
-19.50
-0.45%
--
WTI
Light Sweet Crude Oil
57.439
57.469
57.439
58.414
57.330
-0.414
-0.72%
--

Community Accounts

Signal Accounts
--
Profit Accounts
--
Loss Accounts
--
View More

Become a signal provider

Sell trading signals to earn additional income

View More

Guide to Copy Trading

Get started with ease and confidence

View More

Signal Accounts for Members

All Signal Accounts

Best Return
  • Best Return
  • Best P/L
  • Best MDD
Past 1W
  • Past 1W
  • Past 1M
  • Past 1Y

All Contests

  • All
  • Trump Updates
  • Recommend
  • Stocks
  • Cryptocurrencies
  • Central Banks
  • Featured News
Top News Only
Share

Explosion Heard In Syria's Aleppo, Ekhbariya TV Reports

Share

EIA - USA Oct Distillates Demand Up 0.2 Percent Or 9000 Barrels/Day Versus Last Year At 4.14 Million Barrels/Day (Versus 2.2 Percent Rise In Sept)

Share

USA Total Oil Demand In Oct Down 1.7 Percent Or 371000 Barrels/Day Versus Last Year At 20.878 Million Barrels/Day (Versus 2.6 Percent Rise In Sept)- EIA's Petroleum Supply Monthly

Share

EIA - USA Oct Gasoline Demand Down 0.7 Percent Or 60000 Barrels/Day Versus Last Year At 9.01 Million Barrels/Day (Versus 0.3 Percent Fall In Sept)

Share

EIA - USA Product Supplied Of Distillate Fuel Oil Rose To 4.1 Million Barrels/Day In October, The Highest In Three Years

Share

EIA - USA Product Supplied Of Finished Motor Gasoline Rose To 9 Million Barrels/Day In October

Share

EIA - USA Product Supplied Of Crude And Petroleum Products Rose To 20.9 Million Barrels/Day In October

Share

The S&P 500 Fell 0.5%, And The NASDAQ 100 Fell 0.6%

Share

Brent Crude Oil Fell 1.0% On The Day, To $60.71 A Barrel

Share

ICE Cotton Futures Fall 6% In 2025, Their Fourth Consecutive Yearly Decline

Share

Brent Crude Futures Settle At $60.85/Bbl, Down 48 Cents, 0.78 Percent

Share

EIA - USA Natural Gas Liquids Production Falls By 97000 Barrels/Day In Oct To 7.798 Million Barrels/Day (Versus 7.895 Million Barrels/Day In Sept)

Share

EIA - USA Crude-By-Rail Shipments Rose By 30000 Barrels/Day In October

Share

French President Macron Called For Europe To Achieve Independence In The Fields Of AI And Quantum Computing

Share

USA Natural Gas Futures Rise About 2% In 2025, Its Second Straight Yearly Gain

Share

USA Crude Oil Futures Settle At $57.42/Bbl, Down 53 Cents, 0.91 Percent

Share

EIA Data - Total USA/Canada Crude-By-Rail Shipments To W.Coast (Padd 5) Rose To 140000 Barrels/Day In October (Versus 100000 Barrels/Day In September)

Share

EIA Data - Total USA/Canada Crude-By-Rail Shipments At Gulf Coast (Padd 3) Unchanged At 123000 Barrels/Day In October (Versus 123000 Barrels/Day In September)

Share

EIA Data - Total USA/Canada Crude-By-Rail Shipments To E.Coast (Padd 1) Fell To 36000 Barrels/Day In October (Versus 43000 Barrels/Day In September)

Share

EIA Data - Canadian Shipments Of Crude Oil By Rail To United States 80000 Barrels/Day In October

TIME
ACT
FCST
PREV
U.S. S&P/CS 10-City Home Price Index YoY (Oct)

A:--

F: --

P: --

U.S. S&P/CS 10-City Home Price Index MoM (Not SA) (Oct)

A:--

F: --

P: --

U.S. S&P/CS 20-City Home Price Index (Not SA) (Oct)

A:--

F: --

P: --

U.S. S&P/CS 20-City Home Price Index MoM (Not SA) (Oct)

A:--

F: --

P: --

U.S. FHFA House Price Index YoY (Oct)

A:--

F: --

P: --
U.S. Chicago PMI (Dec)

A:--

F: --

P: --

Brazil CAGED Net Payroll Jobs (Nov)

A:--

F: --

P: --

U.S. Weekly Total Oil Rig Count

A:--

F: --

P: --

U.S. Weekly Total Rig Count

A:--

F: --

P: --

FOMC Meeting Minutes
U.S. API Weekly Refined Oil Stocks

A:--

F: --

P: --

U.S. API Weekly Crude Oil Stocks

A:--

F: --

P: --

U.S. API Weekly Cushing Crude Oil Stocks

A:--

F: --

P: --

U.S. API Weekly Gasoline Stocks

A:--

F: --

P: --

South Korea CPI YoY (Dec)

A:--

F: --

P: --

China, Mainland NBS Manufacturing PMI (Dec)

A:--

F: --

P: --

China, Mainland Composite PMI (Dec)

A:--

F: --

P: --

China, Mainland NBS Non-manufacturing PMI (Dec)

A:--

F: --

P: --

China, Mainland Caixin Manufacturing PMI (SA) (Dec)

A:--

F: --

P: --

Turkey Trade Balance (Nov)

A:--

F: --

P: --

South Africa Trade Balance (Nov)

A:--

F: --

P: --

U.S. Initial Jobless Claims 4-Week Avg. (SA)

A:--

F: --

P: --
U.S. Weekly Continued Jobless Claims (SA)

A:--

F: --

P: --
U.S. Weekly Initial Jobless Claims (SA)

A:--

F: --

P: --
U.S. EIA Weekly Cushing, Oklahoma Crude Oil Stocks Change

A:--

F: --

P: --

U.S. EIA Weekly Crude Demand Projected by Production

A:--

F: --

P: --

U.S. EIA Weekly Gasoline Stocks Change

A:--

F: --

P: --

U.S. EIA Weekly Crude Stocks Change

A:--

F: --

P: --

U.S. EIA Weekly Heating Oil Stock Changes

A:--

F: --

P: --

U.S. EIA Weekly Crude Oil Imports Changes

A:--

F: --

P: --

U.S. EIA Weekly Natural Gas Stocks Change

A:--

F: --

P: --

South Korea Trade Balance Prelim (Dec)

--

F: --

P: --

South Korea IHS Markit Manufacturing PMI (SA) (Dec)

--

F: --

P: --

Indonesia IHS Markit Manufacturing PMI (Dec)

--

F: --

P: --

India HSBC Manufacturing PMI Final (Dec)

--

F: --

P: --

Russia IHS Markit Manufacturing PMI (Dec)

--

F: --

P: --

U.K. Nationwide House Price Index MoM (Dec)

--

F: --

P: --

U.K. Nationwide House Price Index YoY (Dec)

--

F: --

P: --

Turkey Manufacturing PMI (Dec)

--

F: --

P: --

Italy Manufacturing PMI (SA) (Dec)

--

F: --

P: --

Euro Zone Manufacturing PMI Final (Dec)

--

F: --

P: --

Euro Zone M3 Money Supply (SA) (Nov)

--

F: --

P: --

Euro Zone 3-Month M3 Money Supply YoY (Nov)

--

F: --

P: --

Euro Zone Private Sector Credit YoY (Nov)

--

F: --

P: --

Euro Zone M3 Money Supply YoY (Nov)

--

F: --

P: --

U.K. Manufacturing PMI Final (Dec)

--

F: --

P: --

India Deposit Gowth YoY

--

F: --

P: --

Brazil IHS Markit Manufacturing PMI (Dec)

--

F: --

P: --

U.S. MBA Mortgage Application Activity Index WoW

--

F: --

P: --

Canada Manufacturing PMI (SA) (Dec)

--

F: --

P: --

U.S. IHS Markit Manufacturing PMI Final (Dec)

--

F: --

P: --

Mexico Manufacturing PMI (Dec)

--

F: --

P: --

U.S. Weekly Treasuries Held by Foreign Central Banks

--

F: --

P: --

Philadelphia Fed President Henry Paulson delivers a speech
Japan Manufacturing PMI Final (Dec)

--

F: --

P: --

China, Mainland Caixin Composite PMI (Dec)

--

F: --

P: --

China, Mainland Caixin Services PMI (Dec)

--

F: --

P: --

Indonesia Trade Balance (Nov)

--

F: --

P: --

Indonesia Core Inflation YoY (Dec)

--

F: --

P: --

Indonesia Inflation Rate YoY (Dec)

--

F: --

P: --

Saudi Arabia IHS Markit Composite PMI (Dec)

--

F: --

P: --

Q&A with Experts
    • All
    • Chatrooms
    • Groups
    • Friends
    ANor Epys flag
    HFM
    rawa ronte flag
    ANor Epys
    HFM
    @ANor EpysWow, that's the same thing... but why is the chart still moving in the trading view?
    ANor Epys flag
    What do you use? This is Fastbull, so I'm curious about BeeMarket.
    ANor Epys flag
    rawa ronte
    @rawa ronteYes, it may be different for each broker, but it's not a problem.
    3207570 flag
    Buy Gold limit 4404 to next resistance .. thank me later
    ANor Epys flag
    Yes, okay, I have 2 strong buyer zones in that area.
    rawa ronte flag
    3207570
    Buy Gold limit 4404 to next resistance .. thank me later
    @Pengunjung3207570how can I buy... my broker is closed😅
    rawa ronte flag
    ANor Epys
    Yes, okay, I have 2 strong buyer zones in that area.
    @ANor EpysHow much can I buy it for?
    V0EDWL8NGW flag
    btc running profit
    Anh Minh flag
    Can someone explain this to me?
    Freddy94_ flag
    ANor Epys
    Yes, okay, I have 2 strong buyer zones in that area.
    @ANor Epys show me screenshot my friend
    Freddy94_ flag

    Freddy94_

    ID: 1815108

    Share Chart:XAUUSD, H1
    Chart
    EVMKQR7N0G flag
    hello
    luigi flag
    EVMKQR7N0G
    hello
    @EVMKQR7N0Ghi
    luigi flag
    happy new year
    Johnson Le flag
    Happy new year
    Gerald flag
    happy new year 🕛
    王涵 flag
    Why is the chart not moving?
    2953273 flag
    hello
    Raktim flag
    hi
    Type here...
    Add Symbol or Code

      No matching data

      All
      Trump Updates
      Recommend
      Stocks
      Cryptocurrencies
      Central Banks
      Featured News
      • All
      • Russia-Ukraine Conflict
      • Middle East Flashpoint
      • All
      • Russia-Ukraine Conflict
      • Middle East Flashpoint
      Search
      Products

      Charts Free Forever

      Chats Q&A with Experts
      Screeners Economic Calendar Data Tools
      Membership Features
      Data Warehouse Market Trends Institutional Data Policy Rates Macro

      Market Trends

      Market Sentiment Order Book Forex Correlations

      Top Indicators

      Charts Free Forever
      Markets

      News

      News Analysis 24/7 Columns Education
      From Institutions From Analysts
      Topics Columnists

      Latest Views

      Latest Views

      Trending Topics

      Top Columnists

      Latest Update

      Signals

      Copy Rankings Latest Signals Become a signal provider AI Rating
      Contests
      Brokers

      Overview Brokers Assessment Rankings Regulators News Claims
      Broker listing Forex Brokers Comparison Tool Live Spread Comparison Scam
      Q&A Complaint Scam Alert Videos Tips to Detect Scam
      More

      Business
      Events
      Careers About Us Advertising Help Center

      White Label

      Data API

      Web Plug-ins

      Affiliate Program

      Awards Institution Evaluation IB Seminar Salon Event Exhibition
      Vietnam Thailand Singapore Dubai
      Fans Party Investment Sharing Session
      FastBull Summit BrokersView Expo
      Recent Searches
        Top Searches
          Markets
          News
          Analysis
          User
          24/7
          Economic Calendar
          Education
          Data
          • Names
          • Latest
          • Prev

          View All

          No data

          Scan to Download

          Faster Charts, Chat Faster!

          Download App
          English
          • English
          • Español
          • العربية
          • Bahasa Indonesia
          • Bahasa Melayu
          • Tiếng Việt
          • ภาษาไทย
          • Français
          • Italiano
          • Türkçe
          • Русский язык
          • 简中
          • 繁中
          Open Account
          Search
          Products
          Charts Free Forever
          Markets
          News
          Signals

          Copy Rankings Latest Signals Become a signal provider AI Rating
          Contests
          Brokers

          Overview Brokers Assessment Rankings Regulators News Claims
          Broker listing Forex Brokers Comparison Tool Live Spread Comparison Scam
          Q&A Complaint Scam Alert Videos Tips to Detect Scam
          More

          Business
          Events
          Careers About Us Advertising Help Center

          White Label

          Data API

          Web Plug-ins

          Affiliate Program

          Awards Institution Evaluation IB Seminar Salon Event Exhibition
          Vietnam Thailand Singapore Dubai
          Fans Party Investment Sharing Session
          FastBull Summit BrokersView Expo

          US Markets Reveal Wide YTD Dispersion Beneath Strong Headline Equity Returns

          Adam

          Economic

          Summary:

          U.S. markets show strong headline gains but wide YTD dispersion, with large caps leading, smaller stocks lagging, muted returns elsewhere, and Fed minutes signaling a slower, more cautious path for rate cuts.

          YTD returns across major U.S. asset classes continue to reflect a highly concentrated market. The Finviz chart below does a nice job illustrating YTD returns across a wide array of futures contracts. Large-caps dominate YTD equity returns, while small- and mid-cap stocks lag amid tighter financial conditions and slower earnings growth.
          Outside of equities, YTD returns have been more muted. Bonds have stabilized as yields eased from their highs, offering modest diversification benefits, while cash remains competitive thanks to elevated short-term rates. Commodities and real assets have delivered mixed YTD returns as global growth slows and inflation pressures fade.
          The takeaway is clear: YTD returns viewed at a high level mask wide dispersion beneath the surface, making positioning and diversification far more critical than broad market exposure.
          US Markets Reveal Wide YTD Dispersion Beneath Strong Headline Equity Returns_1
          Fed Minutes Point to a Slower Path for Rate Cuts
          Minutes from the Fed’s December meeting show policymakers growing more cautious about cutting rates further in early 2026. Several officials noted that the decision to ease in December was “finely balanced,” with some preferring to hold rates steady as inflation progress shows signs of stalling.
          While labor market conditions have softened, economic growth and consumer spending remain resilient, complicating the policy outlook. As a result, many participants favored keeping rates unchanged for “some time” while assessing incoming data. That stance aligns with the Fed’s projections, which point to a slower and more data-dependent path for future cuts.

          Source: investing

          To stay updated on all economic events of today, please check out our Economic calendar
          Risk Warnings and Disclaimers
          You understand and acknowledge that there is a high degree of risk involved in trading. Following any strategies or investment methods may lead to potential losses. The content on the site is provided by our contributors and analysts for information purposes only. You are solely responsible for determining whether any trading assets, securities, strategy, or any other product is suitable for investing based on your own investment objectives and financial situation.
          Add to Favorites
          Share

          Oil News: Oil Demand Concerns Persist Despite Geopolitical Supply Disruption Fears

          Adam

          Commodity

          Crude Edges Higher in Thin Holiday Trade After 61.8% Rebound From December Low

          Light crude oil futures are inching higher on Wednesday on below average volume. The price action suggests traders may have packed it in for the New Year’s holiday.
          The month began with a steep drop from $60.36 on December 5 to $54.84 by December 16. Since that low was reached, however, prices have rebounded more than 61.8% to $58.88 on December 26 before pulling back to $56.65 the same day.

          Geopolitical Tensions Drive Short-Covering Rally Amid Bearish Supply Outlook

          The sell-off was fueled by a bearish supply outlook, while the rebound represents short-covering tied to escalating tensions between Russia and Ukraine, and the United States and Venezuela. Shorts took protection out of fear of a supply disruption. Tensions between Saudi Arabia and Yemen also contributed to the bid in the market this holiday-shortened week.

          Key Technical Levels: 50-Day MA at $58.78 Holds Cards for Direction

          Oil News: Oil Demand Concerns Persist Despite Geopolitical Supply Disruption Fears_1
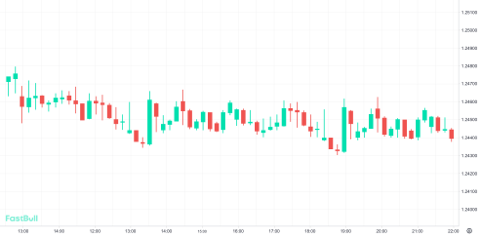
Daily Light Crude Oil Futures

          Today, traders will be looking for support at the first 50% level at $57.60. If that fails, they will likely lean on $56.86 to $56.65.
          On the upside, the resistance zone is $58.62 to $59.51. Inside this area is the 50-day moving average at $58.78. It is both resistance and a potential trigger point for an acceleration to the upside. More importantly, it is my short-term trend indicator.
          A breakout over the 50-day MA may not be enough to fuel a strong rally into the 200-day MA at $60.45. I think we are going to need to see a recovery and a support base built above the 50-day MA before we can be confident there are real buyers in there driving the price action.
          But for a bullish technical outlook to align with a bullish fundamental outlook, the supply/demand fundamentals are going to have to change. At this time, they are bearish because of oversupply. A supply disruption could alleviate some of this pressure, but disruptions tend to be short-term in nature.

          WTI Set for 19% Annual Decline as Oversupply Dominates Year-End Action

          Early expectations for 2026 are bearish, but with lingering geopolitical tensions propping up prices. Oil prices may be close to unchanged today, but for the year, they are set to fall more than 15%. Oversupply was the major concern throughout the year, driving prices lower until the nearby futures contract hit its lowest level since 2021 in December.
          Reuters is reporting that Light crude oil futures are down nearly 18% for the year, their most substantial annual percentage decline since 2020. Brent is also on track to finish a third year of losses, their longest-ever losing streak. West Texas Intermediate (WTI) crude, also known as Light Crude Oil, is headed for a 19% annual decline.

          2026 Forecast: Bearish Q1 Followed by Recovery, OPEC Cuts Limit Downside

          My outlook for 2026 calls for lower prices in the first quarter, with WTI hovering near $55.00 to $50.00 per barrel, then a recovery later in the year to $60.00 to $65.00.
          Volatility is likely to be skewed to the upside because of the possibility of an escalation in the geopolitical issues and the possibility of a prolonged supply disruption.
          What this means is that I don’t see prices falling below $50.00 for a lingering period, but the odds are we could spend some time over $65.00 if supply is disrupted for a long time. I believe that if prices were to fall substantially, OPEC would step in and cut production.

          Source: fxempire

          Risk Warnings and Disclaimers
          You understand and acknowledge that there is a high degree of risk involved in trading. Following any strategies or investment methods may lead to potential losses. The content on the site is provided by our contributors and analysts for information purposes only. You are solely responsible for determining whether any trading assets, securities, strategy, or any other product is suitable for investing based on your own investment objectives and financial situation.
          Add to Favorites
          Share

          30 Numbers From 2025 That Are Almost Too Crazy To Believe

          Devin

          Economic

          2025 has truly been a historic year. No matter which side of the fence that you are on, nobody can deny that we have witnessed seismic political changes over the last 12 months. Meanwhile, the AI revolution is transforming our lives in ways that we don't even understand. But despite all of our advanced technology, we can't stop the endless barrage of natural disasters that has been pummeling us in 2025, and hunger continues to spread all over the globe. Of course war has been a major theme from the very beginning of the year to the very end of the year. Humanity has been facing one major crisis after another, and people are steadily getting angrier and more frustrated.

          Our world is changing at a pace that is absolutely breathtaking.

          If you always wanted to live in "interesting" times, you have certainly gotten your wish.

          The following are 30 numbers from 2025 that are almost too crazy to believe…

          #1 As 1999 began, a Gallup survey found that 70 percent of Americans were satisfied with how things were going in the United States. As 2025 ends, only 24 percent of Americans are satisfied with how things are going in the United States.

          #2 In 1980, the fact that the U.S. national debt had reached a trillion dollars was a really big deal. But now our national debt has surpassed the 38 trillion dollar mark and there is seemingly no end in sight.

          #3 Globally, the total amount of debt in the world has reached an almost unbelievable total of 337 trillion dollars.

          #4 In 2025, more than half of all of the nations on the entire planet were either directly involved in military conflict or were funding it.

          #5 At the start of 2025, you could purchase an ounce of silver for about 30 dollars. As 2025 ends, an ounce of silver will cost you more than 70 dollars.

          #6 Crypto investors lost about $800,000,000,000 during the month of November alone.

          #7 After all this time, the Department of Justice is claiming that they have just "discovered" a million more Epstein documents.

          #8 In 2025, researchers in the United States and South Korea developed a version of the bird flu that has a 100 percent death rate in mammals.

          #9 According to the latest National Customer Rage Survey, 77 percent of U.S. consumers say that they have had a product or service problem within the last 12 months. That is a brand new all-time record high.

          #10 Earlier this year, we witnessed 494 earthquakes of magnitude 5.0 or greater within a 30 day period. That was about 4 times as many earthquakes of magnitude 5.0 or greater than we normally experience in a typical month.

          #11 Globally, natural disasters caused a total of $120,000,000,000 in economic damage in 2025.

          #12 The number of Americans that are dealing with food insecurity has almost doubled since 2021.

          #13 The United Nations is warning that nearly 10 percent of the entire population of the globe is now going to bed hungry each night.

          #14 Approximately 1.2 million foreign students are currently attending colleges and universities in the United States. How many U.S. students have been denied admission in order to make room for those students at our best schools?

          #15 In 2019, you could get a cheeseburger at McDonald's for a dollar. Today, the average price of a cheeseburger at McDonald's is $3.15.

          #16 Since 2019, the annual income needed to afford a median-priced home in rural U.S. counties has more than doubled.

          #17 According to a survey that was conducted by PNC Bank, 67 percent of U.S. workers are now living paycheck to paycheck.

          #18 Investopedia has determined that it now takes approximately 5 million dollars to live the American Dream over the course of a lifetime.

          #19 One study discovered that approximately 42 percent of Americans that belong to Generation Z have been diagnosed with "anxiety, depression, ADHD, PTSD" or some other mental health condition.

          #20 One recent survey found that 70 percent of U.S. adults are currently taking at least one pharmaceutical drug, and nearly a quarter of U.S. adults are currently taking at least four pharmaceutical drugs.

          #21 According to the CDC, an American now dies by suicide every 11 minutes.

          #22 Approximately 20 percent of high school students in the United States have had a relationship with an AI chatbot.

          #23 One recent survey found that almost two-thirds of all church leaders that prepare sermons "use AI tools in their sermon writing process".

          #24 Well over 50 percent of the global population lives in a nation where Christians are being violently persecuted.

          #25 U.S. farmers are facing the worst economic downturn that they have experienced in at least 50 years.

          #26 The size of the U.S. cattle herd has dropped to the lowest level in about 75 years.

          #27 According to Challenger, Gray & Christmas, U.S. employers have announced a grand total of almost 1.2 million job cuts in 2025.

          #28 The McKinsey Global Institute is warning that approximately 40 percent of all U.S. workers could potentially be replaced by AI.

          #29 In more than 50 percent of the nations on the entire planet, the total fertility rate is now below replacement level.

          #30 A recent YouGov survey discovered that nearly half of the U.S. population believes that a nuclear war is likely within the next 10 years.

          The pace of global events has accelerated significantly over the past year.

          It really does feel like we are building up to some sort of a crescendo.

          We are living at a time of a "perfect storm", and we just keep getting hammered by one crisis after another.

          As a result, much of the population has become numb to it all.

          Never before in human history have we been subjected to such an emotional overload.

          When you are being pulled in so many directions emotionally, it can be really easy to give in to the temptation to go numb.

          But I would encourage my readers not to do that.

          It is when times are the darkest that light is needed the most.

          As things get even darker in 2026, choose to be a light to those around you.

          All of human history has been building up to this time, and we get to be here for it.

          There is nowhere else that I would rather be than right here, and there is no other time that I would have rather lived than right now.

          Don't let all of the chaos that is going on all around us get you down.

          You were born for such a time as this, and now is the time to become everything that you were created to be.

          Source: Zero Hedge

          To stay updated on all economic events of today, please check out our Economic calendar
          Risk Warnings and Disclaimers
          You understand and acknowledge that there is a high degree of risk involved in trading. Following any strategies or investment methods may lead to potential losses. The content on the site is provided by our contributors and analysts for information purposes only. You are solely responsible for determining whether any trading assets, securities, strategy, or any other product is suitable for investing based on your own investment objectives and financial situation.
          Add to Favorites
          Share

          Engine of markets and US growth: AI steamrolled everything

          Adam

          Economic

          2025's performance is barely believable when you remember how Wall Street started the year, hit head-on by Donald Trump's tariffs. In early April, the S&P 500 even briefly slipped into a bear market (a 20% correction from peak to trough). A few months later, Donald Trump slightly eased the tariffs bill. And above all, US companies kept investing aggressively in artificial intelligence.
          All-in
          Capex by the five largest hyperscalers (Amazon, Alphabet, Meta, Microsoft and Oracle) is expected to reach nearly $400 billion in 2025. And that figure is set to rise in the years ahead. The central question now is return on investment.
          At this stage, the market seems fairly confident on that front. The cloud businesses of Amazon, Microsoft and Google (the three main players in this market) continue to grow rapidly. In the latest quarter, Azure's growth (Microsoft) was 40%, AWS's 20%, and Google's 32%. Those are striking numbers for companies whose market capitalizations are measured in trillions of dollars.
          Despite these growth rates, concerns about return on investment are legitimate. But the hyperscalers keep arguing they need to accelerate, that the main risk is under-investing, and that their main problem is a lack of capacity (data centers, chips…). It all feels a bit like venture-capital logic: you go for it because there is a lot to win at the end, even if some investments do not pay off.
          All the more so because these companies remain cash machines. And so the cost of being wrong is not that high. A recent example illustrates this perfectly: the metaverse. It was Facebook's big bet, and the company even renamed itself Meta in late 2021. It was more of a failure because, according to Financial Times calculations, the Reality Labs division would have lost nearly $70 billion cumulatively by the end of 2024. Yet that failed pivot only cost the company 12 to 18 months in the market wilderness. A few quarters in which the stock was dead money (no one wanted it anymore), before the AI train put the company back on track.
          Do not forget to return the money
          But that last point may no longer be so obvious, and the market has not yet realized it. For about a decade, these stocks have been investor darlings, mainly for two reasons: they are asset light (companies with few physical assets and therefore not burdened by the investments that come with them) and they are cash machines, able to return tens of billions through share buybacks.
          But does the AI shift not make that investment thesis obsolete? Because now, hundreds of billions of dollars must be spent to build physical infrastructure, namely data centers. Capital expenditures amortized over several years. But most of the investments are Nvidia chips, consumables that will likely need to be replaced fairly quickly. The hyperscalers believe server lifespans could run up to six years, which is far from obvious.
          All of this raises the question of shareholder returns. Will it be possible to roll out large share buyback programs again if the vast majority of cash flows must fund capital expenditures? According to BofA calculations, nearly 70% of hyperscalers' cash flow will be swallowed by capex this year and 80% next year. Over the previous ten years, it was more like 30% to 50%.
          Engine of markets and US growth: AI steamrolled everything_1
          In the same boat
          These companies therefore now have to turn to debt, which was not the case in the past. At the end of September, Oracle issued $18 billion in bonds; Meta raised $30 billion in late October; Alphabet $25 billion in early November; and Amazon announced in mid-November its intention to raise $15 billion. Nothing dramatic for companies with extremely strong balance sheets, but it is still a sign they need to seek financing elsewhere, that they are no longer able to shoulder all investments on their own.
          Beyond the amounts to finance and the growing reliance on debt, it is the circular nature of this ecosystem that raises questions: customers financing their suppliers, equity stakes taken in every direction… And in the middle of all that, one player: OpenAI, which is not profitable but whose funding needs are estimated at $1.4 trillion by 2029.
          Engine of markets and US growth: AI steamrolled everything_2
          The ecosystem's circularity may be the main risk. Because then, a slowdown at one player can turn into a vicious circle. But for now, the circle is virtuous. One firm's capex becomes another's revenue, and growth is there. Valuations are pricing in a bright future for everyone, and artificial intelligence carried the S&P 500 this year to the doorstep of 7,000 points and the Nasdaq beyond 25,000 points.
          A K-shaped economy
          And it is not just Wall Street that is being lifted by artificial intelligence; it is now the main engine of US growth. In the first half of 2025, GDP growth was 1.6%. Growth driven by AI-related investment, whose contribution to growth was 1.4 percentage points in the 1 st quarter and 1.5 points in the second quarter, according to Bank of America estimates.
          Engine of markets and US growth: AI steamrolled everything_3
          In short, excluding AI investment, GDP growth is almost zero over the first half. So there are a few sectors buoyed by the AI boom and the rest of the economy is stagnating. A finding confirmed by the data on capital spending.
          Engine of markets and US growth: AI steamrolled everything_4
          The AI boom has therefore brought back to life a concept that emerged with the Covid pandemic: the K-shaped economy. An economy in which some sectors rebounded strongly while others kept sinking. Today, while the US economy appears to be holding up well, it is in reality an economy in which AI drives investment and consumption depends mainly on the wealthiest slice.
          And the two are linked. The AI boom is driving a surge in equity markets. A surge that translates into an increase in household wealth, especially among the wealthiest, who own the most stocks. And when your wealth rises, you are encouraged to spend more. That is the wealth effect.
          This K-shaped economy concept also explains what we see in opinion polls: a majority of Americans dissatisfied with the economic situation. Despite Wall Street records, and despite strong economic growth. GDP in the third quarter rose 4.3% at an annualized rate. But at the same time, the "current economic conditions" component of the Michigan consumer sentiment index hit its lowest level in ten years in December. Because Americans are facing a cooling labor market (meaning more difficulty finding a job and fewer pay rises) and still-high prices. According to Politico, nearly half of Americans (46%) believe the cost of living is the worst they can remember.

          Source: marketscreener

          To stay updated on all economic events of today, please check out our Economic calendar
          Risk Warnings and Disclaimers
          You understand and acknowledge that there is a high degree of risk involved in trading. Following any strategies or investment methods may lead to potential losses. The content on the site is provided by our contributors and analysts for information purposes only. You are solely responsible for determining whether any trading assets, securities, strategy, or any other product is suitable for investing based on your own investment objectives and financial situation.
          Add to Favorites
          Share

          Russia's Top General Tells Troops To Keep Carving Out 'buffer Zones' In Ukraine

          James Whitman

          Political

          Russia-Ukraine Conflict

          ● Russia's top general visits command post
          ● Says buffer zones inside Ukraine needed to protect adjacent Russian land
          ● Ukraine says such buffer zones represent illegal land grab

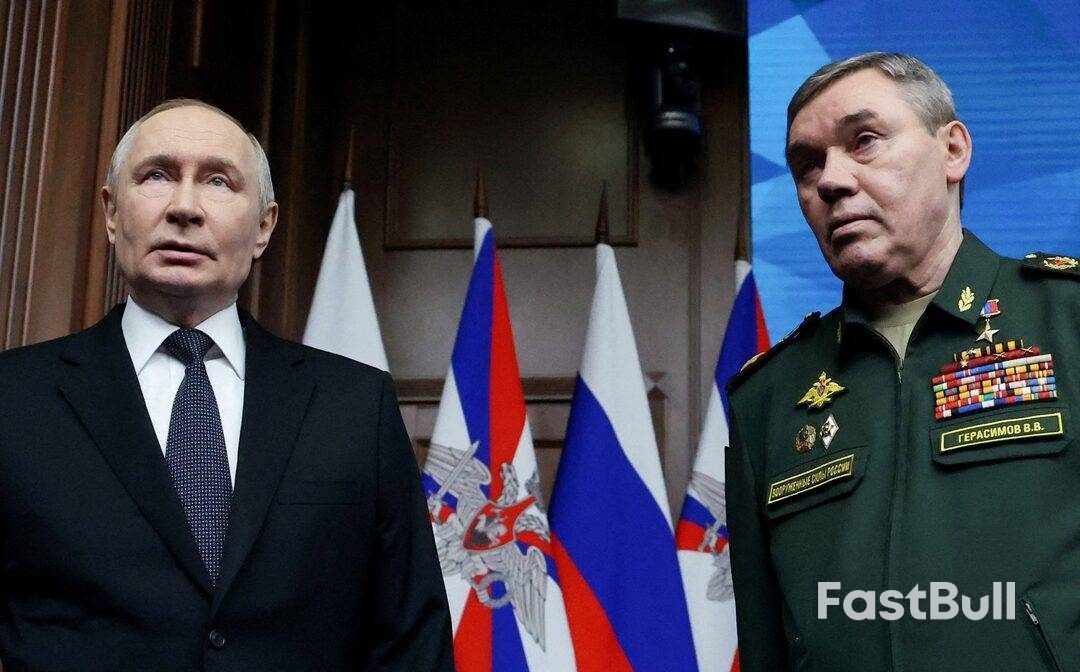
          Russia's top general has told troops to keep carving out buffer zones in Ukraine's Sumy and Kharkiv regions in order to protect civilians in Russia's neighbouring Kursk and Belgorod regions from Ukrainian attacks.

          General Valery Gerasimov, chief of the General Staff, made the comments during a visit to a command post belonging to Russia's "North" military grouping, which the Defence Ministry publicised on Wednesday.

          The ministry did not say when Gerasimov made the comments or where the post was located.

          There was no immediate reaction from Ukraine to Gerasimov's comments, but Kyiv has repeatedly condemned Moscow's efforts to carve out buffer zones inside its territory, accusing Russia of using the pretext of security zones to illegally grab more of its territory.

          Ukrainian President Volodymyr Zelenskiy has said Moscow's plans for Sumy and Kharkiv are "mad" and will be resisted as Ukraine defends the two regions.

          Gerasimov said Russian forces had taken control of around 950 square kilometres (366 square miles) in the two provinces, including 32 settlements.

          Reuters could not verify his battlefield assertions.

          Russian President Vladimir Putin affirmed the idea of buffer zones after Ukraine staged a surprise incursion into Russia's Kursk region in August 2024, which Moscow's forces then repelled in months of fierce fighting which saw both sides suffer heavy losses.

          In a Kremlin meeting on December 29, Putin called work to carve out buffer zones very important and said it needed to continue in the new year.

          Source: Reuters

          Risk Warnings and Disclaimers
          You understand and acknowledge that there is a high degree of risk involved in trading. Following any strategies or investment methods may lead to potential losses. The content on the site is provided by our contributors and analysts for information purposes only. You are solely responsible for determining whether any trading assets, securities, strategy, or any other product is suitable for investing based on your own investment objectives and financial situation.
          Add to Favorites
          Share

          Markets in 2025: Gold, Goldilocks and the dollar bears

          Adam

          Economic

          Most investors knew this year would be different given Donald Trump's return to power in the world's biggest economy, but few predicted how wild the ride would get, or the end results.
          World stocks (.MIWD00000PUS) recovered from April's "Liberation Day" tariffs' crash and have risen 21% in 2025 - a sixth year of double-digit gains in the last seven - but look elsewhere and the surprises jump out.
          Gold , the ultimate safe port in a storm, has surged nearly 70% in its best year since the 1979 oil crisis, while the U.S. dollar (.DXY) is down nearly 10%, oil is off almost 17%, yet the junkiest of junk bonds have soared in the debt markets.
          The "Magnificent Seven" U.S. tech giants seem to have lost some of their sparkle since artificial intelligence darling Nvidia (NVDA.O) became the world's first $5 trillion company in October, and bitcoin has suddenly lost a third of its value too.
          DoubleLine fund manager Bill Campbell described 2025 as "the year of change and the year of surprises", with the big moves all "intertwined" in the same seismic issues - the trade war, geopolitics and debt.
          "If you were to tell me a priori that Trump was going to come in and use very aggressive trade policies and sequence it the way he has, I would not have expected valuations to be as tight or lofty as they are today," Campbell said.
          Markets in 2025: Gold, Goldilocks and the dollar bears_1

          This chart shows the MSCI World Stocks Index market cap over 2025.

          A 55% boom in shares of European weapons makers (.SXPARO) has been driven by Trump too, following signals he will scale back Europe's military protection forcing the region - and other NATO members - to rearm.
          That also helped drive the best year for European banking shares since 1997 (.SX7P) , while there's also been a 70% leap in South Korean stocks (.KS11) and near-100% returns on defaulted Venezuelan bonds. Silver and platinum are up an even more dazzling 165% and 145% respectively.
          A trio of U.S. rate cuts, Trump's criticisms of the Federal Reserve and broader debt worries have all impacted bond markets.
          The U.S. president's "big, beautiful" spending plans led the 30-year Treasury yield to surge past 5.1% to its highest since 2007 in May. Though it is now back at 4.8%, the re-expanding gap to short-term rates that bankers dub "term premia" is causing jitters again.
          Japan's 30-year yields are back at a record high too. The juxtaposition here is that global bond market volatility is at a four-year low (.MOVE) , and local-currency emerging market debt has had its best year since 2009.
          AI is all part of the debt mix too as firms borrow to invest. Goldman Sachs estimates the big AI "hyperscalers" have spent nearly $400 billion this year and will spend almost $530 billion next year.
          Markets in 2025: Gold, Goldilocks and the dollar bears_2

          Gold, guns and AI have driven up world markets this year

          ALL THAT GLITTERS
          The dollar's decline leaves the euro up almost 14% in 2025 and the Swiss franc 14.5% higher. China's yuan has just broken through 7 per dollar, while the yen's December bashing leaves it flat for the year.
          Trump's re-engagement with Russian President Vladimir Putin has helped the rouble surge 40%, although it remains heavily restricted by sanctions and just leads the 34% tear from gold producer Ghana's cedi.
          Poland's zloty, the Czech crown and Hungarian forint are all between 15% and 20% stronger and Taiwan's dollar jumped 8% in just two days in May, while Mexico's peso and Brazil's peso both shrugged off the trade war drama to score double-digit gains.
          "We don't think this is just a short-term phenomenon," said Jonny Goulden, head of EM fixed income strategy research at J.P. Morgan. "We think a bear market cycle for EM currencies that has lasted for 14 years now, has turned here."
          Argentina has been another standout. Its markets were hammered when President Javier Milei suffered a thumping regional election defeat in September, but then went wild weeks later when a $20 billion pledge from Trump helped Milei romp national midterms.
          In crypto, Trump launched a memecoin and gave a presidential pardon to Binance founder Changpeng Zhao. Bitcoin hit an all-time high above $125,000 in October but then crashed to $88,000 and will end the year down nearly 7%.
          Markets in 2025: Gold, Goldilocks and the dollar bears_3

          An arrow chart with the title 'Emerging market currency moves against the US dollar'

          NEW YEAR, NEW FEARS
          It won't be a quiet start to next year either.
          Trump is already revving up for midterm elections in November and is expected to name his new head of the Federal Reserve shortly, which could be crucial for the central bank's independence.
          Investors will be looking to see if China's economy can push on. Israel will hold elections before the end of October, which will keep the fragile Gaza ceasefire in focus. Ending the Ukraine war remains devilishly difficult, while Viktor Orban faces his toughest election yet in Hungary in April and Colombia and Brazil have pivotal elections starting in May and October respectively.
          And then there are all of the AI unknowns.
          Satori Insights founder Matt King said markets are going into 2026 in a "remarkable" situation in terms of valuations and with leaders like Trump "looking for excuses" to give voters money through stimulus or tax breaks.
          "There's just this ongoing risk that we are pushing the limits of what easy money can do," King said.
          "Already you are starting to see the cracks appearing around the edges, in terms of growth of term premia (in the bond market), in terms of bitcoin suddenly selling off and in terms of the ongoing gold rally."

          Source: reuters

          To stay updated on all economic events of today, please check out our Economic calendar
          Risk Warnings and Disclaimers
          You understand and acknowledge that there is a high degree of risk involved in trading. Following any strategies or investment methods may lead to potential losses. The content on the site is provided by our contributors and analysts for information purposes only. You are solely responsible for determining whether any trading assets, securities, strategy, or any other product is suitable for investing based on your own investment objectives and financial situation.
          Add to Favorites
          Share

          Retail investors close out one of their best years ever. How they beat Wall Street at their own game

          Adam

          Economic

          Retail investors have had a gangbuster year in 2025.
          Mom-and-pop investors bought the dip at key points this year, providing strong returns as the market climbed to all-time highs. Once thought of as unsophisticated and easily duped, a new breed of retail investor is giving the professionals who have long dismissed them a run for their money, according to investors and market data analysts interviewed by CNBC.
          "Retail is just getting smarter, and they're getting hardened to the market," said Mark Malek, investing chief at Siebert Financial. In other words: These investors "really are growing up."
          Individual traders bought the dip at a faster clip during market drawdowns early in the year, according to JPMorgan quant analyst Arun Jain, who called it a "successful year" for this group. It was an effective strategy: 2025 is shaping up to be the second-best year since at least the early 1990s for dip-buying, per data from Bespoke Investment Group data published this month.
          From May onward, JPMorgan said these investors shifted their focus from single stocks to ETFs. The group particularly dove into the SPDR Gold Shares (GLD) fund, with JPMorgan finding 2025 inflows topped the last five years combined. The gold-focused ETF has seen a record-setting surge of more than 65% this year amid the precious metal's rise to all-time highs.
          The result: retail investors' single-stock portfolios have seen stronger profit-to-loss ratios than baskets tied to artificial intelligence and software run by JPMorgan, according to data from the bank released earlier this month. Everyday investors' exchange-traded fund holdings had much higher profit rates than the SPDR S&P 500 ETF Trust (SPY) and Invesco QQQ Trust (QQQ) , the firm found.
          'TACO' and buying the dip
          A significant driver of their strong performance this year goes back to a week in April that had investors of all sizes on the edge of their seats.
          Big money ran for the hills as President Donald Trump first unveiled his plan for broad and steep tariffs on most foreign countries on April 2, which he dubbed "liberation day." The S&P 500 briefly slipped into bear market territory as institutional investors worried the policy would drive up inflation and weigh on corporate earnings.
          But retail investors jumped head first into the turbulence. They bought a record of more than $3 billion in equities on net on April 3 — even as the S&P 500 fell around 5% in the session, according to VandaTrack. Elevated buying continued the following day despite the benchmark average dropping another 6%.
          Trump put most of his steepest duties on pause April 9, exactly one week after "liberation day." Small-scale stockholders were on the ground floor of the S&P 500's 9.5% surge that session. The broad index has climbed more than 21% since April 2. It's on track to finish 2025 higher by more than 17% after hitting several new intraday and closing records.
          "We often talk about retail as being sort of late to the party," said Viraj Patel, Vanda's deputy head of research. "But this has been the polar opposite."
          At Siebert, Malek said the professionals were starting to get nervous as the S&P 500 fell below 5,000 during the tariff-induced sell-off. But their retail traders continued buying all the way down, drawing on their past successes in increasing exposure amid pullbacks rather than panicking.
          Retail investors "have been more right about the market and how to react to, certainly, a lot of the emotionally driven trades of the year," Malek said. "They've been much more accurate in their dealings than my colleagues in the institutional space."
          Beyond believing in buying the dip, these traders also benefited from a conviction that the "TACO trade" would pan out, according to Zhi Da, a professor of finance at the University of Notre Dame whose research focuses on retail trader activity.
          Known in full as "Trump Always Chickens Out," this strategy encourages investors to buy into stocks when policy decisions from the White House cause market downturns, with the expectation that the actions will be reversed. On the other hand, institutional counterparts have been more cautious about trading around Trump's policies, Da said.
          He acknowledged there was some luck involved and that 2025 was an "exception" to the rule. Typically, retail investors buy market dips too late and don't benefit as much on average, he said.
          A 'more sophisticated' investor
          Retail's positive 2025 comes years into the investing boom among everyday Americans that began during the pandemic. The next serious downturn in the market will test whether the elevated participation will last.
          More than one out of every three 25-year-olds in 2024 moved significant sums from checking to investing accounts since they turned 22, according to JPMorgan data released earlier this year. That's up from just 6% of 25-year-olds in 2015.
          JPMorgan found 2025 retail flows surged to records, up more than 50% from last year and about 14% higher than the meme stock craze in early 2021. Individual investors' share of total trades this year climbed to highs last seen during the short-squeeze mania four years ago, according to data from a working paper by professors at Chapman University, Boston College and the University of Illinois Urbana-Champaign.
          The narrative during 2021's meme stock surge — which centered on stocks like GameStop and AMC
          — was that retail investors made simplistic investing decisions to "stick it to the man." Two years later, the sentiment toward these meme-stock era investors was captured in a film starring Pete Davidson, Seth Rogen and Sebastian Stan called "Dumb Money."
          Vanda's Patel and others said that view is changing. Small investors are taking advantage of the widening access to market research and data — and getting a better reputation on Wall Street as a result, they said. Retail has also established itself as being more adept at buying at lows, increasingly putting them in the arena with bigger counterparts, Patel said.
          "The average retail investor's just becoming more and more sophisticated," Patel said. "This year has been kind of a good testament to that."
          To be sure, a new class of meme stocks including OpenDoor has emerged this year. But Vanda found the bulk of retail investor dollars this year has been directed to names like Nvidia, Tesla and Palantir that have outperformed the market in recent years.
          Siebert's Malek said he's found everyday investors to be increasingly focused on longer-term investing, which can keep them from panic selling when the market goes down. Still, one question is top of mind for Malek and other investing leaders: What will retail traders do when the stock market, after multiple years of big gains, finally hits a lasting rough patch?
          For now, retail investors are taking notice of their improved standing.
          Real estate professional Josh Franklin remembers a decade ago when they were easily written off by big investors. The 28-year-old Tampa resident, who has invested in stocks like Robinhood and Palantir over the years and spends dozens of hours a week studying the market, now sees the small guy as central to the story.
          "Back then, no one really cared about retail. They thought retail was dumb money," said Franklin. "Now, retail kind of leads the charts."

          Source: cnbc

          To stay updated on all economic events of today, please check out our Economic calendar
          Risk Warnings and Disclaimers
          You understand and acknowledge that there is a high degree of risk involved in trading. Following any strategies or investment methods may lead to potential losses. The content on the site is provided by our contributors and analysts for information purposes only. You are solely responsible for determining whether any trading assets, securities, strategy, or any other product is suitable for investing based on your own investment objectives and financial situation.
          Add to Favorites
          Share
          FastBull
          Copyright © 2026 FastBull Ltd

          728 RM B 7/F GEE LOK IND BLDG NO 34 HUNG TO RD KWUN TONG KLN HONG KONG

          TelegramInstagramTwitterfacebooklinkedin
          App Store Google Play Google Play
          Products
          Charts

          Chats

          Q&A with Experts
          Screeners
          Economic Calendar
          Data
          Tools
          Membership
          Features
          Function
          Markets
          Copy Trading
          Latest Signals
          Contests
          News
          Analysis
          24/7
          Columns
          Education
          Company
          Careers
          About Us
          Contact Us
          Advertising
          Help Center
          Feedback
          User Agreement
          Privacy Policy
          Personal Information Protection Statement
          Business

          White Label

          Data API

          Web Plug-ins

          Poster Maker

          Affiliate Program

          Risk Disclosure

          The risk of loss in trading financial instruments such as stocks, FX, commodities, futures, bonds, ETFs and crypto can be substantial. You may sustain a total loss of the funds that you deposit with your broker. Therefore, you should carefully consider whether such trading is suitable for you in light of your circumstances and financial resources.

          No decision to invest should be made without thoroughly conducting due diligence by yourself or consulting with your financial advisors. Our web content might not suit you since we don't know your financial conditions and investment needs. Our financial information might have latency or contain inaccuracy, so you should be fully responsible for any of your trading and investment decisions. The company will not be responsible for your capital loss.

          Without getting permission from the website, you are not allowed to copy the website's graphics, texts, or trademarks. Intellectual property rights in the content or data incorporated into this website belong to its providers and exchange merchants.

          Not Logged In

          Log in to access more features

          FastBull Membership

          Not yet

          Purchase

          Become a signal provider
          Help Center
          Customer Service
          Dark Mode
          Price Up/Down Colors

          Log In

          Sign Up

          Position
          Layout
          Fullscreen
          Default to Chart
          The chart page opens by default when you visit fastbull.com