• Trade
  • Markets
  • Copy
  • Contests
  • News
  • 24/7
  • Calendar
  • Q&A
  • Chats
Trending
Screeners
SYMBOL
LAST
BID
ASK
HIGH
LOW
NET CHG.
%CHG.
SPREAD
SPX
S&P 500 Index
6827.42
6827.42
6827.42
6899.86
6801.80
-73.58
-1.07%
--
DJI
Dow Jones Industrial Average
48458.04
48458.04
48458.04
48886.86
48334.10
-245.98
-0.51%
--
IXIC
NASDAQ Composite Index
23195.16
23195.16
23195.16
23554.89
23094.51
-398.69
-1.69%
--
USDX
US Dollar Index
97.950
98.030
97.950
98.500
97.950
-0.370
-0.38%
--
EURUSD
Euro / US Dollar
1.17394
1.17409
1.17394
1.17496
1.17192
+0.00011
+ 0.01%
--
GBPUSD
Pound Sterling / US Dollar
1.33707
1.33732
1.33707
1.33997
1.33419
-0.00148
-0.11%
--
XAUUSD
Gold / US Dollar
4299.39
4299.39
4299.39
4353.41
4257.10
+20.10
+ 0.47%
--
WTI
Light Sweet Crude Oil
57.233
57.485
57.233
58.011
56.969
-0.408
-0.71%
--

Community Accounts

Signal Accounts
--
Profit Accounts
--
Loss Accounts
--
View More

Become a signal provider

Sell trading signals to earn additional income

View More

Guide to Copy Trading

Get started with ease and confidence

View More

Signal Accounts for Members

All Signal Accounts

Best Return
  • Best Return
  • Best P/L
  • Best MDD
Past 1W
  • Past 1W
  • Past 1M
  • Past 1Y

All Contests

  • All
  • Trump Updates
  • Recommend
  • Stocks
  • Cryptocurrencies
  • Central Banks
  • Featured News
Top News Only
Share

Thai Leader Anutin: Landmine Blast That Killed Thai Soldiers 'Not A Roadside Accident'

Share

Thai Leader Anutin: Thailand To Continue Military Action Until 'We Feel No More Harm'

Share

Cambodian Prime Minister Hun Manet Says He Had Phone Calls With Trump And Malaysian Leader Anwar About Ceasefire

Share

Cambodia's Hun Manet Says USA, Malaysia Should Verify 'Which Side Fired First' In Latest Conflict

Share

Cambodia's Hun Manet: Cambodia Maintains Its Stance In Seeking Peaceful Resolution Of Disputes

Share

Nasdaq Companies: Allergan, Ferrovia, Insmed, Monolithic Power Systems, Seagate Technology, And Western Digital Will Be Added To The NASDAQ 100 Index. Biogen, CdW, GlobalFoundries, Lululemon, ON Semiconductor, And Tradedesk Will Be Removed From The NASDAQ 100 Index

Share

Witkoff Headed To Berlin This Weekend To Meet With Zelenskiy, European Leaders -Wsj Reporter On X

Share

Russia Attacks Two Ukrainian Ports, Damaging Three Turkish-Owned Vessels

Share

[Historic Flooding Occurs In At Least Four Rivers In Washington State Due To Days Of Torrential Rains] Multiple Areas In Washington State Have Been Hit By Severe Flooding Due To Days Of Torrential Rains, With At Least Four Rivers Experiencing Historic Flooding. Reporters Learned On The 12th That The Floods Caused By The Torrential Rains In Washington State Have Destroyed Homes And Closed Several Highways. Experts Warn That Even More Severe Flooding May Occur In The Future. A State Of Emergency Has Been Declared In Washington State

Share

Trump Says Proposed Free Economic Zone In Donbas Would Work

Share

Trump: I Think My Voice Should Be Heard

Share

Trump Says Will Be Choosing New Fed Chair In Near Future

Share

Trump Says Proposed Free Economic Zone In Donbas Complex But Would Work

Share

Trump Says Land Strikes In Venezuela Will Start Happening

Share

US President Trump: Thailand And Cambodia Are In A Good Situation

Share

State Media: North Korean Leader Kim Hails Troops Returning From Russia Mission

Share

The 10-year Treasury Yield Rose About 5 Basis Points During The "Fed Rate Cut Week," And The 2/10-year Yield Spread Widened By About 9 Basis Points. On Friday (December 12), In Late New York Trading, The Yield On The Benchmark 10-year US Treasury Note Rose 2.75 Basis Points To 4.1841%, A Cumulative Increase Of 4.90 Basis Points For The Week, Trading Within A Range Of 4.1002%-4.2074%. It Rose Steadily From Monday To Wednesday (before The Fed Announced Its Rate Cut And Treasury Bill Purchase Program), Subsequently Exhibiting A V-shaped Recovery. The 2-year Treasury Yield Fell 1.82 Basis Points To 3.5222%, A Cumulative Decrease Of 3.81 Basis Points For The Week, Trading Within A Range Of 3.6253%-3.4989%

Share

Trump: Lots Of Progress Being Made On Russia-Ukraine

Share

NOPA November US Soybean Crush Estimated At 220.285 Million Bushels

Share

SPDR Gold Trust Reports Holdings Up 0.22%, Or 2.28 Tonnes, To 1053.11 Tonnes By Dec 12

TIME
ACT
FCST
PREV
U.K. Trade Balance Non-EU (SA) (Oct)

A:--

F: --

P: --

U.K. Trade Balance (Oct)

A:--

F: --

P: --

U.K. Services Index MoM

A:--

F: --

P: --

U.K. Construction Output MoM (SA) (Oct)

A:--

F: --

P: --

U.K. Industrial Output YoY (Oct)

A:--

F: --

P: --

U.K. Trade Balance (SA) (Oct)

A:--

F: --

P: --

U.K. Trade Balance EU (SA) (Oct)

A:--

F: --

P: --

U.K. Manufacturing Output YoY (Oct)

A:--

F: --

P: --

U.K. GDP MoM (Oct)

A:--

F: --

P: --

U.K. GDP YoY (SA) (Oct)

A:--

F: --

P: --

U.K. Industrial Output MoM (Oct)

A:--

F: --

P: --

U.K. Construction Output YoY (Oct)

A:--

F: --

P: --

France HICP Final MoM (Nov)

A:--

F: --

P: --

China, Mainland Outstanding Loans Growth YoY (Nov)

A:--

F: --

P: --

China, Mainland M2 Money Supply YoY (Nov)

A:--

F: --

P: --

China, Mainland M0 Money Supply YoY (Nov)

A:--

F: --

P: --

China, Mainland M1 Money Supply YoY (Nov)

A:--

F: --

P: --

India CPI YoY (Nov)

A:--

F: --

P: --

India Deposit Gowth YoY

A:--

F: --

P: --

Brazil Services Growth YoY (Oct)

A:--

F: --

P: --

Mexico Industrial Output YoY (Oct)

A:--

F: --

P: --

Russia Trade Balance (Oct)

A:--

F: --

P: --

Philadelphia Fed President Henry Paulson delivers a speech
Canada Building Permits MoM (SA) (Oct)

A:--

F: --

P: --

Canada Wholesale Sales YoY (Oct)

A:--

F: --

P: --

Canada Wholesale Inventory MoM (Oct)

A:--

F: --

P: --

Canada Wholesale Inventory YoY (Oct)

A:--

F: --

P: --

Canada Wholesale Sales MoM (SA) (Oct)

A:--

F: --

P: --

Germany Current Account (Not SA) (Oct)

A:--

F: --

P: --

U.S. Weekly Total Rig Count

A:--

F: --

P: --

U.S. Weekly Total Oil Rig Count

A:--

F: --

P: --

Japan Tankan Large Non-Manufacturing Diffusion Index (Q4)

--

F: --

P: --

Japan Tankan Small Manufacturing Outlook Index (Q4)

--

F: --

P: --

Japan Tankan Large Non-Manufacturing Outlook Index (Q4)

--

F: --

P: --

Japan Tankan Large Manufacturing Outlook Index (Q4)

--

F: --

P: --

Japan Tankan Small Manufacturing Diffusion Index (Q4)

--

F: --

P: --

Japan Tankan Large Manufacturing Diffusion Index (Q4)

--

F: --

P: --

Japan Tankan Large-Enterprise Capital Expenditure YoY (Q4)

--

F: --

P: --

U.K. Rightmove House Price Index YoY (Dec)

--

F: --

P: --

China, Mainland Industrial Output YoY (YTD) (Nov)

--

F: --

P: --

China, Mainland Urban Area Unemployment Rate (Nov)

--

F: --

P: --

Saudi Arabia CPI YoY (Nov)

--

F: --

P: --

Euro Zone Industrial Output YoY (Oct)

--

F: --

P: --

Euro Zone Industrial Output MoM (Oct)

--

F: --

P: --

Canada Existing Home Sales MoM (Nov)

--

F: --

P: --

Euro Zone Total Reserve Assets (Nov)

--

F: --

P: --

U.K. Inflation Rate Expectations

--

F: --

P: --

Canada National Economic Confidence Index

--

F: --

P: --

Canada New Housing Starts (Nov)

--

F: --

P: --

U.S. NY Fed Manufacturing Employment Index (Dec)

--

F: --

P: --

U.S. NY Fed Manufacturing Index (Dec)

--

F: --

P: --

Canada Core CPI YoY (Nov)

--

F: --

P: --

Canada Manufacturing Unfilled Orders MoM (Oct)

--

F: --

P: --

Canada Manufacturing New Orders MoM (Oct)

--

F: --

P: --

Canada Core CPI MoM (Nov)

--

F: --

P: --

Canada Manufacturing Inventory MoM (Oct)

--

F: --

P: --

Canada CPI YoY (Nov)

--

F: --

P: --

Canada CPI MoM (Nov)

--

F: --

P: --

Canada CPI YoY (SA) (Nov)

--

F: --

P: --

Canada Core CPI MoM (SA) (Nov)

--

F: --

P: --

Q&A with Experts
    • All
    • Chatrooms
    • Groups
    • Friends
    Connecting
    .
    .
    .
    Type here...
    Add Symbol or Code

      No matching data

      All
      Trump Updates
      Recommend
      Stocks
      Cryptocurrencies
      Central Banks
      Featured News
      • All
      • Russia-Ukraine Conflict
      • Middle East Flashpoint
      • All
      • Russia-Ukraine Conflict
      • Middle East Flashpoint
      Search
      Products

      Charts Free Forever

      Chats Q&A with Experts
      Screeners Economic Calendar Data Tools
      Membership Features
      Data Warehouse Market Trends Institutional Data Policy Rates Macro

      Market Trends

      Market Sentiment Order Book Forex Correlations

      Top Indicators

      Charts Free Forever
      Markets

      News

      News Analysis 24/7 Columns Education
      From Institutions From Analysts
      Topics Columnists

      Latest Views

      Latest Views

      Trending Topics

      Top Columnists

      Latest Update

      Signals

      Copy Rankings Latest Signals Become a signal provider AI Rating
      Contests
      Brokers

      Overview Brokers Assessment Rankings Regulators News Claims
      Broker listing Forex Brokers Comparison Tool Live Spread Comparison Scam
      Q&A Complaint Scam Alert Videos Tips to Detect Scam
      More

      Business
      Events
      Careers About Us Advertising Help Center

      White Label

      Data API

      Web Plug-ins

      Affiliate Program

      Awards Institution Evaluation IB Seminar Salon Event Exhibition
      Vietnam Thailand Singapore Dubai
      Fans Party Investment Sharing Session
      FastBull Summit BrokersView Expo
      Recent Searches
        Top Searches
          Markets
          News
          Analysis
          User
          24/7
          Economic Calendar
          Education
          Data
          • Names
          • Latest
          • Prev

          View All

          No data

          Scan to Download

          Faster Charts, Chat Faster!

          Download App
          English
          • English
          • Español
          • العربية
          • Bahasa Indonesia
          • Bahasa Melayu
          • Tiếng Việt
          • ภาษาไทย
          • Français
          • Italiano
          • Türkçe
          • Русский язык
          • 简中
          • 繁中
          Open Account
          Search
          Products
          Charts Free Forever
          Markets
          News
          Signals

          Copy Rankings Latest Signals Become a signal provider AI Rating
          Contests
          Brokers

          Overview Brokers Assessment Rankings Regulators News Claims
          Broker listing Forex Brokers Comparison Tool Live Spread Comparison Scam
          Q&A Complaint Scam Alert Videos Tips to Detect Scam
          More

          Business
          Events
          Careers About Us Advertising Help Center

          White Label

          Data API

          Web Plug-ins

          Affiliate Program

          Awards Institution Evaluation IB Seminar Salon Event Exhibition
          Vietnam Thailand Singapore Dubai
          Fans Party Investment Sharing Session
          FastBull Summit BrokersView Expo

          U.S. Consumer Concerns About Inflation at Lowest Level Since Early 2022: Survey

          Michelle

          Economic

          Forex

          Summary:

          Consumer concerns about inflation have fallen to their lowest level in nearly three years, according to Morgan Stanley’s latest U.S. Consumer Pulse Survey, even as analysts warn that

          Consumer concerns about inflation have fallen to their lowest level in nearly three years, according to Morgan Stanley’s latest U.S. Consumer Pulse Survey, even as analysts warn that tariffs could still lead to future price pressures.

          In the bank’s 69th monthly survey of around 2,000 consumers conducted between Sept. 25 and 29, 56% of respondents cited inflation as their top concern, down from 60% in August and 63% a year earlier.

          “While inflation remains the number one concern for consumers over the next 12 months, the proportion of consumers reporting it as their primary concern has dropped to the lowest level since 2022,” Morgan Stanley said.

          The firm cautioned that the improvement might be premature. “Tariff price pass-through is likely not yet complete,” analysts wrote, noting that more than two-thirds of affected firms have yet to raise prices or expect further increases.

          The bank’s analysis of corporate transcripts also found that companies are “increasingly discussing flexing pricing power to mitigate the impact of tariffs.”

          Consumer sentiment toward the economy and household finances has also improved.

          Morgan Stanley said thirty-six percent of respondents expect the economy to improve over the next six months, up from 33% last month, while those expecting conditions to worsen fell to 46% from 49%.

          Morgan Stanley said this marks a “notable improvement from -16% last month,” though confidence remains below January highs.

          The survey also highlighted the growing role of inheritance in household finances, with 17% of consumers having received one and 14% expecting to.

          Morgan Stanley said inheritances are “primarily used for savings, retirement, or investments,” underscoring their link to long-term financial security.

          Source: Yahoo Finance

          To stay updated on all economic events of today, please check out our Economic calendar
          Risk Warnings and Disclaimers
          You understand and acknowledge that there is a high degree of risk involved in trading. Following any strategies or investment methods may lead to potential losses. The content on the site is provided by our contributors and analysts for information purposes only. You are solely responsible for determining whether any trading assets, securities, strategy, or any other product is suitable for investing based on your own investment objectives and financial situation.
          Add to Favorites
          Share

          French Markets Sink Amid Growing Fears of Political Paralysis

          Adam

          Economic

          French markets tumbled after the resignation of Prime Minister Sebastien Lecornu threw the country into another political crisis, raising the prospect of snap elections to break the deadlock.
          French bonds fell, with 10-year yields jumping as much as 11 basis points to 3.61%. That left the premium that investors are demanding to hold French debt over Germany at the highest level this year. The CAC 40 Index lost 1.5% as banks took the biggest hit. The euro weakened 0.7% against the dollar.
          The resignation is the latest step in a long-running political crisis in France, which has prompted the downfall of a number of prime ministers and roiled the nation’s assets. The key problem successive premiers have faced is having to pass a budget through a fractured parliament that includes unpopular spending cuts and tax increases to rein in the largest deficit in the euro area.
          French Markets Sink Amid Growing Fears of Political Paralysis_1
          “To lose one prime minister is unfortunate, but four looks like a major crisis,” wrote Chris Beauchamp, chief market analyst at IG Group. “The real worry will be that the procession of prime ministers unable to govern will at some point force the resignation of President Macron, which would cause the crisis to intensify significantly.”
          France’s Lecornu Set to Speak After Resigning as PM: TOPLive
          French bonds were once viewed as a haven investment of a similar order to Triple-A rated German notes. Now, 10-year yields are among the highest in the euro area. Fitch Ratings cut its credit assessment to A+ from AA- just days after Lecornu took office, moving France a notch lower than the UK, to the same level as Belgium.
          Some analysts cautioned against making any political speculation based on market swings. Macron still has options ahead of him. He can name a new prime minister, who would then need to propose a fresh cabinet or he could call a parliamentary election. Another potential scenario is that he resigns himself — something he’s previously said he won’t do.
          For investors, the key metric to watch has become the French-German bond spread — a measure of risk between what’s perceived as Europe’s safest country and one of its riskiest. The gap is likely to keep widening to 100 basis points, said Nicolas Forest, chief investment officer at Candriam.
          “There’s no panic in the market, but clearly some investors are selling,” he said. “The probability of a dissolution of the National Assembly is more likely.”
          What Bloomberg Strategists say...
          “French government bonds will likely fall further from here as another prime minister succumbs to the lack of political will to tackle the deficit, raising the likelihood of another election to break the political deadlock.
          —Conor Cooper, Macro Squawk. Click here to read the full analysis French banks bore the brunt of the equity selloff. European banks are particularly vulnerable to swings in French debt.
          Their exposure to French sovereign bonds was around €500 billion ($583 billion) a year ago, according to data from the EBA’s 2024 EU-wide transparency exercise published last November, cited by Bloomberg Intelligence. This represented 23% of total sovereign bonds held by EU banks, more than any other country in the region.
          French Markets Sink Amid Growing Fears of Political Paralysis_2
          Societe Generale SA, Credit Agricole SA and BNP Paribas SA fell more than 5%. A Barclays Plc basket tracking stocks that generate more than 30% of their revenue in France dropped 3.8%. Even so, the balance sheets of the country’s banks are still strong, said Rafael Quina, senior director of financial institutions at Fitch Ratings.
          “It’s a clear knee-jerk market move,” said Karen Georges, a fund manager at Ecofi. “I’m not that concerned for my portfolio of French stocks as their business outside of France will compensate if activity slows domestically.”
          About 80% of the CAC 40’s sales are generated overseas, according to data from Citigroup Inc., implying a low earnings risk to companies such as LVMH, Sanofi SA and TotalEnergies SE.
          French Markets Sink Amid Growing Fears of Political Paralysis_3
          Still, Paris-listed stocks have lagged the rest of Europe. The benchmark CAC 40 is up just 7.6% this year, compared with a 12% rally in the broader Stoxx 600 Index.
          “It’s not clear if it will get much worse. It depends of upcoming political discussions,” said Christophe Boucher, chief investment officer at ABN Amro Investment Solutions in Paris. “But today, of course, it’s a surprise and a shock.”

          Source: Bloomberg

          To stay updated on all economic events of today, please check out our Economic calendar
          Risk Warnings and Disclaimers
          You understand and acknowledge that there is a high degree of risk involved in trading. Following any strategies or investment methods may lead to potential losses. The content on the site is provided by our contributors and analysts for information purposes only. You are solely responsible for determining whether any trading assets, securities, strategy, or any other product is suitable for investing based on your own investment objectives and financial situation.
          Add to Favorites
          Share

          Euro Weakens As French Government Implodes, Macron Faces New Crisis

          Blue River

          Technical Analysis

          Domestic politics dominated global markets today, driving sharp moves in both European and Asian trading sessions. In Europe, political instability in France rattled sentiment, while in Japan, optimism over new leadership sparked a broad equity surge and a dramatic selloff in the Yen.

          In European, CAC 40 slumped and Euro is sold off broadly, after French Prime Minister Sebastien Lecornu and his newly formed government resigned just hours after unveiling their cabinet lineup. The collapse, just 14 hours after formation, deepened France’s ongoing political turmoil and marked the shortest-lived administration in modern history.

          Lecornu cited the impossibility of governing amid threats from both coalition partners and the opposition to topple his government. The fallout was immediate, with opposition parties calling on President Macron to resign or trigger early elections. The episode underscores growing public fatigue and political fragmentation that risk eroding investor confidence in French assets.

          Yet, Yen’s dramatic selloff overshadowed Europe’s turmoil. The currency plunged below 150 per dollar for the first time since early August and touched a record low versus Euro, as Japanese equities soared. Traders rushed into risk assets, betting that Prime Minister-designate Sanae Takaichi’s incoming administration will prioritize fiscal expansion and encourage continued BoJ accommodation.

          The move rippled across bond markets, sending short-term JGB yields to two-week lows as traders cut back expectations for further tightening. Market pricing for a BoJ hike by year-end fell sharply to near 40% from 68% at the end of last week, as confidence grew that the central bank will stay on hold through October.

          Governor Kazuo Ueda’s cautious tone in recent weeks aligns with this view, suggesting that policymakers see little urgency to resume tightening. With political stability and fiscal stimulus prospects improving, investors appear comfortable re-engaging in carry trades, accelerating Yen’s decline.

          For now, Dollar leads as the day’s strongest performer, followed by Loonie and Aussie. At the other end, Yen remains the weakest, trailed by Euro and Swiss Franc, while Sterling and Kiwi hover mid-pack in largely risk-driven trade.

          In Europe, at the time of writing, FTSE is up 0.15%. DAX is up 0.25%. CAC is down -1.27%. UK 10-year yield is up 0.044 at 4.739. Germany 10-year yield is up 0.021 at 2.723. Earlier in Asia, Nikkei rose 4.75%. Hong Kong HSI fell -0.67%. China Shanghai SSE rose 0.52%. Singapore Strait Times rose 0.22%. Japan 10-year JGB yield rose 0.015 to 1.680.

          ECB’s Lane: No pre-commitment on rate path, policy to stay data-driven

          ECB Chief Economist Philip Lane reiterated in a speech today that monetary policy will remain data-driven and meeting-by-meeting, with “no pre-commitment to a particular rate path.” He emphasized said the ECB’s policy decisions will hinge not only on the baseline inflation forecast but also on “shifts in the risk distribution”.

          The downside inflation risks outlined in September include a stronger Euro, weaker export demand caused by higher global tariffs, and the possibility of rising market volatility linked to trade tensions.

          Conversely, Lane highlighted several upside risks that could keep inflation elevated. These include “fragmentation of global supply chains”; surge in defence and infrastructure spending that boosts medium-term demand; and climate-related disruptions.

          He elaborated that persistent Euro movements tends to have “multi-year impact” on both inflation and growth, with the size of the impact depending on its source. Appreciation stemming from external weakness or capital flows tends to depress inflation more sharply. On the other hand, changes driven by domestic demand strength or domestic risk premiums carry a smaller inflationary force.

          Eurozone Sentix rises to -5.4, mood brightens from exaggerated pessimism

          Investor sentiment in the Eurozone improved in October, with Sentix Investor Confidence Index rising from -9.2 to -5.4, topping forecasts of -7.7. Current Situation Index advanced from -18.8 to -16.0, while Expectations climbed sharply from 0.8 to 5.8.

          Sentix said the latest data initially looks like the long-awaited economic turning point, with strong improvements seen across Germany, Austria, and Switzerland as well. However, it cautioned that the improvement may not mark a lasting turnaround. Most country-level readings and the Eurozone composite still sit below August’s levels, implying that September’s pessimism was “negatively exaggerated”.

          Meanwhile, Sentix also noted that inflation remains a key worry, with its related index barely rising to -17.75. Still, markets appear to expect that the ECB will maintain a steady policy stance, and perhaps even lean slightly supportive, despite mounting fiscal pressures. Sentix warned that such expectations may have a “limited half-life,” as growing debt levels and persistent inflation could restrain the scope for policy easing in the months ahead.

          Eurozone retail sales edge up 0.1% mom in August, momentum muted

          Eurozone retail sales rose 0.1% mom in August, matching expectations and signaling only a modest pickup in consumer activity. The increase was driven by 0.3% rise in food, drinks, and tobacco sales and 0.4% gain in automotive fuel, partly offset by a -0.1% decline in non-food product demand.

          Across the wider European Union, retail sales were flat on the month. Among member states, Lithuania (+1.7%), Cyprus and Malta (+1.5%), and Sweden (+1.1%) posted the strongest gains, while Romania (-4.0%), Poland (-0.8%), and Luxembourg and Portugal (both -0.7%) recorded notable declines.

          BoJ report highlights resilient recovery but tariffs cloud wage, capex outlook

          The BoJ’s Regional Economic Report released today painted a mixed picture of recovery, with assessments for eight regions left unchanged and one downgraded. Most local economies were described as “recovering moderately” or “picking up” .

          Businesses in some areas reported that they may scale back wage hikes if tariffs begin to bite into profits, a risk that could slow Japan’s nascent wage-led inflation. Still, several regions pointed to ongoing wage pressures from tight labor markets and rising living costs, suggesting that the underlying trend in income growth remains intact for now.

          The survey also revealed continued commitment to capital investment, particularly in automation and IT-related projects, as firms seek efficiency gains. However, a number of companies plan to delay or reassess spending amid uncertainty over global demand and the evolving impact of tariffs.

          WTI oil recovers ahead of 60 after OPEC+ opts for measured output hike

          Oil prices recovered modestly in today after the OPEC+ alliance confirmed a small production increase of 137,000 barrels per day for November, matching the rise announced for October. The restrained decision eased fears of a larger supply boost.

          Following Sunday’s ministerial meeting, OPEC+ said the move was made “in view of a steady global economic outlook and current healthy market fundamentals.” The statement emphasized low global inventories as evidence that supply-demand conditions remain tight enough to justify a gradual output approach.

          The limited hike contrasts with speculation that major producers—particularly Saudi Arabia and Russia—might push for a faster restoration of supply to reclaim market share. Instead, the decision reflects caution amid volatile demand signals and lingering uncertainty over global growth.

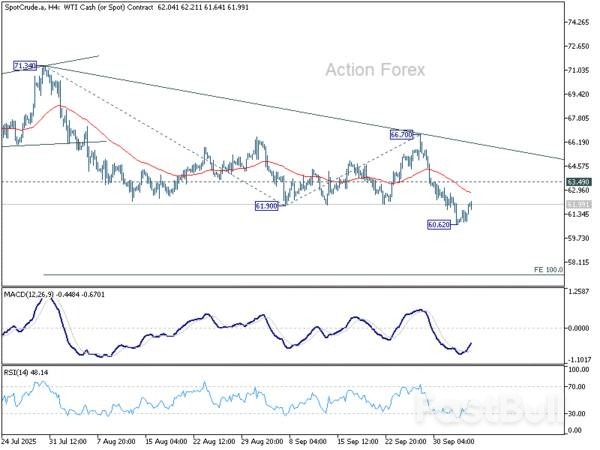
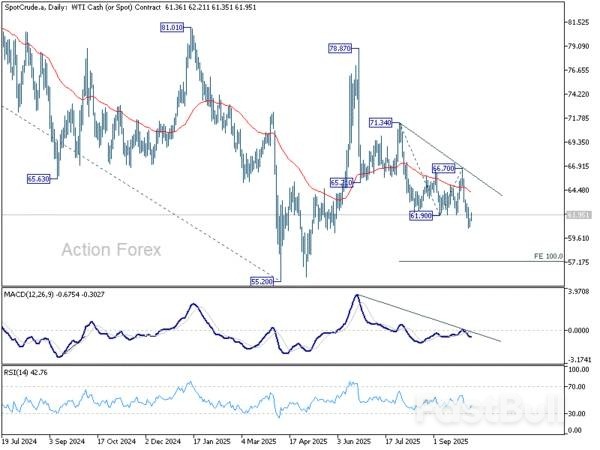
          Technically, for WTI oil, some consolidations would be seen above 60.62 temporary low for the near term. But risk will stay on the downside as long as 63.49 minor resistance holds.

          Break of 60.62 will resume the whole decline from 78.87. Next target is 100% projection of 71.34 to 61.90 from 66.70 at 57.26. However, firm break of 63.49 will bring stronger rebound back to 66.70 resistance instead.

          EUR/GBP Mid-Day Outlook

          Daily Pivots: (S1) 0.8704; (P) 0.8717; (R1) 0.8727;

          EUR/GBP’s fall from 0.8750 resumed by breaking through 0.8688 and intraday bias is back on the downside for 0.8631 support. Decisive break there will indicate near term reversal and turn outlook bearish. On the upside, though, above 0.8728 will bring retest of 0.8750 first. Firm break there will resume the larger rally towards 0.8867 fibonacci level.

          In the bigger picture, rise from 0.8221 medium term bottom is seen as a corrective move. While further rally cannot be ruled out, upside should be limited by 61.8% retracement of 0.9267 to 0.8221 at 0.8867. Considering bearish divergence condition in D MACD, firm break of 0.8631 support will be the first sign that this corrective bounce has completed. Sustained trading below 55 W EMA (now at 0.8539) will confirm, and bring retest of 0.8221 low.

          Source: ACTIONFOREX

          Risk Warnings and Disclaimers
          You understand and acknowledge that there is a high degree of risk involved in trading. Following any strategies or investment methods may lead to potential losses. The content on the site is provided by our contributors and analysts for information purposes only. You are solely responsible for determining whether any trading assets, securities, strategy, or any other product is suitable for investing based on your own investment objectives and financial situation.
          Add to Favorites
          Share

          Gold (XAUUSD) & Silver Price Forecast: $4,000 and $50 Targets in Sight Amid Fed Shift

          Adam

          Commodity

          Market Overview

          Gold and silver started the week on a strong note, supported by growing expectations that the Federal Reserve will cut interest rates sooner than anticipated.
          The rally, which pushed gold to fresh all-time highs, reflects mounting investor unease over the U.S. government shutdown and persistent signs of economic strain in major markets.

          Fed Rate-Cut Bets Lift Precious Metals

          Market data indicate that traders are now pricing in a 95% probability of a 25-basis-point rate cut in October, with another move likely in December, according to the CME’s FedWatch Tool. Lower yields tend to enhance the appeal of non-interest-bearing assets such as gold and silver.
          “The shift in rate expectations is the key driver behind the metals’ strength,” said a senior commodities strategist at JP Morgan.
          Meanwhile, the U.S. government shutdown has raised fresh concerns about fiscal stability and potential delays in the release of economic data. Investors are turning to precious metals as a hedge against policy uncertainty and a possible slowdown in consumer and business spending.

          Broader Macro Drivers Strengthen Safe-Haven Flows

          Outside the U.S., policy shifts and geopolitical tensions have also buoyed safe-haven demand. Japan’s election of fiscal dove Sanae Takaichi as the ruling party’s new leader signals a likely delay in the Bank of Japan’s rate normalization, weakening the yen and adding support to gold.
          In Europe, slowing manufacturing data and persistent inflation have reinforced investor appetite for assets viewed as reliable stores of value.
          Silver, often seen as both an industrial and monetary metal, is benefiting from dual support—rising safe-haven demand and expectations for stronger industrial use in solar technology and electronics.

          Outlook: Consolidation Before Next Move

          While short-term technical indicators suggest both metals could pause after recent gains, analysts see continued upside in the months ahead. With the Fed expected to turn more dovish and global uncertainty intensifying, gold and silver remain firmly positioned as preferred assets for capital preservation.
          As one market analyst noted, “Unless there’s a dramatic policy shift or a surge in economic optimism, the path of least resistance for gold and silver remains higher.”

          Short-Term Forecast

          Gold is expected to trade between $3,898–$3,977, with momentum favoring an upside break above $3,945. Silver remains bullish above $48.00, targeting $49.35–$50.00 amid strong demand for safe-haven and industrial purposes.

          Gold Prices Forecast: Technical Analysis

          Gold (XAUUSD) & Silver Price Forecast: $4,000 and $50 Targets in Sight Amid Fed Shift_1Gold – Chart

          Gold (XAU/USD) is consolidating near $3,932 after encountering resistance at $3,945, which is close to the upper trendline of its rising channel. The price remains well above the 50-day EMA at $3,828 and the 200-day EMA at $3,656, reflecting a steady bullish bias.
          If buyers manage to push above $3,945, the following upside targets could appear near $3,977 and $4,010, aligning with Fibonacci extensions. On the downside, immediate support is seen at $3,898 and $3,868.
          The RSI at 69 shows strong momentum but signals caution as gold nears overbought levels. Overall, as long as gold holds above $3,868, the broader trend remains positive, with pullbacks likely to attract fresh buying interest.

          Silver (XAG/USD) Price Forecast: Technical Outlook

          Gold (XAUUSD) & Silver Price Forecast: $4,000 and $50 Targets in Sight Amid Fed Shift_2Silver – Chart

          Silver (XAG/USD) is consolidating near $48.60 after testing resistance around $48.70, staying within its rising channel. The 50-day EMA at $46.39 continues to provide solid support, while the 200-day EMA at $42.91 underpins the broader uptrend. A breakout above $48.70 could pave the way for $49.35 and $50.02, signaling renewed bullish momentum.
          However, a brief pullback toward $48.00 or $47.74 wouldn’t be surprising before another push higher. The RSI near 69 suggests strong momentum but hints at near-term exhaustion.
          Overall, as long as silver holds above $48.00, the technical structure favors buyers, with dips offering potential re-entry points in anticipation of a move toward the psychological $50.00 level.

          Source: fxempire

          Risk Warnings and Disclaimers
          You understand and acknowledge that there is a high degree of risk involved in trading. Following any strategies or investment methods may lead to potential losses. The content on the site is provided by our contributors and analysts for information purposes only. You are solely responsible for determining whether any trading assets, securities, strategy, or any other product is suitable for investing based on your own investment objectives and financial situation.
          Add to Favorites
          Share

          Factbox-European Companies Cut Jobs In Response To Slowing Economy

          Samantha Luan

          Stocks

          Forex

          Economic

          Several European companies have frozen hiring or cut jobs this year, citing difficult economic conditions exacerbated by U.S. tariffs.

          Here are some of the companies that announced layoffs:

          CAR AND CAR PARTS MAKERS

          * RENAULT: The French carmaker confirmed it is planning cost cuts but said it has no figures to report yet, on Saturday after a newsletter reported it would cut 3,000 jobs by year-end in support services at its headquarters in the Paris suburb of Boulogne-Billancourt and other locations worldwide.

          * BOSCH: The German home appliance manufacturer will cut 13,000 jobs as it battles sluggish demand, high costs and pressure from rivals, it said on September 25.

          * DAIMLER TRUCK: The truckmaker confirmed media reports on August 1 that it would cut 2,000 jobs across its plants in the U.S. and Mexico, on top of the previously announced 5,000 job cuts in Germany.

          * STELLANTIS: The automaker expanded its voluntary redundancy scheme for Italy, bringing the total planned workforce reduction to almost 2,500 in 2025, it said on June 10.

          * VOLKSWAGEN: The company’s CFO said on April 30 it had cut headcount in Germany by around 7,000 since starting cost savings in late 2023.

          * VOLVO CARS: The Swedish carmaker will cut 3,000 mostly white-collar jobs as part of a wider restructuring, it said on May 26.

          BANKS

          * COMMERZBANK: The German bank said on May 14 it had agreed with the works council on terms to cut around 3,900 jobs by 2028.

          * LLOYDS: The British bank will consider the dismissal of around half of 3,000 staff to cut costs, a source familiar with the matter told Reuters on September 4.

          ENERGY

          * OMV: The Austrian oil and gas company plans to cut 2,000 positions, or a twelfth of its global workforce, the Kurier newspaper reported on September 4.

          INDUSTRIALS AND ENGINEERING

          * STMICROELECTRONICS: The French-Italian chipmaker’s CEO said on June 4 he expected 5,000 staff to leave the company in the next three years, including 2,800 job cuts announced in 2025.

          CONSUMER GOODS

          * BURBERRY: The British luxury brand will shed 1,700 jobs or around a fifth of its global workforce to cut costs, it said on May 14.

          * LVMH: The Financial Times reported on May 1, citing an internal video, that the luxury group’s wine and spirits unit Moet Hennessy would cut its workforce by about 1,200 employees.

          OTHERS

          *JUST EAT TAKEAWAY: The food delivery company’s German unit Lieferando plans to cut 2,000 jobs from end-2025 to optimise the model of its delivery service, the company said on July 17.

          * LUFTHANSA: The German airline group said on September 28 it would cut 4,000 administrative jobs by 2030.

          * NOVO NORDISK: The Danish pharmaceutical company will cut 9,000 jobs globally, the company said on September 10.

          Source: Investing

          To stay updated on all economic events of today, please check out our Economic calendar
          Risk Warnings and Disclaimers
          You understand and acknowledge that there is a high degree of risk involved in trading. Following any strategies or investment methods may lead to potential losses. The content on the site is provided by our contributors and analysts for information purposes only. You are solely responsible for determining whether any trading assets, securities, strategy, or any other product is suitable for investing based on your own investment objectives and financial situation.
          Add to Favorites
          Share

          Natural Gas and Oil Forecast: Bulls Eye Breakout as OPEC+ Holds Supply Steady

          Adam

          Commodity

          Market Overview

          Crude oil prices advanced over 1% to around $61.7 per barrel as traders balanced OPEC+’s limited 137,000 bpd production increase for November against heightened geopolitical uncertainty. The modest supply adjustment—unchanged from October—signaled the group’s cautious stance amid fragile global demand.
          Despite easing earlier output cuts totaling 3.85 million bpd, OPEC+ maintained flexibility to pause or reverse changes if market conditions shift. Meanwhile, natural gas prices held firm as investors weighed potential disruptions to energy flows against stable inventories and seasonal demand.
          Overall, geopolitical tensions have reinforced oil’s risk premium, tempering the impact of new supply additions.

          Natural Gas Price Forecast

          Natural Gas and Oil Forecast: Bulls Eye Breakout as OPEC+ Holds Supply Steady_1Natural Gas (NG) Price Chart

          Natural gas is holding steady near $3.41 after bouncing from the 200-day EMA at $3.29, signaling short-term stability. The 50-day EMA at $3.37 now acts as immediate support, while resistance stands at $3.42 and $3.49.
          A break above these levels could open the way toward $3.58 and $3.60, aligning with the upper boundary of the ascending channel. The RSI sits near 53, suggesting balanced momentum with mild bullish bias.
          If buyers sustain control above $3.37, upward continuation looks likely, but a close below $3.33 could shift sentiment back toward $3.24. Overall, price action remains constructive as long as natural gas holds above its moving averages.

          WTI Oil Price Forecast

          Natural Gas and Oil Forecast: Bulls Eye Breakout as OPEC+ Holds Supply Steady_2WTI Price Chart

          WTI crude oil is attempting to break above its descending channel after finding solid support near $60.41. The price has rebounded toward $61.87, testing the 50-day EMA at $61.82, while the 200-day EMA sits higher at $62.94, creating short-term resistance.
          A sustained close above $62.57 could signal a shift in momentum toward $63.48 and $64.19. However, failure to clear the EMAs may invite renewed selling pressure back toward $61.55 and $60.41. RSI has recovered from oversold territory, now hovering around 59, suggesting mild bullish momentum but not yet confirming a strong reversal.

          Brent Oil Price Forecast

          Natural Gas and Oil Forecast: Bulls Eye Breakout as OPEC+ Holds Supply Steady_3Brent Price Chart

          Brent crude oil is testing a potential breakout above its descending channel after rebounding from support at $64.02. The price now trades near $65.51, closely aligned with the 50-day EMA at $65.53. A sustained move above this level could open the way toward $66.60 and $67.48, where the 200-day EMA and prior highs converge.
          On the downside, $64.81 and $64.02 remain key supports to watch if momentum weakens. RSI has climbed to around 59, reflecting improving buying interest but not yet signaling overbought conditions.

          Source: fxempire

          Risk Warnings and Disclaimers
          You understand and acknowledge that there is a high degree of risk involved in trading. Following any strategies or investment methods may lead to potential losses. The content on the site is provided by our contributors and analysts for information purposes only. You are solely responsible for determining whether any trading assets, securities, strategy, or any other product is suitable for investing based on your own investment objectives and financial situation.
          Add to Favorites
          Share

          With The S&P 500 Rising This Year, Is Now The Best Time Or The Worst Time to Buy An S&P 500 ETF?

          Michelle

          Stocks

          Economic

          The S&P 500 is back to its glorious self this year, overcoming some challenges a few months ago to rise 14% year to date. It's resilient, like the U.S. economy, driven by the largest of its 500 components.

          There are a number of ways to invest in the S&P 500, and one of the most popular methods today is investing in an exchange-traded fund (ETF) that tracks it. The largest one is the Vanguard S&P 500 ETF (VOO 0.01%), which has $1.4 trillion in assets, but there are several others.

          You might think it's a great time to buy in as the market rises, but it's not that simple.

          The best time

          The S&P 500 has been a wealth-building machine for decades. It gains on average more than 10% annually; Compounded over time, especially with consistent additions, that turns into a lot of money for investors.

          As the market rises, investors can benefit from increasing stock prices. And when you invest in an ETF that tracks the S&P 500, it takes all of the guesswork out of investing.

          It also gives you exposure to the best companies on the market today, and since it's a weighted index, it's heavily skewed toward artificial intelligence (AI). The largest companies in the U.S. by market cap are the largest companies in the index, and today, these are all AI companies. The Vanguard ETF's top holdings are Nvidia, Microsoft, Apple, and Amazon, and they collectively account for 25% of the total portfolio.

          These stocks have incredible long-term tailwinds. Investing in an S&P 500 ETF gives you access to these opportunities while minimizing the risk of investing in only one company.

          The worst time

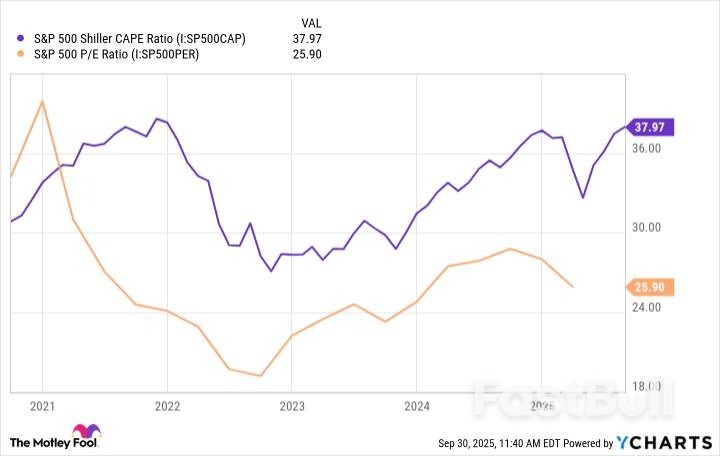
          That being said, the best time to buy is on the dip, not at the top. The S&P 500 is breaking records all the time these days, and it's near its most expensive valuation. The average S&P price-to-earnings (P/E) ratio is almost 38, a five-year high. The cyclically adjusted P/E ratio, or CAPE ratio, which adjusts for inflation, is also near highs -- outside of a spike in 2021 right before the market crashed.

          S&P 500 Shiller CAPE Ratio data by YCharts.

          What does that mean for investors? Nothing concrete, but the nature of the market is that there are always going to be dips, corrections, and even crashes on the way to the top. The market has always recovered and gone on to bigger and better, but as the S&P 500 becomes more and more expensive, the potential for some kind of correction looks likely.

          The verdict

          No one knows when there might be a dip, or worse. You can't time the market, and even though it's heading higher today, it could keep that up for a long time. It would be a shame to miss out on the growth because of fear of a correction. Keep in mind the potential for some near-term rebalancing as the market becomes even more expensive.

          I would caution anyone who might need their funds in the near future to invest in safe, perhaps dividend-yielding stocks and keep some distance from anything that looks overpriced, including an S&P 500 ETF. But if you're in it for the long term, and you have the ability to weather downturns, it's always a good time to invest in the market, and an S&P 500 ETF is an excellent way to do that.

          Source: The Motley Fool

          To stay updated on all economic events of today, please check out our Economic calendar
          Risk Warnings and Disclaimers
          You understand and acknowledge that there is a high degree of risk involved in trading. Following any strategies or investment methods may lead to potential losses. The content on the site is provided by our contributors and analysts for information purposes only. You are solely responsible for determining whether any trading assets, securities, strategy, or any other product is suitable for investing based on your own investment objectives and financial situation.
          Add to Favorites
          Share
          FastBull
          Copyright © 2025 FastBull Ltd

          728 RM B 7/F GEE LOK IND BLDG NO 34 HUNG TO RD KWUN TONG KLN HONG KONG

          TelegramInstagramTwitterfacebooklinkedin
          App Store Google Play Google Play
          Products
          Charts

          Chats

          Q&A with Experts
          Screeners
          Economic Calendar
          Data
          Tools
          Membership
          Features
          Function
          Markets
          Copy Trading
          Latest Signals
          Contests
          News
          Analysis
          24/7
          Columns
          Education
          Company
          Careers
          About Us
          Contact Us
          Advertising
          Help Center
          Feedback
          User Agreement
          Privacy Policy
          Business

          White Label

          Data API

          Web Plug-ins

          Poster Maker

          Affiliate Program

          Risk Disclosure

          The risk of loss in trading financial instruments such as stocks, FX, commodities, futures, bonds, ETFs and crypto can be substantial. You may sustain a total loss of the funds that you deposit with your broker. Therefore, you should carefully consider whether such trading is suitable for you in light of your circumstances and financial resources.

          No decision to invest should be made without thoroughly conducting due diligence by yourself or consulting with your financial advisors. Our web content might not suit you since we don't know your financial conditions and investment needs. Our financial information might have latency or contain inaccuracy, so you should be fully responsible for any of your trading and investment decisions. The company will not be responsible for your capital loss.

          Without getting permission from the website, you are not allowed to copy the website's graphics, texts, or trademarks. Intellectual property rights in the content or data incorporated into this website belong to its providers and exchange merchants.

          Not Logged In

          Log in to access more features

          FastBull Membership

          Not yet

          Purchase

          Become a signal provider
          Help Center
          Customer Service
          Dark Mode
          Price Up/Down Colors

          Log In

          Sign Up

          Position
          Layout
          Fullscreen
          Default to Chart
          The chart page opens by default when you visit fastbull.com