• Trade
  • Markets
  • Copy
  • Contests
  • News
  • 24/7
  • Calendar
  • Q&A
  • Chats
Trending
Screeners
SYMBOL
LAST
BID
ASK
HIGH
LOW
NET CHG.
%CHG.
SPREAD
SPX
S&P 500 Index
6842.01
6842.01
6842.01
6878.28
6833.87
-28.39
-0.41%
--
DJI
Dow Jones Industrial Average
47748.30
47748.30
47748.30
47971.51
47695.55
-206.68
-0.43%
--
IXIC
NASDAQ Composite Index
23514.83
23514.83
23514.83
23698.93
23481.60
-63.29
-0.27%
--
USDX
US Dollar Index
99.070
99.150
99.070
99.160
98.730
+0.120
+ 0.12%
--
EURUSD
Euro / US Dollar
1.16290
1.16298
1.16290
1.16717
1.16162
-0.00136
-0.12%
--
GBPUSD
Pound Sterling / US Dollar
1.33169
1.33176
1.33169
1.33462
1.33053
-0.00143
-0.11%
--
XAUUSD
Gold / US Dollar
4190.11
4190.52
4190.11
4218.85
4175.92
-7.80
-0.19%
--
WTI
Light Sweet Crude Oil
58.912
58.942
58.912
60.084
58.837
-0.897
-1.50%
--

Community Accounts

Signal Accounts
--
Profit Accounts
--
Loss Accounts
--
View More

Become a signal provider

Sell trading signals to earn additional income

View More

Guide to Copy Trading

Get started with ease and confidence

View More

Signal Accounts for Members

All Signal Accounts

Best Return
  • Best Return
  • Best P/L
  • Best MDD
Past 1W
  • Past 1W
  • Past 1M
  • Past 1Y

All Contests

  • All
  • Trump Updates
  • Recommend
  • Stocks
  • Cryptocurrencies
  • Central Banks
  • Featured News
Top News Only
Share

EU's Foreign Chief: Giving Ukraine The Resources It Needs To Defend Itself Doesn't Prolong The War, It Can Help End It

Share

EU's Foreign Chief: Securing Multi-Year Funding For Ukraine In December Is Absolutely Essential

Share

[Bank For International Settlements: US Tariffs Drive Record Global FX Trading Volume] Data From The Bank For International Settlements (BIS) Shows That Global FX Trading Volume Surged To A Record High This Year, With An Average Daily Trading Volume Of $9.5 Trillion In April, Amid Market Turmoil Triggered By US President Trump's Tariff Policies. On December 8, The Bank Released Its Quarterly Assessment, Citing Data From Its Triennial Survey, Stating That The Impact Of Tariffs Was "substantial," Leading To An Unexpected Depreciation Of The US Dollar And Accounting For Over $1.5 Trillion In Average Daily OTC Trading Volume In April. The Report Shows That Overall FX Trading Volume Increased By More Than A Quarter Compared To The Last Survey In 2022, Surpassing The Estimated Peak During The Market Turmoil Caused By The COVID-19 Pandemic In March 2020. This Data Is An Update Based On Preliminary Survey Results Released In September

Share

UN Secretary General Guterres Strongly Condemns Unauthorized Entry By Israeli Authorities Into UNRWA Compound In East Jerusalem

Share

Bank Of America: A Dovish Federal Reserve Poses A Key Risk To High-grade U.S. Bonds In 2026

Share

Bank CEOs Will Meet With U.S. Senators To Discuss The (regulatory) Framework For The Cryptocurrency Market

Share

The U.S. Supreme Court Has Hinted That It Will Support President Trump's Decision To Remove Heads Of Federal Government Agencies

Share

[BlackRock: The Surge Of Funds Into AI Infrastructure Is Far From Peaking] Ben Powell, Chief Investment Strategist For Asia Pacific At BlackRock, Stated That The Capital Expenditure Spree In The Artificial Intelligence (AI) Infrastructure Sector Continues And Is Far From Reaching Its Peak. Powell Believes That As Tech Giants Race To Increase Their Investments In A "winner-takes-all" Competition, The "shovel Sellers" (such As Chipmakers, Energy Producers, And Copper Wire Manufacturers) Who Provide The Foundational Resources For The Sector Are The Clearest Investment Winners

Share

[Ray Dalio: The Middle East Is Rapidly Becoming One Of The World's Most Influential AI Hubs] Bridgewater Associates Founder Ray Dalio Stated That The Middle East (particularly The UAE And Saudi Arabia) Is Rapidly Emerging As A Powerful Global AI Hub, Comparable To Silicon Valley, Due To The Region's Combination Of Massive Capital And Global Talent. Dalio Believes The Gulf Region's Transformation Is The Result Of Well-thought-out National Strategies And Long-term Planning, Noting That The UAE's Outstanding Performance In Leadership, Stability, And Quality Of Life Has Made It A "Silicon Valley For Capitalists." While He Believes The AI ​​rebound Is In Bubble Territory, He Advises Investors Not To Rush Out But Rather To Look For Catalysts That Could Cause The Bubble To "burst," Such As Monetary Tightening Or Forced Wealth Selling

Share

French President Emmanuel Macron Met With The Croatian Prime Minister At The Élysée Palace

Share

In The Past 24 Hours, The Marketvector Digital Asset 100 Small Cap Index Rose 1.96%, Currently At 4135.44 Points. The Sydney Market Initially Exhibited An N-shaped Pattern, Hitting A Daily Low Of 3988.39 Points At 06:08 Beijing Time, Before Steadily Rising To A Daily High Of 4206.06 Points At 17:07, Subsequently Stabilizing At This High Level

Share

[Sovereign Bond Yields In France, Italy, Spain, And Greece Rose By More Than 7 Basis Points, Raising Concerns That The ECB's Interest Rate Outlook May Push Up Financing Costs] In Late European Trading On Monday (December 8), The Yield On French 10-year Bonds Rose 5.8 Basis Points To 3.581%. The Yield On Italian 10-year Bonds Rose 7.4 Basis Points To 3.559%. The Yield On Spanish 10-year Bonds Rose 7.0 Basis Points To 3.332%. The Yield On Greek 10-year Bonds Rose 7.1 Basis Points To 3.466%

Share

Oil Falls 1% Amid Ongoing Ukraine Talks, Ahead Of Expected US Interest Rate Cut

Share

Azeri Btc Crude Oil Exports From Ceyhan Port Set At 16.2 Million Barrels In January Versus 17.0 Million In December, Schedule Shows

Share

USA - Greenland Joint Committee Statement: The United States And Greenland Look Forward To Building On Momentum In The Year Ahead And Strengthening Ties That Support A Secure And Prosperous Arctic Region

Share

MSCI Nordic Countries Index Fell 0.4% To 356.64 Points. Among The Ten Sectors, The Nordic Healthcare Sector Saw The Largest Decline. Novo Nordisk, A Heavyweight Stock, Closed Down 3.4%, Leading The Losses Among Nordic Stocks

Share

France's CAC 40 Down 0.2%, Spain's IBEX Up 0.1%

Share

Europe's STOXX Index Up 0.1%, Euro Zone Blue Chips Index Flat

Share

Germany's DAX 30 Index Closed Up 0.08% At 24,044.88 Points. France's Stock Index Closed Down 0.19%, Italy's Stock Index Closed Down 0.13% With Its Banking Index Up 0.33%, And The UK's Stock Index Closed Down 0.32%

Share

The STOXX Europe 600 Index Closed Down 0.12% At 578.06 Points. The Eurozone STOXX 50 Index Closed Down 0.04% At 5721.56 Points. The FTSE Eurotop 300 Index Closed Down 0.05% At 2304.93 Points

TIME
ACT
FCST
PREV
France Trade Balance (SA) (Oct)

A:--

F: --

P: --
Euro Zone Employment YoY (SA) (Q3)

A:--

F: --

P: --
Canada Part-Time Employment (SA) (Nov)

A:--

F: --

P: --

Canada Unemployment Rate (SA) (Nov)

A:--

F: --

P: --

Canada Full-time Employment (SA) (Nov)

A:--

F: --

P: --

Canada Labor Force Participation Rate (SA) (Nov)

A:--

F: --

P: --

Canada Employment (SA) (Nov)

A:--

F: --

P: --

U.S. PCE Price Index MoM (Sept)

A:--

F: --

P: --

U.S. Personal Income MoM (Sept)

A:--

F: --

P: --

U.S. Core PCE Price Index MoM (Sept)

A:--

F: --

P: --

U.S. PCE Price Index YoY (SA) (Sept)

A:--

F: --

P: --

U.S. Core PCE Price Index YoY (Sept)

A:--

F: --

P: --

U.S. Personal Outlays MoM (SA) (Sept)

A:--

F: --

P: --
U.S. 5-10 Year-Ahead Inflation Expectations (Dec)

A:--

F: --

P: --

U.S. Real Personal Consumption Expenditures MoM (Sept)

A:--

F: --

P: --
U.S. Weekly Total Rig Count

A:--

F: --

P: --

U.S. Weekly Total Oil Rig Count

A:--

F: --

P: --

U.S. Consumer Credit (SA) (Oct)

A:--

F: --

P: --
China, Mainland Foreign Exchange Reserves (Nov)

A:--

F: --

P: --

Japan Trade Balance (Oct)

A:--

F: --

P: --

Japan Nominal GDP Revised QoQ (Q3)

A:--

F: --

P: --

China, Mainland Imports YoY (CNH) (Nov)

A:--

F: --

P: --

China, Mainland Exports (Nov)

A:--

F: --

P: --

China, Mainland Imports (CNH) (Nov)

A:--

F: --

P: --

China, Mainland Trade Balance (CNH) (Nov)

A:--

F: --

P: --

China, Mainland Exports YoY (USD) (Nov)

A:--

F: --

P: --

China, Mainland Imports YoY (USD) (Nov)

A:--

F: --

P: --

Germany Industrial Output MoM (SA) (Oct)

A:--

F: --

P: --
Euro Zone Sentix Investor Confidence Index (Dec)

A:--

F: --

P: --

Canada National Economic Confidence Index

A:--

F: --

P: --

U.K. BRC Like-For-Like Retail Sales YoY (Nov)

--

F: --

P: --

U.K. BRC Overall Retail Sales YoY (Nov)

--

F: --

P: --

Australia Overnight (Borrowing) Key Rate

--

F: --

P: --

RBA Rate Statement
RBA Press Conference
Germany Exports MoM (SA) (Oct)

--

F: --

P: --

U.S. NFIB Small Business Optimism Index (SA) (Nov)

--

F: --

P: --

Mexico 12-Month Inflation (CPI) (Nov)

--

F: --

P: --

Mexico Core CPI YoY (Nov)

--

F: --

P: --

Mexico PPI YoY (Nov)

--

F: --

P: --

U.S. Weekly Redbook Index YoY

--

F: --

P: --

U.S. JOLTS Job Openings (SA) (Oct)

--

F: --

P: --

China, Mainland M1 Money Supply YoY (Nov)

--

F: --

P: --

China, Mainland M0 Money Supply YoY (Nov)

--

F: --

P: --

China, Mainland M2 Money Supply YoY (Nov)

--

F: --

P: --

U.S. EIA Short-Term Crude Production Forecast For The Year (Dec)

--

F: --

P: --

U.S. EIA Natural Gas Production Forecast For The Next Year (Dec)

--

F: --

P: --

U.S. EIA Short-Term Crude Production Forecast For The Next Year (Dec)

--

F: --

P: --

EIA Monthly Short-Term Energy Outlook
U.S. API Weekly Gasoline Stocks

--

F: --

P: --

U.S. API Weekly Cushing Crude Oil Stocks

--

F: --

P: --

U.S. API Weekly Crude Oil Stocks

--

F: --

P: --

U.S. API Weekly Refined Oil Stocks

--

F: --

P: --

South Korea Unemployment Rate (SA) (Nov)

--

F: --

P: --

Japan Reuters Tankan Non-Manufacturers Index (Dec)

--

F: --

P: --

Japan Reuters Tankan Manufacturers Index (Dec)

--

F: --

P: --

Japan Domestic Enterprise Commodity Price Index MoM (Nov)

--

F: --

P: --

Japan Domestic Enterprise Commodity Price Index YoY (Nov)

--

F: --

P: --

China, Mainland PPI YoY (Nov)

--

F: --

P: --

China, Mainland CPI MoM (Nov)

--

F: --

P: --

Q&A with Experts
    • All
    • Chatrooms
    • Groups
    • Friends
    Connecting
    .
    .
    .
    Type here...
    Add Symbol or Code

      No matching data

      All
      Trump Updates
      Recommend
      Stocks
      Cryptocurrencies
      Central Banks
      Featured News
      • All
      • Russia-Ukraine Conflict
      • Middle East Flashpoint
      • All
      • Russia-Ukraine Conflict
      • Middle East Flashpoint
      Search
      Products

      Charts Free Forever

      Chats Q&A with Experts
      Screeners Economic Calendar Data Tools
      Membership Features
      Data Warehouse Market Trends Institutional Data Policy Rates Macro

      Market Trends

      Market Sentiment Order Book Forex Correlations

      Top Indicators

      Charts Free Forever
      Markets

      News

      News Analysis 24/7 Columns Education
      From Institutions From Analysts
      Topics Columnists

      Latest Views

      Latest Views

      Trending Topics

      Top Columnists

      Latest Update

      Signals

      Copy Rankings Latest Signals Become a signal provider AI Rating
      Contests
      Brokers

      Overview Brokers Assessment Rankings Regulators News Claims
      Broker listing Forex Brokers Comparison Tool Live Spread Comparison Scam
      Q&A Complaint Scam Alert Videos Tips to Detect Scam
      More

      Business
      Events
      Careers About Us Advertising Help Center

      White Label

      Data API

      Web Plug-ins

      Affiliate Program

      Awards Institution Evaluation IB Seminar Salon Event Exhibition
      Vietnam Thailand Singapore Dubai
      Fans Party Investment Sharing Session
      FastBull Summit BrokersView Expo
      Recent Searches
        Top Searches
          Markets
          News
          Analysis
          User
          24/7
          Economic Calendar
          Education
          Data
          • Names
          • Latest
          • Prev

          View All

          No data

          Scan to Download

          Faster Charts, Chat Faster!

          Download App
          English
          • English
          • Español
          • العربية
          • Bahasa Indonesia
          • Bahasa Melayu
          • Tiếng Việt
          • ภาษาไทย
          • Français
          • Italiano
          • Türkçe
          • Русский язык
          • 简中
          • 繁中
          Open Account
          Search
          Products
          Charts Free Forever
          Markets
          News
          Signals

          Copy Rankings Latest Signals Become a signal provider AI Rating
          Contests
          Brokers

          Overview Brokers Assessment Rankings Regulators News Claims
          Broker listing Forex Brokers Comparison Tool Live Spread Comparison Scam
          Q&A Complaint Scam Alert Videos Tips to Detect Scam
          More

          Business
          Events
          Careers About Us Advertising Help Center

          White Label

          Data API

          Web Plug-ins

          Affiliate Program

          Awards Institution Evaluation IB Seminar Salon Event Exhibition
          Vietnam Thailand Singapore Dubai
          Fans Party Investment Sharing Session
          FastBull Summit BrokersView Expo

          Uk Retail Sales Drop Unexpectedly As Shoppers Await Black Friday And Budget

          Olivia Brooks

          Economic

          Summary:

          Sales at UK retailers slumped unexpectedly last month as shoppers waited for Black Friday deals, and uncertainty over the upcoming budget dampened consumer confidence.

          Sales at UK retailers slumped unexpectedly last month as shoppers waited for Black Friday deals, and uncertainty over the upcoming budget dampened consumer confidence.

          Retail sales fell 1.1% month on month in October, the first fall since May, according to official figures from the Office for National Statistics (ONS). Economists had been expecting sales growth to be flat on the previous month.

          Supermarkets, clothing stores and online mail order companies suffered sales declines, which some retailers said was due to consumers delaying purchases in the run-up to the annual Black Friday sales, according to the ONS.

          Clothing, footwear and textile stores posted a 3.3% month-on-month drop in sales, the largest fall, after strong summer when shoppers were motivated to buy clothes during warm weather and sporting events improved consumers' mood.

          Supermarkets recorded a sales decrease of 1.1% in October, the second consecutive monthly fall.

          Online retail sales fell 1.7% month on month, while fuel sales dropped 2.4% in October compared with September.

          Some analysts also attributed the surprise fall in sales in October to consumer jitters over the upcoming budget, which the chancellor, Rachel Reeves, will present next week.

          "The uncertainty surrounding what the chancellor's budget next week will mean for individuals is only further dampening consumer confidence and spending intentions," said Rajeev Shaunak, the head of consumer at the accountancy and advisory firm MHA.

          "The Christmas trading period will be critical, and early sales indicators are expected to confirm that consumer demand remains sluggish, creating a perfect storm for retailers."

          On Friday, the research company GfK released data showing that consumer confidence has fallen on every measure of its index this month.

          GFK's five sub-indexes record public opinion about people's personal financial situation, propensity to make big purchases and the UK's general economic situation.

          The company recorded drops across all five sub-indexes compared with October, resulting in a two-point fall in overall confidence to -19.

          The latest monthly survey, which dates back to 1974, showed particular anxiety among earners on salaries between £35,000 and £49,999, with substantial falls in their expectations for their own financial situation and future spending.

          "This is a bleak set of results as we head towards next week's budget," said Neil Bellamy, the consumer insights director at GfK. "The public is bracing for difficult news, with little in the current climate to lift expectations."

          The ONS revised retail sales for September up from 0.5% to 0.7%, but said August had been revised down from 0.6% to 0.5% growth.

          Overall, retail sales remain 3.3% down compared with their pre-pandemic level from February 2020.

          Source: GUARDIAN

          To stay updated on all economic events of today, please check out our Economic calendar
          Risk Warnings and Disclaimers
          You understand and acknowledge that there is a high degree of risk involved in trading. Following any strategies or investment methods may lead to potential losses. The content on the site is provided by our contributors and analysts for information purposes only. You are solely responsible for determining whether any trading assets, securities, strategy, or any other product is suitable for investing based on your own investment objectives and financial situation.
          Add to Favorites
          Share

          MyFastBroker.com Forex Brokers: How Reliable Are Its Latest Picks?

          Winkelmann

          Forex

          Key Takeaways

          • An overview of MyFastBroker.com, its core features, and whether the platform is considered reliable
          • The different types of forex brokers covered and how they vary in risk and suitability
          • Key factors traders should focus on when choosing a broker safely

          MyFastBroker.com Forex Brokers: How Reliable Are Its Latest Picks?_1

          Many traders rely on myfastbroker.com forex brokers to find potential trading platforms, but the key question remains: how reliable are its latest picks? This article reviews how the platform selects brokers, what risks users should watch for, and how trustworthy its recommendations really are. We focus on clear safety checks, real-world usability, and practical guidance to help traders make confident decisions.

          What Is MyFastBroker.com

          Myfastbroker is a broker comparison platform designed to help users explore different trading options without acting as an actual trading broker. Instead of executing trades, myfastbroker.com collects and displays information about various broker categories, including myfastbroker.com forex brokers, stock, and other financial services, allowing traders to compare features before making a choice.

          MyFastBroker.com Core Function

          The core role of myfastbroker.com is to act as an informational hub where users can view and compare brokers based on basic criteria such as services offered, trading tools, and general positioning.

          • Listing different broker categories under one platform
          • Presenting basic feature comparisons and summaries
          • Directing users to external broker websites for account registration
          • Offering supporting content related to trading tools and platform use

          While myfastbroker trading apps and myfastbroker trading platforms are sometimes mentioned, the site itself does not operate as a direct trading interface.

          Types of Brokers Featured on MyFastBroker.com

          Although the main focus in this article remains on myfastbroker.com forex brokers, the platform also showcases a wide range of broker types.

          Broker TypeTypical Use Case
          myfastbroker stock brokersEquity and share trading
          Forex brokersCurrency trading
          Business brokersCorporate investment or asset transfers
          Insurance brokersRisk coverage and policy services

          This broad coverage positions myfastbroker.com more as a general broker listing site than a specialised forex-only solution.

          MyFastBroker.com vs. Other Broker Review Sites

          Compared with traditional broker review platforms, myfast broker.com places more emphasis on aggregation rather than in-depth verification.

          • Less transparency on data sources
          • Limited detailed performance testing
          • Focus on presentation over regulatory analysis

          By contrast, specialist review sites often provide structured scoring methods, regulatory cross-checks, and real user feedback data, which can offer deeper insight beyond what myfastbroker.com typically presents.

          How Does MyFastBroker.com Select Forex Brokers?

          Understanding how myfastbroker.com forex brokers are chosen is essential when judging the reliability of its listings. The site claims to rely on a selection process, but the level of detail shared with users remains limited.

          MyFastBroker's Claimed Selection Criteria

          According to Myfastbroker, broker inclusion is based on several general factors such as:

          • Market presence
          • Range of trading assets
          • Basic reputation indicators
          • Platform functionality

          However, there is no clear public breakdown of how each factor is weighted, making it difficult for users to fully assess how objective the selection process is.

          Manual Review vs Algorithm-Based Scoring

          It is not clearly stated whether myfastbroker.com relies more on human analysis or automated scoring systems. This lack of transparency raises questions about consistency and objectivity.

          MethodCharacteristicsPotential Risks
          Manual reviewSubjective human judgmentPossible bias or inconsistency
          Algorithm-based scoringData-driven metricsLack of transparency in scoring rules

          Potential Influence of Affiliate Partnerships

          Many comparison platforms generate revenue through affiliate relationships, and myfastbroker.com is no exception. This model means that:

          • Brokers may pay for placement or visibility
          • Recommendations could be influenced by commission structures
          • Objective ranking may not always reflect broker quality

          This does not automatically mean recommendations are unreliable, but it does highlight the importance of independent verification before trusting any listing from myfastbroker.com forex brokers.

          How to Verify MyFastBroker's Latest Picks: 5 Reliability Checks

          Even when using myfastbroker.com forex brokers as a reference, traders should never rely solely on platform ratings. These five practical checks help you verify whether a broker listed on Myfastbroker or myfast broker.com is truly reliable before opening an account.

          Check #1 - Verify Regulatory License Status

          The first step is to confirm whether the broker is regulated by recognised authorities. Listings on myfastbroker.com may not always display full regulatory details, so direct verification is essential.

          • Check official regulator databases (FCA, ASIC, CySEC, etc.)
          • Match license numbers with the broker’s legal entity
          • Avoid brokers with unclear or offshore-only regulation

          Check #2 - Confirm Client Fund Protection

          Brokers featured on myfastbroker.com should clearly state how client funds are handled. This applies to both myfastbroker stock brokers and forex platforms.

          Protection FactorWhat to Look For
          Segregated AccountsClient money kept separate from company funds
          Compensation SchemesInvestor protection coverage if broker fails
          Transparency PolicyClear explanation on fund handling

          Check #3 - Compare Live Spreads Against Claims

          Brokers promoted through myfastbroker trading platforms often highlight attractive spreads. These should be tested against real trading conditions.

          • Compare demo vs live account spreads
          • Monitor spreads during market volatility
          • Look for hidden markups or sudden widening

          Check #4 - Test Execution Quality & Slippage

          Execution performance is rarely shown on myfastbroker.com trading apps listings, yet it directly affects profitability.

          • Open small test trades to observe order processing speed
          • Track frequency of slippage during major news events
          • Ensure stop-loss orders trigger as expected

          Check #5 - Scan Withdrawal Complaints

          One of the most critical reliability signals for any broker found via myfastbroker.com is withdrawal performance.

          • Search trader forums and review platforms for payout issues
          • Identify repeated complaint patterns
          • Be cautious if withdrawal delays appear widespread

          A broker with consistent withdrawal problems should not be trusted, regardless of how prominently it appears on myfastbroker .com listings.

          Should You Trust MyFastBroker.com Forex Brokers in 2025?

          While myfastbroker.com forex brokers can be helpful as a starting point, trust should never be automatic. The platform is useful for quick discovery, but traders still need to decide whether its recommendations match real trading safety standards.

          When MyFastBroker's Picks Are Trustworthy

          Brokers listed on Myfastbroker or myfast broker.com may be considered reasonably reliable when they meet clear, verifiable criteria.

          • The broker holds valid regulation from recognised authorities
          • Client funds are protected through segregated accounts
          • Trading conditions match what is publicly advertised
          • There is consistent positive feedback from real traders

          When to Stay Skeptical of MyFastBroker.com’s Recommendations

          Caution is necessary when listings on myfastbroker.com show warning signs that suggest commercial influence or weak oversight.

          • Excessively promoted brokers with little transparency
          • Unclear licensing or offshore-only regulation
          • Frequent complaints about withdrawals or slippage
          • Overly optimistic marketing tied to myfastbroker trading platforms

          The Final Verdict on MyFastBroker.com Forex Brokers Reliability

          Myfastbroker serves as a useful discovery tool, but not a final authority. Traders should treat it as an initial filter rather than a guarantee of broker safety. The most reliable approach is to combine its listings with independent verification and personal testing.

          How to Choose the Right Broker Using MyFastBroker.com Reviews

          Choosing a broker via myfastbroker.com should follow a simple and logical process. This approach helps reduce risk while still benefiting from the platform’s comparison features.

          Step 1: Filter by Your Trading Profile

          Different traders need different broker conditions. Whether you focus on myfastbroker stock brokers or forex trading, first identify what suits your strategy.

          • Beginners: low deposit, user-friendly interface
          • Day traders: tight spreads and fast execution
          • Swing traders: stable swaps and lower overnight costs

          Step 2: Cross-Reference with Independent Sources

          Always compare myfastbroker.com data with third-party resources such as regulatory sites or professional broker review platforms to confirm legitimacy and performance accuracy.

          • Verify regulation through official authority websites
          • Check user feedback on neutral review forums
          • Compare ratings across multiple sources

          Step 3: Test Before Committing Large Capital

          Before fully trusting any broker found via myfastbroker trading apps or myfastbroker trading platforms, start with a small or demo account to observe real performance.

          • Open a demo or low-balance account
          • Monitor spreads, execution, and withdrawal speed
          • Increase capital only after consistent results

          FAQs about MyFastBroker.com Forex Brokers

          1. Who is the most trusted forex broker?

          The most trusted forex broker is usually one that holds strong regulation, offers transparent trading conditions, and has a long record of reliable withdrawals. Rather than relying solely on rankings from myfastbroker.com forex brokers, traders should verify licenses and review independent feedback before making a decision.

          2. Which broker is best for forex in the UK?

          The best forex broker in the UK is typically regulated by the FCA and follows strict client protection rules. While Myfastbroker can highlight potential options, traders should always cross-check brokers with UK regulatory sources for confirmation.

          3. How to check legit forex broker?

          To check if a forex broker is legitimate, confirm its regulatory license, check client fund protection policies, and review real trader complaints. Relying only on myfastbroker.com listings is not enough without additional verification.

          Conclusion

          Myfastbroker.com forex brokers can be a helpful starting point for discovering trading options, but reliability should never be assumed. Traders must verify regulation, test real trading conditions, and compare independent reviews before committing funds. Used carefully, myfastbroker.com forex brokers can support smarter choices, but true safety comes from personal checks and well-informed decision-making.

          Risk Warnings and Disclaimers
          You understand and acknowledge that there is a high degree of risk involved in trading. Following any strategies or investment methods may lead to potential losses. The content on the site is provided by our contributors and analysts for information purposes only. You are solely responsible for determining whether any trading assets, securities, strategy, or any other product is suitable for investing based on your own investment objectives and financial situation.
          Add to Favorites
          Share

          HSI Index Falls To November Low

          FXOpen

          Stocks

          Today, the Hong Kong stock index HSI is showing downward momentum, dropping below 25,200 for the first time since mid-October.

          Factors adding to selling pressure include (according to media reports):

          → Tech sector slump: Hong Kong is following the US, where investors have started offloading tech giants' shares amid fears of an AI "bubble." Market participants worry that current company valuations are overinflated. Even Nvidia's strong report released this week only provided a short-term boost.

          → Geopolitics: In addition to strained trade relations between China and the US, tensions with Japan have added to uncertainty.

          → China's economic data: Indicators continue to raise concerns despite government stimulus measures.
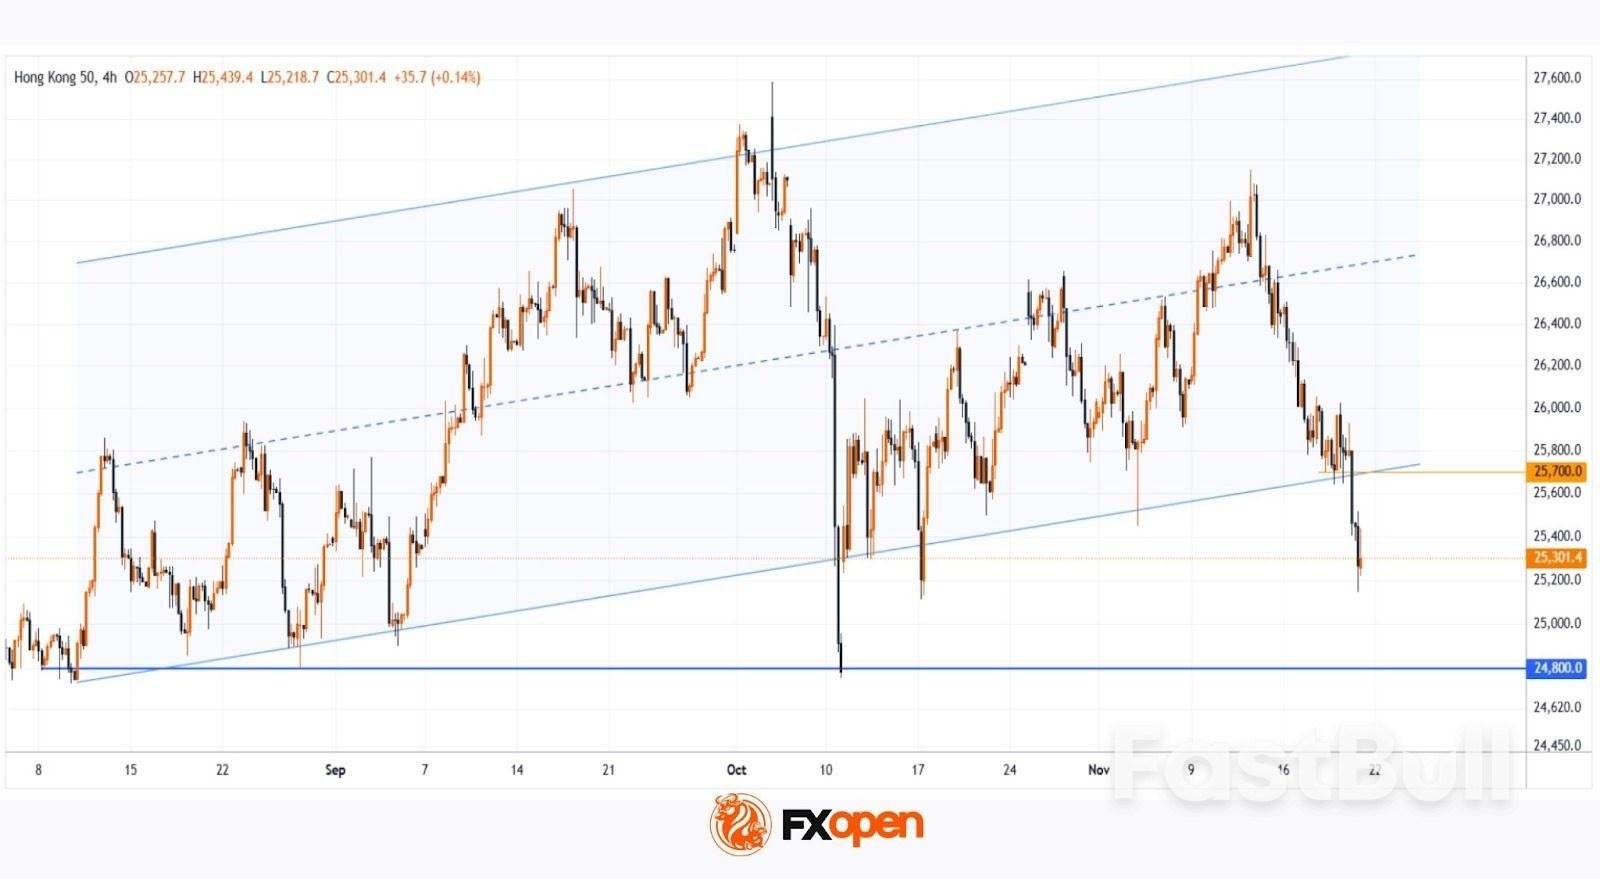
          Technical analysis of the HSI (Hong Kong 50 on FXOpen) shows that price action since late summer 2025 formed an upward channel (marked in blue).

          At the same time:

          → on 5 November, the price rebounded sharply from the lower boundary, confirming strong buying interest;

          → this week (as indicated by the arrow), it failed to reverse upwards.

          As a result, bears have pushed through an important support level and are attempting to consolidate their gains.

          It is possible that:

          → the 25,700 level (where the channel was broken) may act as resistance;

          → bears may grow more ambitious, potentially driving the HSI (Hong Kong 50 on FXOpen) down to test key support around 24,800 in the near term.

          Source: FXOpen

          Risk Warnings and Disclaimers
          You understand and acknowledge that there is a high degree of risk involved in trading. Following any strategies or investment methods may lead to potential losses. The content on the site is provided by our contributors and analysts for information purposes only. You are solely responsible for determining whether any trading assets, securities, strategy, or any other product is suitable for investing based on your own investment objectives and financial situation.
          Add to Favorites
          Share

          Gold (XAUUSD) Declines After Nonfarm Payrolls

          Winkelmann

          Commodity

          Forex

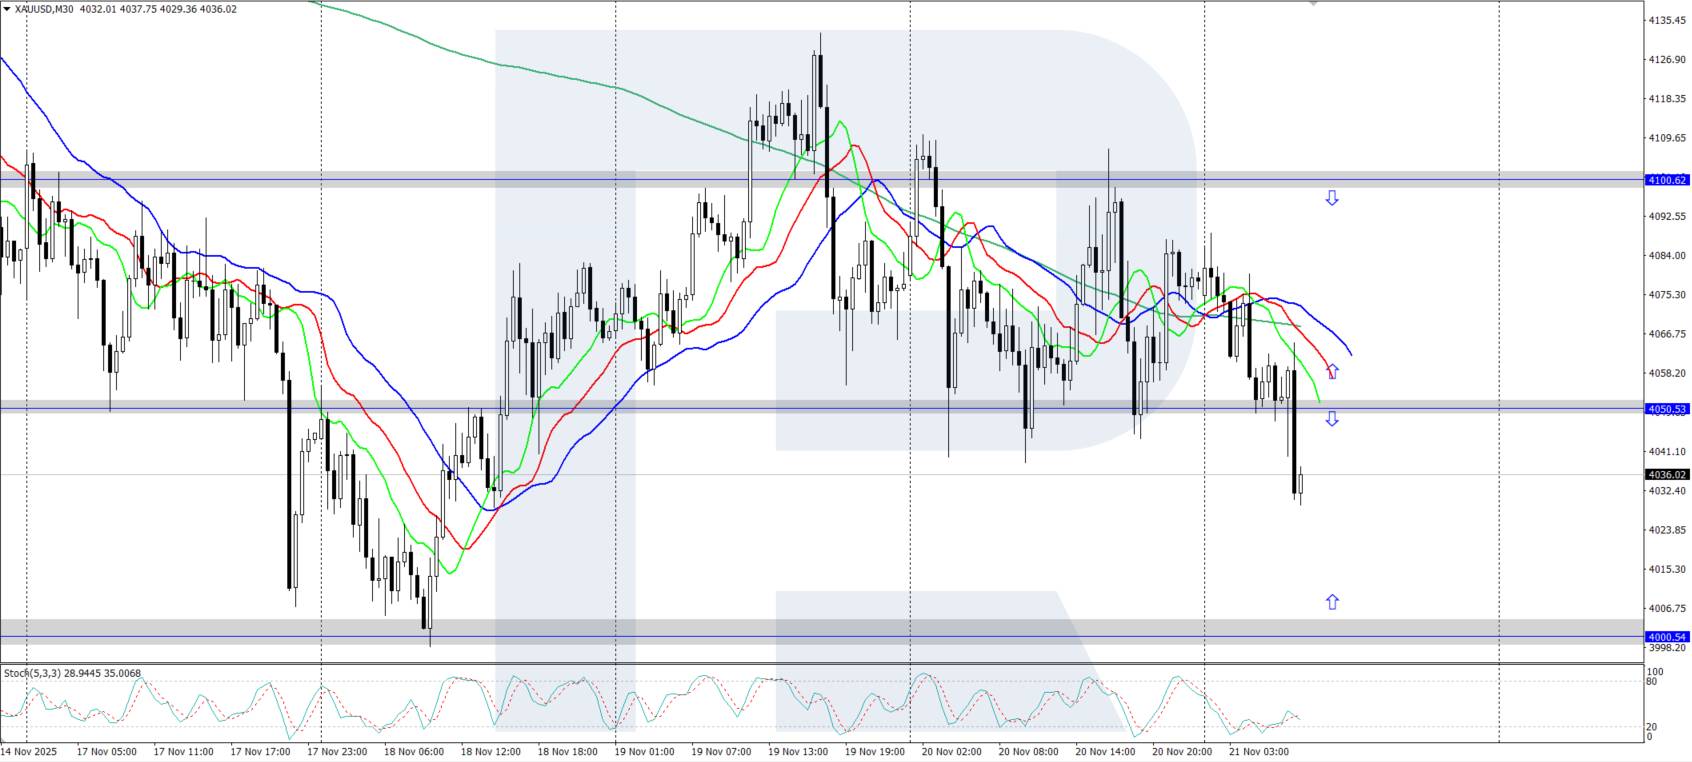
          XAUUSD prices have fallen towards the 4,030 USD area following the release of US labour market data.

          XAUUSD forecast: key trading points

          · Market focus: US Nonfarm Payrolls increased by 119 thousand in September
          · Current trend: correcting downwards
          · XAUUSD forecast for 21 November 2025: 4,100 or 4,000

          Fundamental analysis

          On Friday, XAUUSD prices are declining amid weakening expectations of a Federal Reserve rate cut in December after the release of the employment report.

          The long-awaited report from the US Department of Labor, delayed due to the government shutdown, showed that the number of nonfarm jobs increased by 119 thousand in September, exceeding the forecast of 50 thousand.

          Analysts note that these figures confirm the Fed's October assessment that the labour market is cooling but remains stable. Meanwhile, the unemployment rate rose to 4.4%, the highest level since October 2021, surpassing the expected 4.3%, while wage growth came in slightly above forecasts at 3.8%.

          XAUUSD technical analysis

          XAUUSD quotes corrected towards the area around 4,030 USD amid growing doubts about a further Federal Reserve rate cut this year. The Alligator indicator is pointing downwards, meaning the corrective movement may continue.

          The short-term XAUUSD price forecast suggests further growth towards 4,100 USD and higher if buyers regain control and find a foothold above 4,050 USD. Conversely, if sellers keep prices below 4,050 USD, a decline towards the 4,000 USD support level is possible.

          Summary

          Gold continues its downward correction, dropping to the 4,030 USD area as market participants doubt the Fed will cut rates at the December meeting.

          Source: RoboForex

          Risk Warnings and Disclaimers
          You understand and acknowledge that there is a high degree of risk involved in trading. Following any strategies or investment methods may lead to potential losses. The content on the site is provided by our contributors and analysts for information purposes only. You are solely responsible for determining whether any trading assets, securities, strategy, or any other product is suitable for investing based on your own investment objectives and financial situation.
          Add to Favorites
          Share

          Gold On Track For Weekly Fall As Strong US Jobs Data Dents Rate-cut Hopes

          Golden Gleam

          Economic

          Commodity

          Gold slipped on Friday and was heading for a weekly drop, as a stronger-than-expected US jobs report reinforced expectations that the Federal Reserve would refrain from cutting interest rates at its December meeting.

          Spot gold fell 0.9% to US$4,039.86 per ounce, as of 0643 GMT. Bullion has dipped 1% this week. US gold futures for December delivery dipped 0.6% to US$4,035.60 per ounce.

          "Gold prices are consolidating at the moment, and we see the dollar has strengthened quite a bit, and behind it, there is a lot of speculation whether the Fed will continue to cut interest rates or not," GoldSilver Central MD Brian Lan said.

          "I think now the market is unsure, and especially, now, when we are going to the end of December, we expect a lot of traders will be taking profit off their positions, and that's what we saw at the end of last week to this week."

          The dollar was on track on Friday for its strongest week in more than a month. A stronger dollar makes greenback-priced gold more expensive for holders of other currencies.

          The closely watched US Labor Department report, delayed by the federal government shutdown, showed that September non-farm payrolls increased by 119,000, more than double the estimated increase of 50,000.

          Traders now see nearly a 39% chance for a Fed rate cut next month. Gold, a non-yielding asset, tends to do well in low-interest-rate environments.

          Chicago Fed president Austan Goolsbee repeated on Thursday he is "uneasy" about frontloading rate cuts, particularly with progress on inflation towards the Fed's 2% goal looking to have stalled and starting to go the wrong way.

          Meanwhile, physical gold demand across major Asian markets remained weak this week, as volatility in rates deterred potential buyers from making purchases.

          Elsewhere, spot silver slipped 2.2% to US$49.48 per ounce, platinum fell 0.4% to US$1,505.96, and palladium dipped 1.4% to US$1,358.15.

          Source: Theedgemarkets

          To stay updated on all economic events of today, please check out our Economic calendar
          Risk Warnings and Disclaimers
          You understand and acknowledge that there is a high degree of risk involved in trading. Following any strategies or investment methods may lead to potential losses. The content on the site is provided by our contributors and analysts for information purposes only. You are solely responsible for determining whether any trading assets, securities, strategy, or any other product is suitable for investing based on your own investment objectives and financial situation.
          Add to Favorites
          Share

          Japan’s Pro-Stimulus Advisers to Outline Economic Vision Ahead of Critical BOJ Policy Meeting

          Gerik

          Economic

          Strategic Timing Ahead of BOJ’s December Deliberations

          In a move poised to influence both markets and monetary policymakers, a group of influential economic advisers aligned with Prime Minister Sanae Takaichi’s reflationary agenda will headline a panel discussion hosted by Keidanren, Japan’s top business lobby, on December 17. This event comes just 24 hours before the Bank of Japan (BOJ) begins its two-day monetary policy meeting, scheduled for December 18–19. The proximity of the forum to the BOJ meeting has sparked speculation that it may serve as a signal-setting venue for the administration’s preferred economic direction.
          The panel will feature prominent voices such as Etsuro Honda and Masazumi Wakatabe, both of whom have historically championed accommodative monetary policy and fiscal expansion. Their participation is notable not just for their ideological alignment with Takaichi, but for their potential to shape the BOJ's policy tone through public discourse.

          Reflationary Policy Advocates Reassert Influence

          Prime Minister Takaichi, who assumed office last month, has made reflating the Japanese economy a cornerstone of her economic platform. Her administration finalized a ¥20 trillion ($135 billion) stimulus package on Friday, financed in large part through new debt issuance. The December 17 panel, taking place from 2 to 4 p.m. in Tokyo, offers a platform for key economic thinkers to reinforce the administration’s policy priorities ahead of what could be a pivotal BOJ decision.
          Etsuro Honda has already warned against further rate hikes by the central bank, citing risks to economic recovery. Similarly, former BOJ Deputy Governor Masazumi Wakatabe told Reuters that it would be difficult for the central bank to justify another rate increase before the end of the year. Other panelists include economists Toshihiro Nagahama and Takuji Aida, both of whom have served on government panels advocating for large-scale stimulus.

          Causal Interplay Between Fiscal Policy, Monetary Strategy, and Currency Pressures

          The timing of the event also reflects the delicate balance between fiscal expansion and monetary normalization. Since Takaichi took office, concerns over aggressive government spending combined with the BOJ’s slow pace of interest rate normalization have weighed on the Japanese yen, which has fallen to a 10-month low against the U.S. dollar. The depreciation has raised fresh fears over imported inflation, prompting warnings from financial authorities about the potential impact on consumer prices.
          This presents a complex causal landscape: Takaichi’s stimulus-led strategy supports short-term growth but intensifies downward pressure on the yen, which in turn may compel the BOJ to consider rate hikes to stabilize the currency and manage inflation. Yet with core inflation still hovering around the BOJ’s target and growth remaining fragile, rate increases carry significant risks to domestic demand and debt sustainability.

          Monetary Policy at a Crossroads: What’s at Stake for the BOJ

          The December BOJ meeting will likely be a critical inflection point. If the board signals readiness to raise rates in early 2026, it would mark a departure from over a decade of ultra-loose monetary policy. However, the political environment, shaped by a newly elected administration with a pro-stimulus mandate, complicates that pathway.
          The BOJ must now weigh external pressure to address yen weakness and inflation concerns against internal pressure to maintain accommodative conditions for fiscal stimulus to take effect. The public remarks of Honda, Wakatabe, and other reflationist advisers on December 17 may provide insight into how the administration expects the central bank to position itself.
          With Japan navigating a fragile recovery, high debt levels, and volatile currency markets, the coordination between fiscal and monetary policy is more consequential than ever. The Keidanren panel offers a strategic opportunity for Prime Minister Takaichi’s economic advisers to assert their vision at a critical moment, potentially swaying the BOJ’s decision-making framework. Investors, policymakers, and international observers will be watching closely to discern whether Japan will double down on stimulus or begin recalibrating its approach to inflation and currency management.

          Source: Reuters

          To stay updated on all economic events of today, please check out our Economic calendar
          Risk Warnings and Disclaimers
          You understand and acknowledge that there is a high degree of risk involved in trading. Following any strategies or investment methods may lead to potential losses. The content on the site is provided by our contributors and analysts for information purposes only. You are solely responsible for determining whether any trading assets, securities, strategy, or any other product is suitable for investing based on your own investment objectives and financial situation.
          Add to Favorites
          Share

          Asian Markets Plunge Following Wall Street Reversal as AI Bubble Fears and Rate Uncertainty Weigh on Sentiment

          Gerik

          Economic

          Stocks

          Broad-Based Sell-Off Mirrors Wall Street Volatility

          Asian equities plunged on November 21 as markets mirrored the previous day’s dramatic downturn in U.S. stocks. Major indices across the region gave up earlier gains, with Japan’s Nikkei 225 falling 2.4% to 48,645.95, South Korea’s KOSPI plunging 3.9%, and China’s Hang Seng and Shanghai Composite indices down 2.3% and 1.8%, respectively. Australia’s S&P/ASX 200 dropped 1.5%, while Taiwan’s Taiex slid 3.2%. The widespread retreat follows one of the most volatile trading sessions on Wall Street this year, where initial optimism around AI leader Nvidia gave way to deep concerns about asset overvaluation.
          The cause of this synchronized regional decline is rooted in investor anxiety over the artificial intelligence sector’s sharp rally, which many now fear is unsustainable. The U.S. session on Thursday was defined by a sudden shift in sentiment: Nvidia and other AI-driven stocks surged early before collapsing later in the day. The Nasdaq Composite ended 2.2% lower, the S&P 500 dropped 1.6%, and the Dow Jones Industrial Average lost 0.8%.

          AI Bubble Concerns Deepen Despite Strong Nvidia Earnings

          Nvidia, a bellwether for the AI hype cycle, initially buoyed investor confidence with robust earnings and a revenue forecast that exceeded expectations. CEO Jensen Huang rejected concerns of an AI bubble, attempting to reassure markets. However, despite these fundamentals, traders appeared unconvinced. Nvidia’s stock reversed from a 5% morning gain to close 3.2% lower, illustrating that technical momentum and valuation fatigue may now be overpowering earnings performance.
          The broader correlation between Nvidia’s reversal and losses in other tech-heavy markets, such as South Korea and Taiwan, signals that AI-driven sentiment is still the dominant force shaping regional risk appetite. SK Hynix and Samsung Electronics two key semiconductor players fell 8.6% and 5.8%, respectively, as investor nervousness spread across global chip and data infrastructure stocks.

          Fed Policy Expectations Recalibrated on Strong Labor Data

          Adding to the global market strain was stronger-than-expected U.S. employment data. The economy added 119,000 jobs in September, more than double the forecast of 50,000. While this suggests economic strength, the causal implication is that the Federal Reserve may delay or cancel its next interest rate cut, as inflationary pressures may persist.
          With the Fed potentially holding rates higher for longer, growth-sensitive assets like tech and AI stocks become less attractive due to their reliance on low borrowing costs to justify high valuations. This monetary policy reassessment has compounded volatility and shifted market psychology away from risk-on positioning.

          Japan Faces Dual Pressures: Tariffs and Stimulus Expectations

          Japan’s economy faces its own set of pressures. Despite a 3.7% rise in exports globally in October, shipments to the U.S. declined due to new 15% tariffs under President Donald Trump’s trade framework. This export hit, combined with elevated inflation (3.0% in October), has dampened investor sentiment. Meanwhile, investors are awaiting details of a stimulus package from Prime Minister Sanae Takaichi, with anticipation of fiscal expansion weakening the yen and placing pressure on government bonds.
          Political tensions with China over Taiwan have further unsettled regional investors, adding a layer of geopolitical risk that weighed on Chinese and Japanese equities. The deterioration in diplomatic relations could potentially disrupt trade channels and deepen volatility in the weeks ahead.

          Oil Prices and Currency Markets Reflect Risk-Off Sentiment

          In commodities, oil prices slipped as investor sentiment cooled. U.S. benchmark crude fell by 77 cents to $58.23 per barrel, while Brent crude dropped 68 cents to $62.70. These declines reflect expectations of softer demand amid tightening financial conditions. Currency movements were relatively muted: the U.S. dollar edged down slightly to 157.39 yen, while the euro firmed marginally to $1.1539.
          Friday’s sell-off across Asian equities highlights the fragile nature of current market sentiment. While Nvidia’s earnings momentarily reignited AI enthusiasm, the broader market quickly pivoted to focus on stretched valuations, Federal Reserve policy uncertainty, and geopolitical instability. With little clarity on the Fed’s next move and concerns of an AI bubble persisting, investors appear poised for continued turbulence. The risk-off tone could deepen unless forthcoming data or policy guidance provides more definitive support for global risk assets.

          Source: AP

          To stay updated on all economic events of today, please check out our Economic calendar
          Risk Warnings and Disclaimers
          You understand and acknowledge that there is a high degree of risk involved in trading. Following any strategies or investment methods may lead to potential losses. The content on the site is provided by our contributors and analysts for information purposes only. You are solely responsible for determining whether any trading assets, securities, strategy, or any other product is suitable for investing based on your own investment objectives and financial situation.
          Add to Favorites
          Share
          FastBull
          Copyright © 2025 FastBull Ltd

          728 RM B 7/F GEE LOK IND BLDG NO 34 HUNG TO RD KWUN TONG KLN HONG KONG

          TelegramInstagramTwitterfacebooklinkedin
          App Store Google Play Google Play
          Products
          Charts

          Chats

          Q&A with Experts
          Screeners
          Economic Calendar
          Data
          Tools
          Membership
          Features
          Function
          Markets
          Copy Trading
          Latest Signals
          Contests
          News
          Analysis
          24/7
          Columns
          Education
          Company
          Careers
          About Us
          Contact Us
          Advertising
          Help Center
          Feedback
          User Agreement
          Privacy Policy
          Business

          White Label

          Data API

          Web Plug-ins

          Poster Maker

          Affiliate Program

          Risk Disclosure

          The risk of loss in trading financial instruments such as stocks, FX, commodities, futures, bonds, ETFs and crypto can be substantial. You may sustain a total loss of the funds that you deposit with your broker. Therefore, you should carefully consider whether such trading is suitable for you in light of your circumstances and financial resources.

          No decision to invest should be made without thoroughly conducting due diligence by yourself or consulting with your financial advisors. Our web content might not suit you since we don't know your financial conditions and investment needs. Our financial information might have latency or contain inaccuracy, so you should be fully responsible for any of your trading and investment decisions. The company will not be responsible for your capital loss.

          Without getting permission from the website, you are not allowed to copy the website's graphics, texts, or trademarks. Intellectual property rights in the content or data incorporated into this website belong to its providers and exchange merchants.

          Not Logged In

          Log in to access more features

          FastBull Membership

          Not yet

          Purchase

          Become a signal provider
          Help Center
          Customer Service
          Dark Mode
          Price Up/Down Colors

          Log In

          Sign Up

          Position
          Layout
          Fullscreen
          Default to Chart
          The chart page opens by default when you visit fastbull.com