Markets
News
Analysis
User
24/7
Economic Calendar
Education
Data
- Names
- Latest
- Prev


July’s US inflation data came in line with expectations for headline CPI and slightly higher on the core measure, but markets interpreted the release as supportive of a more accommodative Federal Reserve.
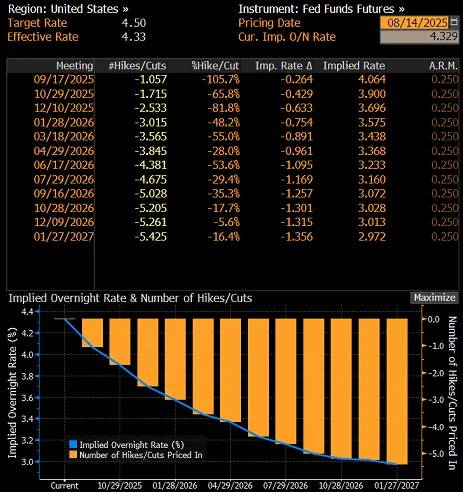
July’s US inflation data came in line with expectations for headline CPI and slightly higher on the core measure, but markets interpreted the release as supportive of a more accommodative Federal Reserve. On 12 August, Wall Street indices closed the session with notable gains, reflecting increased investor optimism over the economic outlook and interest rate prospects. The US dollar weakened against major currencies, while US Treasury yields declined. Fed Funds Futures almost fully priced in a 25bp rate cut in September, with markets also increasing bets on further easing before year-end.
The Fed’s dual mandate is shifting further towards prioritising maximum employment, a stance echoed by a growing number of Federal Open Market Committee (FOMC) members. The upcoming Jackson Hole symposium, due at the end of next week, will offer Chair Jerome Powell an opportunity to adjust the policy narrative. Historically, the Central Bankers’ Symposium in the Rocky Mountains has often marked turning points in US monetary policy.
Slower consumer price growth
In July 2025, headline CPI rose by 0.2% m/m compared with 0.3% in June, while the annual rate held steady at 2.7%, in line with forecasts. Core inflation edged up to 0.3% m/m and 3.1% y/y from 0.2% and 2.9% respectively, modestly exceeding expectations on the yearly reading.
Price breakdown – energy falls, food flat
Energy prices fell by 1.1% m/m, while food prices were unchanged. In core goods (excluding vehicles), price growth slowed to +0.2% m/m from +0.55% in June. Increases were seen in furniture (+0.9%), used cars (+0.5%), sporting goods (+0.4%) and clothing (+0.1%). Household appliance prices unexpectedly declined by 0.9%.
Seasonal gains in services
Airfares rose by 4% m/m, while medical services costs increased by 0.7%, largely due to dental services. Shelter costs rose only modestly, by 0.2%.
No tariff-driven inflation pressure
The absence of signs of rising inflationary pressure following President Trump’s tariff measures suggests that businesses are absorbing higher costs in their margins rather than passing them on to consumers. This is supported by the latest NFIB survey, which showed the share of small firms planning price hikes in the next three months falling to 28% from 32%, pointing to demand-side constraints.
Inflation and Fed policy outlook
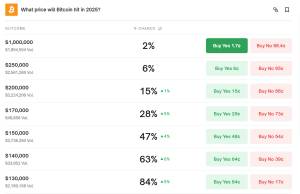
Analysts see little risk of inflation breaching 4% y/y this autumn, with growing odds of a decline below 2% by the end of 2026. The data reinforce expectations for a 25bp Fed rate cut in September, followed by another in December. Fed Funds Futures are currently pricing in 26bp of easing at the 17 September FOMC meeting and a total of 63bp by year-end.
Trump steps up pressure on Powell
President Donald Trump has intensified his calls for swift rate cuts, even suggesting he might sue Fed Chair Jerome Powell, accusing him of incompetence in overseeing building renovations at the central bank.
FOMC members’ comments
Thomas Barkin noted that the balance of risks for the labour market and inflation remains unclear, and that the Fed is well positioned to respond appropriately. Stephen Miran, a new Board Governor appointed by Trump, stated that there is no evidence of tariff-driven inflation, adding that rent increases are partly linked to illegal immigration. Jeff Schmid argued that while growth remains solid, inflation is still too high, warranting a moderately restrictive stance. He added, however, that he would be prepared to change his view should demand weaken materially.
What next for the dollar?
In the week ending 5 August, net short USD positions fell sharply by $4.3bn – the fourth consecutive weekly reduction. The net short now stands at $7bn, down from a local peak of $18.6bn in early July.
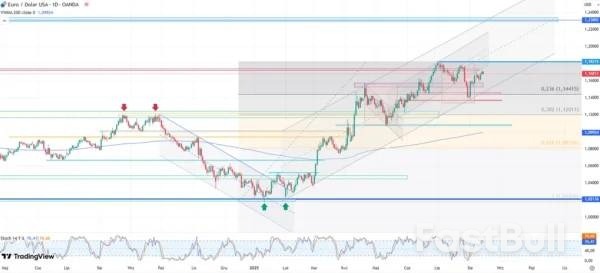
It is worth noting that these figures are lagging indicators and do not yet reflect the most recent moves in FX markets. The unwinding of short positions was visible in EUR/USD’s July pullback, although the latest disappointing non-farm payrolls data reignited selling pressure on the dollar. The uptrend in the pair remains technically intact, and August’s inflation figures have only strengthened the likelihood of further gains. The next upside target for EUR/USD is 1.18, with a break above this level opening the way towards 1.20–1.23.
728 RM B 7/F GEE LOK IND BLDG NO 34 HUNG TO RD KWUN TONG KLN HONG KONG


The risk of loss in trading financial instruments such as stocks, FX, commodities, futures, bonds, ETFs and crypto can be substantial. You may sustain a total loss of the funds that you deposit with your broker. Therefore, you should carefully consider whether such trading is suitable for you in light of your circumstances and financial resources.
No decision to invest should be made without thoroughly conducting due diligence by yourself or consulting with your financial advisors. Our web content might not suit you since we don't know your financial conditions and investment needs. Our financial information might have latency or contain inaccuracy, so you should be fully responsible for any of your trading and investment decisions. The company will not be responsible for your capital loss.
Without getting permission from the website, you are not allowed to copy the website's graphics, texts, or trademarks. Intellectual property rights in the content or data incorporated into this website belong to its providers and exchange merchants.
Not Logged In
Log in to access more features

FastBull Membership
Not yet
Purchase


Log In
Sign Up