• Trade
  • Markets
  • Copy
  • Contests
  • 24/7
  • Calendar
  • Q&A
  • Chats
Screeners
SYMBOL
LAST
BID
ASK
HIGH
LOW
NET CHG.
%CHG.
SPREAD
SPX
S&P 500 Index
6575.33
6575.33
6575.33
6609.68
6554.28
+46.81
+ 0.72%
--
DJI
Dow Jones Industrial Average
46565.73
46565.73
46565.73
46803.36
46396.12
+224.21
+ 0.48%
--
IXIC
NASDAQ Composite Index
21840.94
21840.94
21840.94
21983.07
21723.72
+250.32
+ 1.16%
--
USDX
US Dollar Index
99.640
99.640
99.720
99.700
99.230
+0.270
+ 0.27%
--
EURUSD
Euro / US Dollar
1.15546
1.15546
1.15555
1.16053
1.15453
-0.00356
-0.31%
--
GBPUSD
Pound Sterling / US Dollar
1.32563
1.32563
1.32576
1.33200
1.32473
-0.00498
-0.37%
--
XAUUSD
Gold / US Dollar
4708.82
4708.82
4709.27
4800.35
4649.60
-48.98
-1.03%
--
WTI
Light Sweet Crude Oil
98.110
98.110
98.145
98.954
92.483
+3.956
+ 4.20%
--

Community Accounts

Signal Accounts
--
Profit Accounts
--
Loss Accounts
--
View More

Become a signal provider

Sell trading signals to earn additional income

View More

Guide to Copy Trading

Get started with ease and confidence

View More

Signal Accounts for Members

All Signal Accounts

Best Return
  • Best Return
  • Best P/L
  • Best MDD
Past 1W
  • Past 1W
  • Past 1M
  • Past 1Y

All Contests

  • All
  • Trump Updates
  • Recommend
  • Stocks
  • Cryptocurrencies
  • Central Banks
  • Featured News
Top News Only
Share

The Yield On Japan's 30-year Government Bonds Rose 5.0 Basis Points To 3.665%

Share

Nomura: The Chip Industry's Uptrend Has Yet To Peak; South Korea's Trade Surplus Could Double

Share

The Beijing Stock Exchange 50 Index Opened Lower But Then Rose, Currently Up Over 1%

Share

Heilongjiang Province Introduces The "40 Measures For Financial Support Of Consumption In Heilongjiang Province"

Share

The Hang Seng Index Fell 1%, With Longfor Group And Alibaba Leading The Decline Among Constituent Stocks, Both Down 3%

Share

A-share Optical Fiber Concept Stocks Were Active, With Zhongli Group, Xineng Taishan And Huiyuan Communication Hitting The Daily Limit, Guangku Technology Rising More Than 10%, Yangtze Optical Fibre And Cable Rising More Than 6%, And Huamai Technology And Shijia Photonics Following Suit

Share

The South Korean KOSPI Index Fell To 5300 Points, Down 3.29% On The Day

Share

The Hang Seng Tech Index Fell By More Than 1%, While The Hang Seng Index Fell By 0.6%

Share

The A-share Shipbuilding Sector Continued To Rise, With China Power Up More Than 4%, And Jiuzhiyang, China Shipbuilding Special Gas, China Shipbuilding Defense And China Shipbuilding Following Suit

Share

The Shanghai Composite Index Turned Positive First, While The ChiNext Index Narrowed Its Losses To 0.6%. Shale Gas, Coal, And Shipping Sectors Led The Gains

Share

Australian Prime Minister: The Government Will Provide A$1 Billion In Credit Support To Businesses And Farmers Affected By The Oil Crisis

Share

Amena Bakr, Reporter For The Energy Intelligence Group: We Haven't Heard Anything New Here—just A Rehash Of All The Posts And Tweets. Once Again, It's A Message To The World Assuring Everyone That Everything Is Fine, Even Though The Conflict Drags On And Navigation Through The Strait Of Hormuz Remains Severely Restricted

Share

Expectations Of Military Escalation Hedge Against The Benefits Of Withdrawal; Trump's Speech Triggers Tremendous Market Shock

Share

The A-share Oil And Gas Exploration Sector Continued To Rise, With Blue Flame Holdings And Beken Energy Both Hitting The Daily Limit, While Zhongman Petroleum, Guanghui Energy, Intercontinental Oil & Gas, And CNOOC Followed Suit

Share

[Spot Gold Plunges Over $100 Intraday] April 2nd - Trump Stated That The US Will Continue To Pressure Iran. As A Result, The Price Of Spot Gold Continues To Fall, Plummeting Over $100 Intraday To $4656.50 Per Ounce, A 2.11% Decrease

Share

Australian Prime Minister Albanese: The Situation In Iran Remains Unclear, And It Is Still Unknown What Goals Have Not Yet Been Achieved

Share

The Main Contract For The Container Shipping Index (European Route) Has Reversed Its Decline And Is Currently Trading At 2204 Points, Up 0.41%, After Previously Falling By More Than 6%

Share

International Oil Prices Surged, Driving A Broad Rally In Hong Kong-listed Oilfield Services Stocks: Baqin Oil Services Jumped More Than 11%, Shandong Molong Rose Over 8%, And Sinopec Services, Huayou Energy, And DaliPu Holdings All Gained More Than 2%

Share

Javier Blas, Bloomberg's Energy And Commodities Columnist: President Trump Declared Victory Over Iran But Then Called For Another Two To Three Weeks Of War. He Did Not Outline A Path To Reopening The Strait Of Hormuz. He Said, "The Countries In The World That Get Their Oil Through The Strait Of Hormuz Must Take Responsibility For Keeping The Channel Open."

Share

Spot Gold Fell Below $4,680 Per Ounce, Down 1.63% On The Day

TIME
ACT
FCST
PREV
South Africa Manufacturing PMI (Mar)

A:--

F: --

P: --

Euro Zone Unemployment Rate (Feb)

A:--

F: --

P: --

U.S. MBA Mortgage Application Activity Index WoW

A:--

F: --

P: --

U.S. ADP Employment (Mar)

A:--

F: --

P: --
U.S. Retail Sales YoY (Feb)

A:--

F: --

P: --

U.S. Retail Sales MoM (Feb)

A:--

F: --

P: --
U.S. Core Retail Sales MoM (Feb)

A:--

F: --

P: --

U.S. Core Retail Sales (Feb)

A:--

F: --

P: --

U.S. Retail Sales (Feb)

A:--

F: --

P: --

Brazil IHS Markit Manufacturing PMI (Mar)

A:--

F: --

P: --

Canada Manufacturing PMI (SA) (Mar)

A:--

F: --

P: --

U.S. ISM Inventories Index (Mar)

A:--

F: --

P: --

U.S. ISM Manufacturing Employment Index (Mar)

A:--

F: --

P: --

U.S. Commercial Inventory MoM (Jan)

A:--

F: --

P: --
U.S. ISM Output Index (Mar)

A:--

F: --

P: --

U.S. ISM Manufacturing PMI (Mar)

A:--

F: --

P: --

U.S. ISM Manufacturing New Orders Index (Mar)

A:--

F: --

P: --

U.S. EIA Weekly Crude Stocks Change

A:--

F: --

P: --

U.S. EIA Weekly Crude Oil Imports Changes

A:--

F: --

P: --

U.S. EIA Weekly Gasoline Stocks Change

A:--

F: --

P: --

U.S. EIA Weekly Heating Oil Stock Changes

A:--

F: --

P: --

U.S. EIA Weekly Crude Demand Projected by Production

A:--

F: --

P: --

U.S. EIA Weekly Cushing, Oklahoma Crude Oil Stocks Change

A:--

F: --

P: --

Mexico Manufacturing PMI (Mar)

A:--

F: --

P: --

Russia Retail Sales YoY (Feb)

A:--

F: --

P: --

Russia Unemployment Rate (Feb)

A:--

F: --

P: --

South Korea CPI YoY (Mar)

A:--

F: --

P: --

Japan Monetary Base YoY (SA) (Mar)

A:--

F: --

P: --

Australia Exports MoM (SA) (Feb)

A:--

F: --

P: --
Australia Trade Balance (SA) (Feb)

A:--

F: --

P: --
Japan 10-Year Note Auction Yield

--

F: --

P: --

India HSBC Manufacturing PMI Final (Mar)

--

F: --

P: --

Italy Retail Sales MoM (SA) (Feb)

--

F: --

P: --

U.S. Challenger Job Cuts MoM (Mar)

--

F: --

P: --

U.S. Challenger Job Cuts YoY (Mar)

--

F: --

P: --

U.S. Challenger Job Cuts (Mar)

--

F: --

P: --

U.S. Weekly Initial Jobless Claims (SA)

--

F: --

P: --

Canada Imports (SA) (Feb)

--

F: --

P: --

Canada Trade Balance (SA) (Feb)

--

F: --

P: --

Canada Exports (SA) (Feb)

--

F: --

P: --

U.S. Weekly Continued Jobless Claims (SA)

--

F: --

P: --

U.S. Trade Balance (Feb)

--

F: --

P: --

U.S. Initial Jobless Claims 4-Week Avg. (SA)

--

F: --

P: --

U.S. Exports (Feb)

--

F: --

P: --

U.S. EIA Weekly Natural Gas Stocks Change

--

F: --

P: --

U.S. Weekly Total Rig Count

--

F: --

P: --

U.S. Weekly Total Oil Rig Count

--

F: --

P: --

U.S. Weekly Treasuries Held by Foreign Central Banks

--

F: --

P: --

Japan IHS Markit Composite PMI (Mar)

--

F: --

P: --

Japan IHS Markit Services PMI (Mar)

--

F: --

P: --

China, Mainland Caixin Services PMI (Mar)

--

F: --

P: --

China, Mainland Caixin Composite PMI (Mar)

--

F: --

P: --

Russia IHS Markit Services PMI (Mar)

--

F: --

P: --

France Industrial Output MoM (SA) (Feb)

--

F: --

P: --

Turkey PPI YoY (Mar)

--

F: --

P: --

Turkey CPI YoY (Mar)

--

F: --

P: --

India Deposit Gowth YoY

--

F: --

P: --

U.S. Average Hourly Wage YoY (Mar)

--

F: --

P: --

U.S. Unemployment Rate (SA) (Mar)

--

F: --

P: --

Q&A with Experts
    • All
    • Chatrooms
    • Groups
    • Friends
    Ikeh Sunday flag
    sush flag
    how much gold will.fall?
    Kung Fu flag
    sush
    how much gold will.fall?
    @sushI'd rather stay out of this sell in the meantime
    Ikeh Sunday flag
    Ikeh Sunday flag
    KIDZSTAN 🇹🇿 flag
    markets were just running smooth
    KIDZSTAN 🇹🇿 flag
    donald trump has started disrupting evrythng again
    Ikeh Sunday flag
    Kung Fu flag
    KIDZSTAN 🇹🇿
    markets were just running smooth
    @KIDZSTAN 🇹🇿🤣 🤣🤣 Trump is badly trumoing the markets. He knows what he's doing
    KIDZSTAN 🇹🇿 flag
    @Kung Fu man this guy anoys me
    Onit flag
    is this going to continue or will price retrace
    Kung Fu flag
    KIDZSTAN 🇹🇿
    @Kung Fu man this guy anoys me
    @KIDZSTAN 🇹🇿I just relish what he does.
    Kung Fu flag
    Onit
    is this going to continue or will price retrace
    @Onitnah, this is Asia - don't forget. It's got its limits
    Kung Fu flag
    Onit
    is this going to continue or will price retrace
    @OnitI think now the Asian low has been established.
    Charizard flag
    Kung Fu
    @OnitI think now the Asian low has been established.
    @Kung Fu Looking to buy again?
    Onit flag
    i bought oil at the bottom just now
    Onit flag
    i’ll probably tp now though
    Kung Fu flag
    Charizard
    @Kung Fu Looking to buy again?
    @Charizardyes, looking to buy in this broader Asian range
    Onit flag
    Charizard
    @Kung Fu Looking to buy again?
    @Charizard based on this
    Kung Fu flag
    Charizard
    @Kung Fu Looking to buy again?
    @Charizardbut not immediately. There will be a short period of consolidation before the upmove
    Type here...
    Add Symbol or Code

      No matching data

      All
      Trump Updates
      Recommend
      Stocks
      Cryptocurrencies
      Central Banks
      Featured News
      • All
      • Russia-Ukraine Conflict
      • Middle East Flashpoint
      • All
      • Russia-Ukraine Conflict
      • Middle East Flashpoint
      Search
      Products

      Charts Free Forever

      Chats Q&A with Experts
      Screeners Economic Calendar Data Tools
      Membership Features
      Data Warehouse Market Trends Institutional Data Policy Rates Macro

      Market Trends

      Market Sentiment Order Book Forex Correlations

      Top Indicators

      Charts Free Forever
      Markets

      News

      24/7 Analysis Education

      Latest Views

      Latest Update

      Signals

      Copy Rankings Latest Signals Become a signal provider AI Rating
      Contests
      Brokers

      Overview Brokers Assessment Rankings Regulators News Claims
      Broker listing Forex Brokers Comparison Tool Live Spread Comparison Scam
      Q&A Complaint Scam Alert Videos Tips to Detect Scam
      More

      Business
      Events
      Careers About Us Advertising Help Center

      White Label

      Broker API

      Data API

      Web Plug-ins

      Affiliate Program

      Awards Institution Evaluation IB Seminar Salon Event Exhibition
      Vietnam Thailand Singapore Dubai
      Fans Party Investment Sharing Session
      FastBull Summit BrokersView Expo
      Recent Searches
        Top Searches
          Markets
          Analysis
          User
          24/7
          Economic Calendar
          Education
          Data
          • Names
          • Latest
          • Prev

          View All

          No data

          Scan to Download

          Faster Charts, Chat Faster!

          Download App
          English
          • English
          • Español
          • العربية
          • Bahasa Indonesia
          • Bahasa Melayu
          • Tiếng Việt
          • ภาษาไทย
          • Français
          • Italiano
          • Türkçe
          • Русский язык
          • 简中
          • 繁中
          Open Account
          Search
          Products
          Charts Free Forever
          Markets
          News
          Signals

          Copy Rankings Latest Signals Become a signal provider AI Rating
          Contests
          Brokers

          Overview Brokers Assessment Rankings Regulators News Claims
          Broker listing Forex Brokers Comparison Tool Live Spread Comparison Scam
          Q&A Complaint Scam Alert Videos Tips to Detect Scam
          More

          Business
          Events
          Careers About Us Advertising Help Center

          White Label

          Broker API

          Data API

          Web Plug-ins

          Affiliate Program

          Awards Institution Evaluation IB Seminar Salon Event Exhibition
          Vietnam Thailand Singapore Dubai
          Fans Party Investment Sharing Session
          FastBull Summit BrokersView Expo

          Trump's 50 Percent Tariff on India Takes Effect

          Glendon

          Economic

          Forex

          Summary:

          President Donald Trump’s additional 25 percent tariff on India became effective at midnight on Aug. 27, bringing the total rate to 50 percent on many imports entering the United States.

          President Donald Trump’s additional 25 percent tariff on India became effective at midnight on Aug. 27, bringing the total rate to 50 percent on many imports entering the United States.

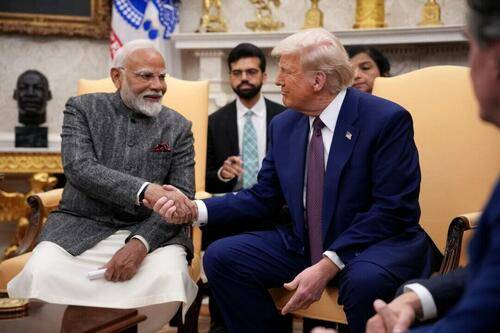
          The president, in his global tariffs announcement in April, introduced a 26 percent levy on Indian goods, aimed at pressuring the Indian government to lower its trade barriers. Months later, the rate was revised slightly lower to 25 percent.

          In an Aug. 6 executive order, Trump implemented an additional 25 percent tariff on India, saying its government is “currently directly or indirectly importing Russian Federation oil.”

          Since Russia invaded Ukraine in 2022, India has been one of Russia’s most significant trading partners, with annual bilateral trade reaching almost $69 billion.

          Energy has been the primary product uniting the two countries for the past few years.

          With crude oil imports exceeding $52 billion last year, India accounts for an estimated one-third of Russia’s petroleum exports, fueled by a sanction-driven discount.

          In December 2024, the Group of Seven (G7) introduced a price cap of $60 per barrel on Russian Urals crude to reduce the country’s oil revenues. Because global oil prices have declined—a barrel of U.S. West Texas Intermediate crude oil is trading at roughly $64 per barrel—the discount has become minimal.

          “India swapped high-shipping-cost crude from the US, South America, and Africa with cheaper Russian crude,” energy economist Anas Alhajji said in a note for Energy Outlook Advisors. “About 932 kb/d [1,000 barrels per day] of costlier oil or oil redirected to Kuwait and Oman’s refineries was replaced by Russian imports. Sanctions on Russian crude shaped trade directions and India’s purchasing patterns.”

          U.S. officials say that India’s continued transactions are funding Russia’s war effort in Ukraine.

          In an Aug. 4 Truth Social post, Trump said India has been exploiting discounted Russian crude to sell it “on the open market for big profits.”

          “They don’t care how many people in Ukraine are being killed by the Russian War Machine,” he said.

          India’s government has dismissed these criticisms, stating in a response to The Epoch Times that these purchases are aimed at providing its nearly 1.5 billion population with affordable energy.

          “In this background, the targeting of India is unjustified and unreasonable,” a spokesperson for the Indian Foreign Ministry said.

          White House top trade adviser Peter Navarro echoed the president’s sentiment, telling reporters this past week that India has been “profiteering” on the war in Ukraine.

          “India doesn’t appear to want to recognize its role in the bloodshed,” Navarro said on Aug. 21.

          He also said India’s current trade policies are detrimental to the United States.

          Peter Navarro, White House senior counselor for trade and manufacturing, speaks to reporters at the White House on Feb. 4, 2025. Madalina Vasiliu/The Epoch Times

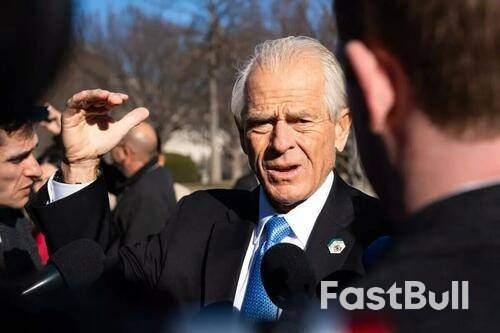
          “We run a massive trade deficit with them. So that hurts American workers, hurts American businesses,” Navarro said.

          “Then they use the money that they get from us when they sell us stuff to buy Russian oil, which is then processed by refiners, and they make a bunch of money there. But then the Russians use the money to build more arms and kill Ukrainians, and so American taxpayers have to provide more aid, military-style, to the Ukrainians.”

          According to the U.S. Trade Representative’s Office, the U.S. goods trade deficit with India was nearly $46 billion in 2024, representing a 5.9 percent increase from the previous year.

          Trade Moving Forward

          New tariffs are expected to disrupt the more than $200 billion in annual U.S.–India trade. A modest drop in imports of Indian goods was observed in the latest data.

          In June, according to the Bureau of Economic Analysis, imports tumbled 3 percent from the previous month but were up 29 percent year-over-year.

          New data from Descartes Systems Group indicate a significant rise in U.S. container imports, with volumes increasing by more than 18 percent in July compared to June. Notably, the group’s August Global Shipping Report highlights a nearly 14 percent surge in shipments from India—underscoring companies’ preparations for the White House’s tariffs.

          “Trade uncertainty remains high, however, as U.S. importers evaluate their supply chains in the face of the August 1 implementation of reciprocal duties on over 60 countries, the August 7 start of India-specific tariffs and the universal copper tariff, and the October 15 expiration of the U.S.–China tariff truce,” Jackson Wood, director of industry strategy at Descartes, said in a statement.

          The state of trade negotiations remains unclear after a planned visit by a U.S. trade delegation to New Delhi this week was canceled.

          At a recent Economic Times forum in New Delhi, Indian Foreign Minister Subrahmanyam Jaishankar said that discussions are continuing, but there are policies that his government wishes to defend, particularly for farmers and small businesses.

          “We have some redlines in the negotiations, to be maintained and defended,” he said. “It is our right to make decisions in our ‘national interest.’”

          ING economists warn that India’s growth prospects are uncertain amid potential trade strife.

          The consensus forecast suggests that India’s economy expanded by 6.6 percent in the second quarter, down from the 7.4 percent growth rate in the first three months of 2025.

          “High-frequency indicators point to a moderation in both private consumption and investment. Additionally, higher-than-expected tariffs and rising uncertainty around India’s trade policy with the US are emerging as downside risks to the 2025 growth outlook,” the ING economists said in a note.

          Policymakers are using the current trade situation with the United States as a measure to employ domestic reforms, such as changes to the goods and services tax. The government might also be hedging its geopolitical bets as leaders attempt to enhance relations with China.

          Indian Prime Minister Narendra Modi is scheduled to meet with Chinese leader Xi Jinping later this week on the sidelines of the Shanghai Cooperation Organisation. This will be Modi’s first visit to China in seven years.

          According to Joe Maher, assistant economist at Capital Economics, a 50 percent tariff “would be large enough to have a material impact on [gross domestic product] growth” for India.

          “If it sticks, the resulting drop in exports to the US could reduce GDP growth by 0.8%-pts both this year and next,” Maher said in a note.

          Source: Zero Hedge

          To stay updated on all economic events of today, please check out our Economic calendar
          Risk Warnings and Disclaimers
          You understand and acknowledge that there is a high degree of risk involved in trading. Following any strategies or investment methods may lead to potential losses. The content on the site is provided by our contributors and analysts for information purposes only. You are solely responsible for determining whether any trading assets, securities, strategy, or any other product is suitable for investing based on your own investment objectives and financial situation.
          Add to Favorites
          Share
          FastBull
          Copyright © 2026 FastBull Ltd

          728 RM B 7/F GEE LOK IND BLDG NO 34 HUNG TO RD KWUN TONG KLN HONG KONG

          TelegramInstagramTwitterfacebooklinkedin
          App Store Google Play Google Play
          Products
          Charts

          Chats

          Q&A with Experts
          Screeners
          Economic Calendar
          Data
          Tools
          Membership
          Features
          Function
          Markets
          Copy Trading
          Latest Signals
          Contests
          24/7
          Analysis
          Education
          Company
          Careers
          About Us
          Contact Us
          Advertising
          Help Center
          Feedback
          User Agreement
          Privacy Policy
          Personal Information Protection Statement
          Business

          White Label

          Broker API

          Data API

          Web Plug-ins

          Poster Maker

          Affiliate Program

          Risk Disclosure

          The risk of loss in trading financial instruments such as stocks, FX, commodities, futures, bonds, ETFs and crypto can be substantial. You may sustain a total loss of the funds that you deposit with your broker. Therefore, you should carefully consider whether such trading is suitable for you in light of your circumstances and financial resources.

          No decision to invest should be made without thoroughly conducting due diligence by yourself or consulting with your financial advisors. Our web content might not suit you since we don't know your financial conditions and investment needs. Our financial information might have latency or contain inaccuracy, so you should be fully responsible for any of your trading and investment decisions. The company will not be responsible for your capital loss.

          Without getting permission from the website, you are not allowed to copy the website's graphics, texts, or trademarks. Intellectual property rights in the content or data incorporated into this website belong to its providers and exchange merchants.

          Not Logged In

          Log in to access more features

          Connect Broker
          Become a signal provider
          Help Center
          Customer Service
          Dark Mode
          Price Up/Down Colors

          Log In

          Sign Up

          Position
          Layout
          Fullscreen
          Default to Chart
          The chart page opens by default when you visit fastbull.com