

Markets
News
Analysis
User
24/7
Economic Calendar
Education
Data
- Names
- Latest
- Prev


Signal Accounts for Members
All Signal Accounts
All Contests
 Japan Tankan Small Manufacturing Outlook Index (Q4)
A:--
F: --
P: --
Japan Tankan Large Non-Manufacturing Outlook Index (Q4)A:--
F: --
P: --
Japan Tankan Large Manufacturing Outlook Index (Q4)A:--
F: --
P: --
Japan Tankan Small Manufacturing Diffusion Index (Q4)A:--
F: --
P: --
Japan Tankan Large-Enterprise Capital Expenditure YoY (Q4)A:--
F: --
P: --
 U.K. Rightmove House Price Index YoY (Dec)
A:--
F: --
P: --
 China, Mainland Industrial Output YoY (YTD) (Nov)
A:--
F: --
P: --
China, Mainland Urban Area Unemployment Rate (Nov)A:--
F: --
P: --
 Saudi Arabia CPI YoY (Nov)
A:--
F: --
P: --
 Euro Zone Industrial Output YoY (Oct)
A:--
F: --
P: --
Euro Zone Industrial Output MoM (Oct)A:--
F: --
P: --
 Canada Existing Home Sales MoM (Nov)
A:--
F: --
P: --
Canada National Economic Confidence IndexA:--
F: --
P: --
Canada New Housing Starts (Nov)A:--
F: --
 U.S. NY Fed Manufacturing Employment Index (Dec)
A:--
F: --
P: --
U.S. NY Fed Manufacturing Index (Dec)A:--
F: --
P: --
Canada Core CPI YoY (Nov)A:--
F: --
P: --
Canada Manufacturing Unfilled Orders MoM (Oct)A:--
F: --
P: --
U.S. NY Fed Manufacturing Prices Received Index (Dec)A:--
F: --
P: --
U.S. NY Fed Manufacturing New Orders Index (Dec)A:--
F: --
P: --
Canada Manufacturing New Orders MoM (Oct)A:--
F: --
P: --
Canada Core CPI MoM (Nov)A:--
F: --
P: --
Canada Trimmed CPI YoY (SA) (Nov)A:--
F: --
P: --
Canada Manufacturing Inventory MoM (Oct)A:--
F: --
P: --
Canada CPI YoY (Nov)A:--
F: --
P: --
Canada CPI MoM (Nov)A:--
F: --
P: --
Canada CPI YoY (SA) (Nov)A:--
F: --
P: --
Canada Core CPI MoM (SA) (Nov)A:--
F: --
P: --
Canada CPI MoM (SA) (Nov)A:--
F: --
P: --
Federal Reserve Board Governor Milan delivered a speech U.S. NAHB Housing Market Index (Dec)A:--
F: --
P: --
 Australia Composite PMI Prelim (Dec)
--
F: --
P: --
Australia Services PMI Prelim (Dec)--
F: --
P: --
Australia Manufacturing PMI Prelim (Dec)--
F: --
P: --
Japan Manufacturing PMI Prelim (SA) (Dec)--
F: --
P: --
U.K. 3-Month ILO Employment Change (Oct)--
F: --
P: --
U.K. Unemployment Claimant Count (Nov)--
F: --
P: --
U.K. Unemployment Rate (Nov)--
F: --
P: --
U.K. 3-Month ILO Unemployment Rate (Oct)--
F: --
P: --
U.K. Average Weekly Earnings (3-Month Average, Including Bonuses) YoY (Oct)--
F: --
P: --
U.K. Average Weekly Earnings (3-Month Average, Excluding Bonuses) YoY (Oct)--
F: --
P: --
 France Services PMI Prelim (Dec)
--
F: --
P: --
France Composite PMI Prelim (SA) (Dec)--
F: --
P: --
France Manufacturing PMI Prelim (Dec)--
F: --
P: --
 Germany Services PMI Prelim (SA) (Dec)
--
F: --
P: --
Germany Manufacturing PMI Prelim (SA) (Dec)--
F: --
P: --
Germany Composite PMI Prelim (SA) (Dec)--
F: --
P: --
Euro Zone Composite PMI Prelim (SA) (Dec)--
F: --
P: --
Euro Zone Services PMI Prelim (SA) (Dec)--
F: --
P: --
Euro Zone Manufacturing PMI Prelim (SA) (Dec)--
F: --
P: --
U.K. Services PMI Prelim (Dec)--
F: --
P: --
U.K. Manufacturing PMI Prelim (Dec)--
F: --
P: --
U.K. Composite PMI Prelim (Dec)--
F: --
P: --
Euro Zone ZEW Economic Sentiment Index (Dec)--
F: --
P: --
Germany ZEW Current Conditions Index (Dec)--
F: --
P: --
Germany ZEW Economic Sentiment Index (Dec)--
F: --
P: --
Euro Zone Trade Balance (Not SA) (Oct)--
F: --
P: --
Euro Zone ZEW Current Conditions Index (Dec)--
F: --
P: --
Euro Zone Trade Balance (SA) (Oct)--
F: --
P: --
Euro Zone Total Reserve Assets (Nov)--
F: --
P: --
U.K. Inflation Rate Expectations--
F: --
P: --

No matching data
Latest Views
Latest Views
Trending Topics
Top Columnists
Latest Update
White Label
Data API
Web Plug-ins
Affiliate Program
View All
No data
U.S. President Donald Trump said on Friday the Federal Reserve board should assume control if Fed Chair Jerome Powell continues to refuse to lower interest rates.
U.S. President Donald Trump said on Friday the Federal Reserve board should assume control if Fed Chair Jerome Powell continues to refuse to lower interest rates.
"Jerome 'Too Late' Powell, a stubborn MORON, must substantially lower interest rates, now. if he continues to refuse, the board should assume control, and do what everyone knows has to be done!" Trump said in a post on Truth Social.
The U.S. central bank held interest rates steady on Wednesday and Federal Reserve Chair Jerome Powell's comments after the decision undercut confidence that borrowing costs would begin to fall in September, stoking the ire of Trump, who has demanded immediate and steep rate relief.
The latest policy decision was made by a 9-2 vote, which passes for a split outcome at the consensus-driven central bank, with two Fed governors dissenting for the first time in more than 30 years.
The seven members of the Fed Board of Governors are nominated by the president and confirmed by the U.S. Senate.
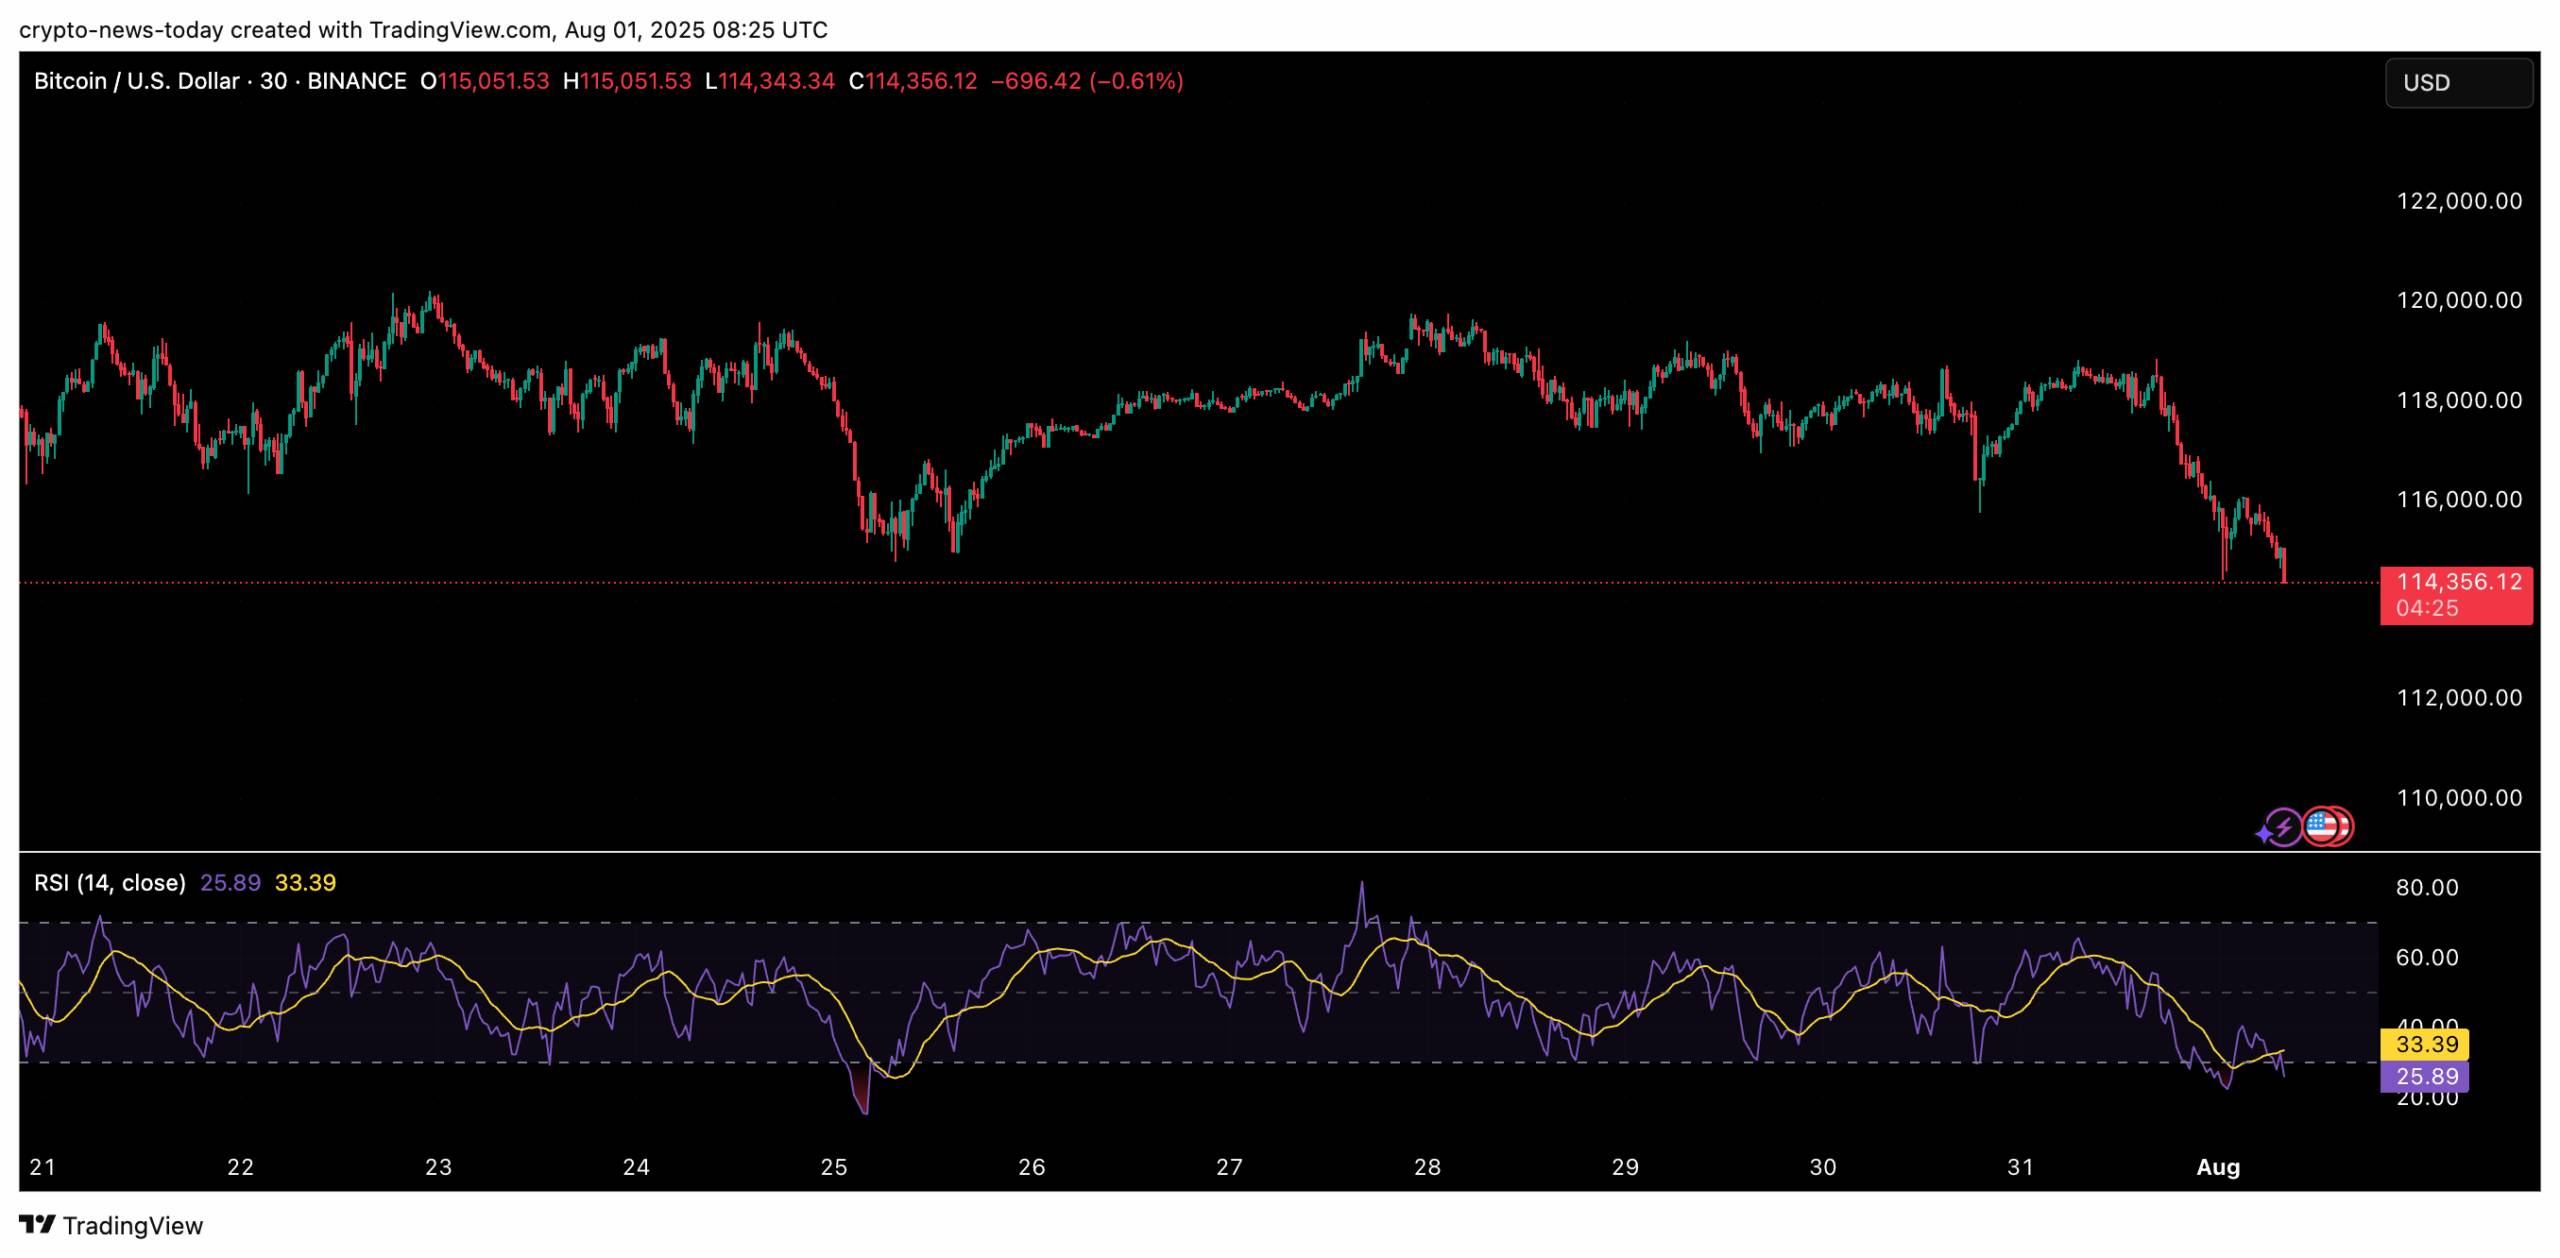
Bitcoin led the retreat, sinking to $114,322 as leveraged traders were forced out of positions. The move erased a key support level and sparked over $150 million in liquidations, creating a cascade that amplified losses across the sector.
The market downturn was accelerated by extreme leverage. Open interest in Bitcoin futures had swelled before the selloff, leaving traders exposed once the price cracked below $115K. The flush out of long positions not only closed a CME futures gap from July but also left BTC vulnerable to further losses if it fails to regain momentum above $116K.
The broader market fared no better. Pudgy Penguins (PENGU) stumbled after insiders moved millions in tokens to exchanges, unnerving holders. Injective (INJ) reversed following excitement over its ETF filing, while Sui (SUI) tumbled below support after liquidation spikes. In total, many major tokens posted losses of 10% or more as speculative leverage was wiped out.
Crypto Tied Closer to Wall Street Moves
The selloff underscored how closely crypto remains linked to traditional assets. With the Nasdaq falling nearly 1% on the same day, Bitcoin’s correlation with the S&P 500 surged to its highest in two months. For now, traders appear to be treating digital assets as risk-sensitive investments rather than safe havens against inflation.
Attention now shifts to Friday’s U.S. jobs data, which could determine whether the Federal Reserve leans toward easing in 2025. A soft labor market report might lift investor sentiment, but if Bitcoin fails to stabilize above current levels, analysts warn the correction could deepen toward $104K.
In announcing President Donald Trump’s revised barrage of global tariffs last night, US Trade Representative Jamieson Greer had a dig at the rules-based international trading system that Washington has let atrophy for much of the past decade.
“The President’s tariff program and the ensuing ‘Trump Round’ of trade negotiations have accomplished what the World Trade Organization and multilateral negotiations have not been able to achieve at scale,” Greer said in a statement late Thursday.
(The WTO didn’t immediately return an email request for comment sent to its headquarters in Switzerland, where people are celebrating a national holiday Friday and reading about how Trump just hit their exports to the US with a startlingly high 39% tariff — more than double the 15% imposed on many other developed nations that have trade surpluses with the US.)
Those wins, he continued, include “expansive new market access for US exporters, increased tariffs to defend critical American industries, and trillions of new manufacturing investments and purchases of goods that will create great American jobs and help reassert American leadership in key strategic sectors.”
Of course, all of that is just the hoped-for outcome for a White House that has about a year to produce the factory renaissance they’ve envisioned, before US voters start thinking about their financial well-being ahead of the 2026 mid-term elections.
According to Bloomberg Economics, the tariffs ranging from 10% to 41% would increase the average US duty to 15.2% from 2.3% in 2024, according to analysis by Maeva Cousin, chief trade economist at BE.
“For the rest of the world, this is a serious demand shock,” Raghuram Rajan, former India central bank governor and chief economist of the International Monetary Fund, who is now a professor at the University of Chicago Booth School of Business, told Bloomberg TV on Friday.
The immediate burden of Trump’s rewiring falls on the administrative engine of the global trading system. US companies, their customs brokers and the broader logistics industry is struggling with the more complex and oft-changing reporting requirements to Customs and Border Protection, the US agency that collects the filings and the tariffs from importers of record.
In July, the largest cryptocurrency, Bitcoin (BTC) , closed at $115,644, marking its first-ever six-figure monthly closure in its 16-year history. This event is significant, particularly when juxtaposed with Ethereum (ETH) , which, despite a substantial gain of 48.77% in July, began August with a slight 0.43% decrease. Analysts interpret this data as an indication of the market’s maturation, yet historical returns suggest a heightened risk of decline for both Bitcoin and Ethereum in August.
BTC Markets analyst Rachael Lucas described the $115,644 monthly closure not just as a number, but as an indicator of an increasingly deep buyer base. According to Lucas, the rapid recovery from a 4% decline following the transfer of 80,000 BTC on blockchain in July underscores a strong defense line largely driven by institutional demand within the cryptocurrency market.
Meanwhile, Nick Ruck, Director of LVRG Research, pointed out that the current 2% pullback has been influenced by factors such as the Federal Reserve’s ongoing monetary policy, potential tariffs, and a slowdown in spot crypto ETF flows. While short-term profit-taking is inevitable, Ruck emphasized that the fundamentals continue to support a long-term bullish outlook.
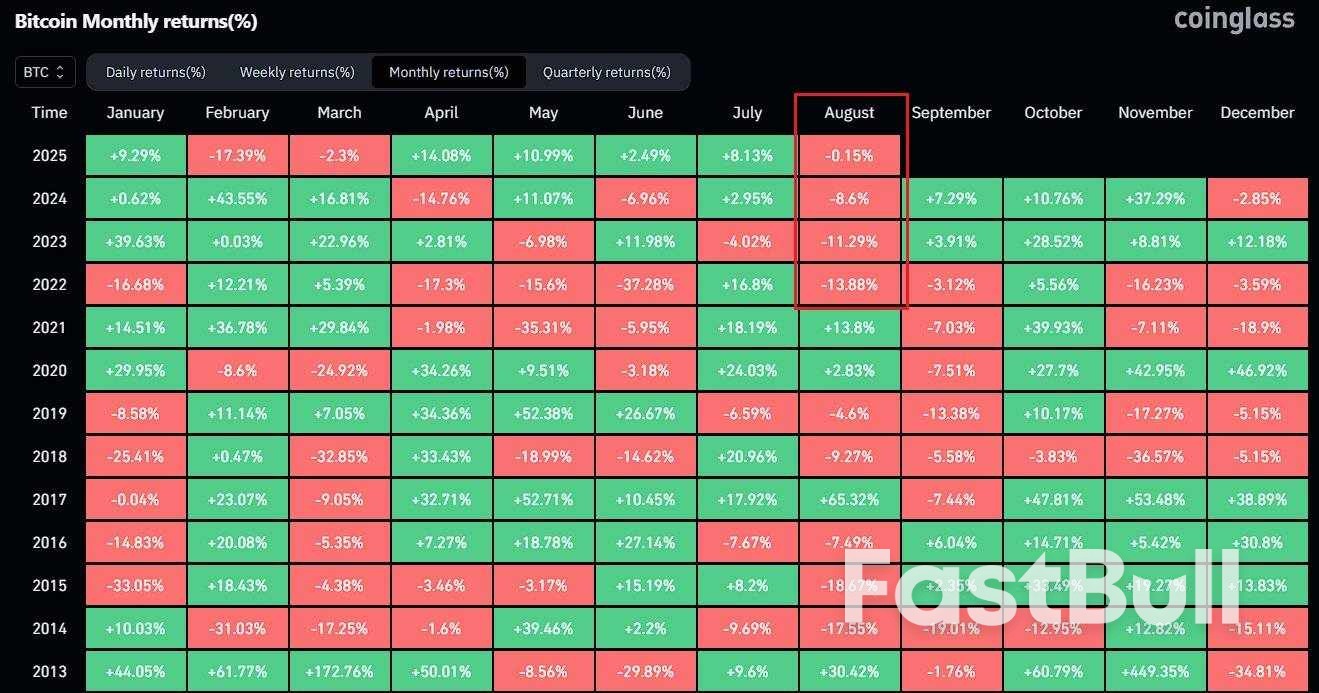
Data from Coinglass reveals a recurring pattern of Bitcoin closing negative in August for three consecutive years, with declines of 8.6% in 2024, 11.29% in 2023, and 13.88% in 2022. The exception was 2021, with a notable 13.8% increase due to the “bull year” effect, suggesting ongoing volatility in the new month.
Similarly, August’s performance for Ethereum has been notably harsher. According to CoinGlass data again, ETH fell by 22.21% in August 2024, 11.3% in August 2023, and 7.33% in August 2022. However, a massive leap of 35.62% in August 2021, analogous to Bitcoin, confirmed it was a “bull year.”
As the cryptocurrency market stabilizes, the patterns seen for both Bitcoin and Ethereum point toward a month of significant caution, particularly in August. Market experts remain divided on the trajectory, while institutional investors’ moves become increasingly influential in dictating market trends. Overall, the cryptocurrency market’s maturity leads to further insights and strategies among traders, albeit with cautious optimism.
The significance of historical patterns cannot be overstated, especially as both digital currencies become ingrained elements of today’s economic landscape. For investors and enthusiasts alike, observing these historical patterns and market behaviors will be crucial in navigating the complex realm of cryptocurrencies.
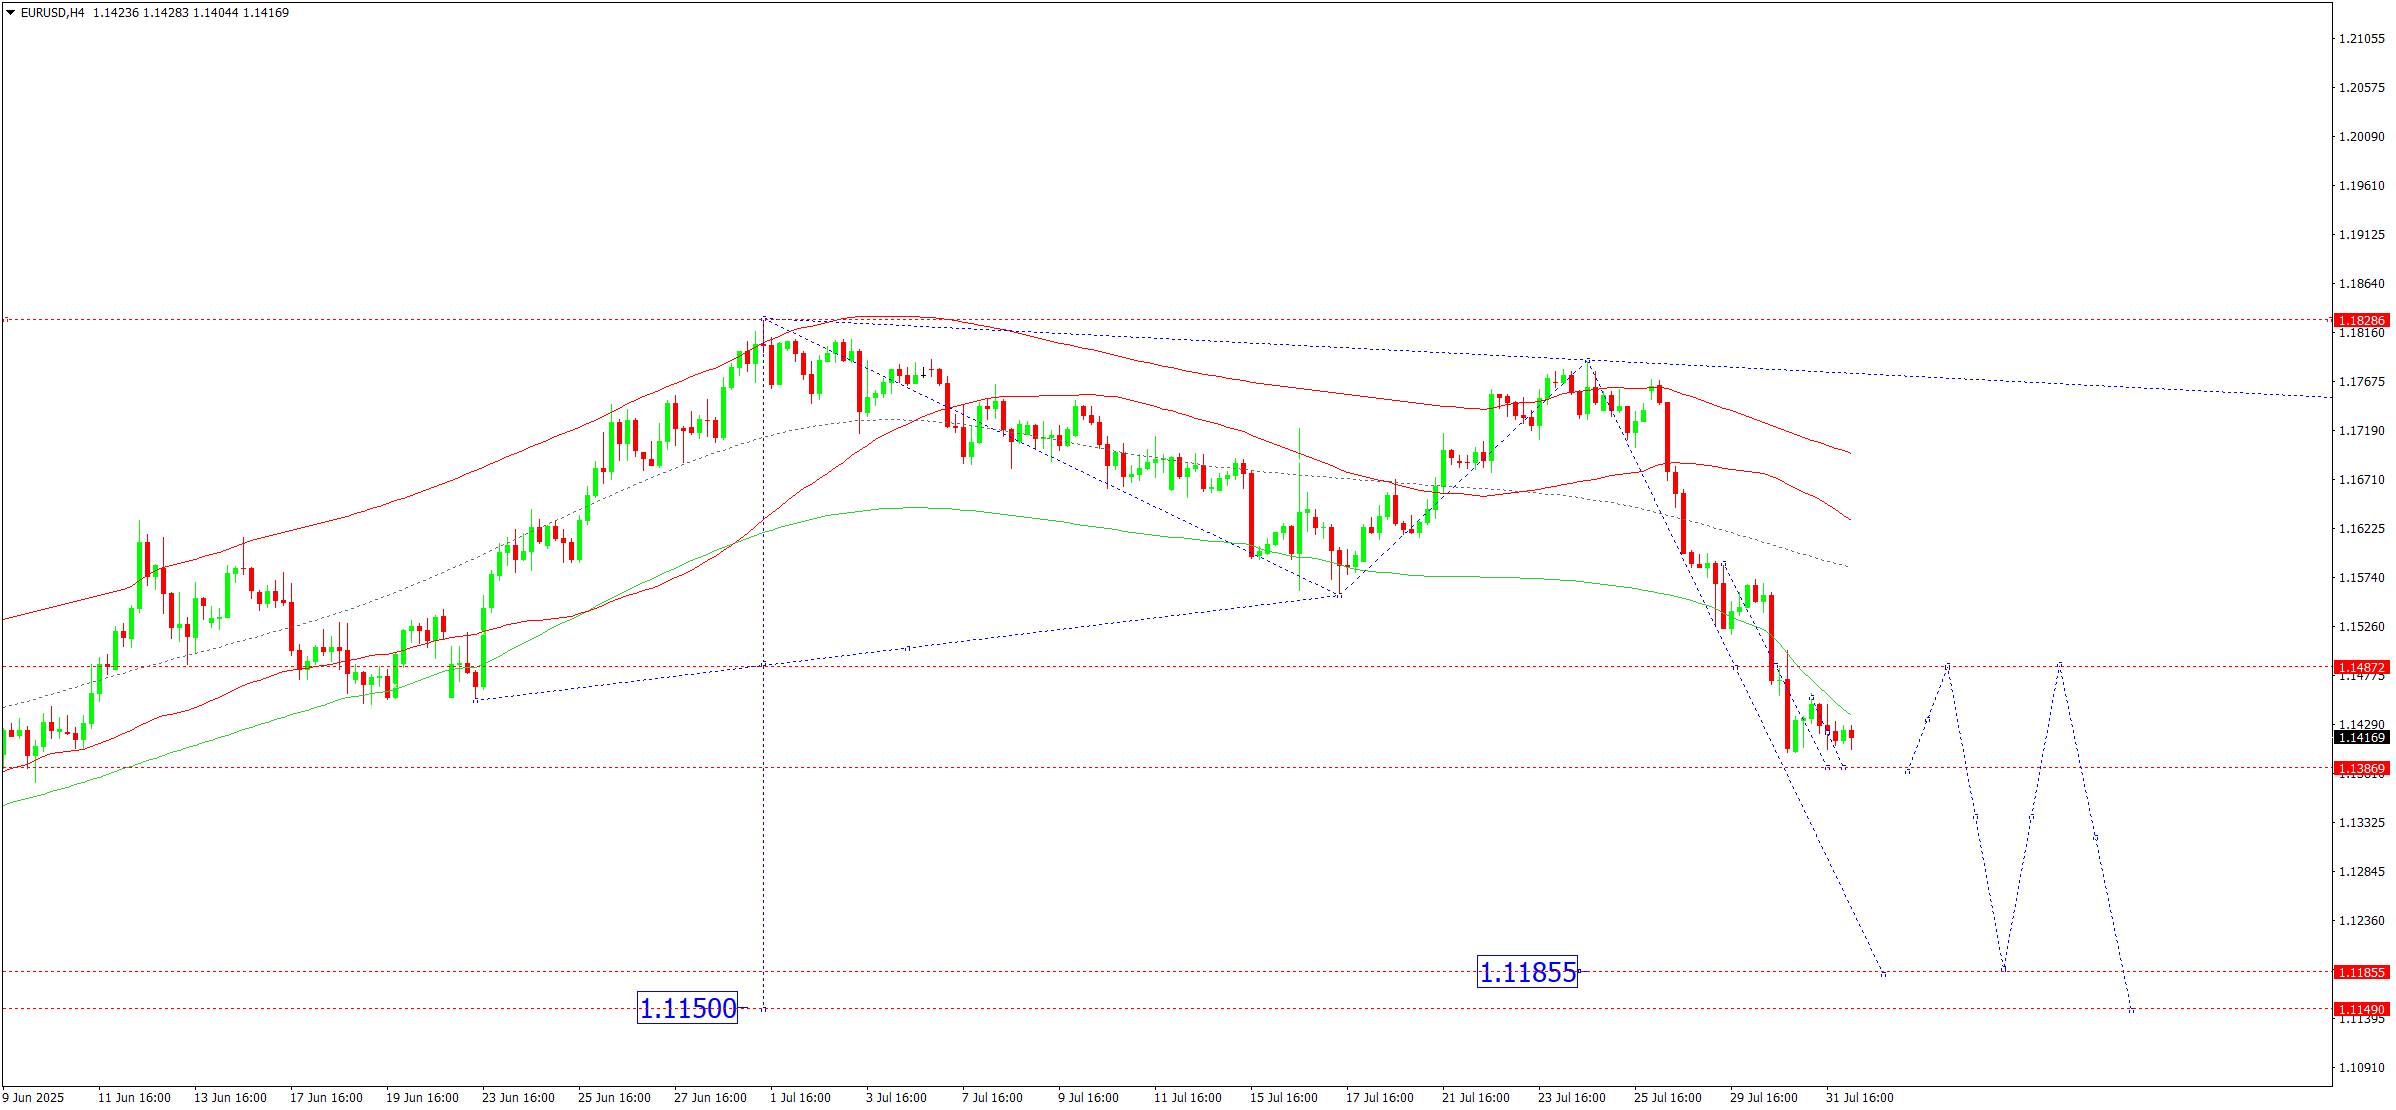
On the H4 chart of EURUSD, the market continues to develop a compact consolidation range around 1.1420. Today, 1 August 2025, this range is expected to expand down to 1.1387 and up to 1.1421. A correction to 1.1487 is also possible. Afterwards, a downward wave to 1.1185 is likely. This is a local target.Technically, the Elliott wave structure and the matrix of the downward wave with a pivot point at 1.1487 confirm this scenario. This level is seen as key in the EURUSD wave structure. The market is currently forming a downward wave to the lower boundary of the price Envelope at 1.1185. Once this level is reached, a rebound to the central line at 1.1487 is possible.
Technical indicators for today’s EURUSD forecast suggest a downward wave towards 1.1185.
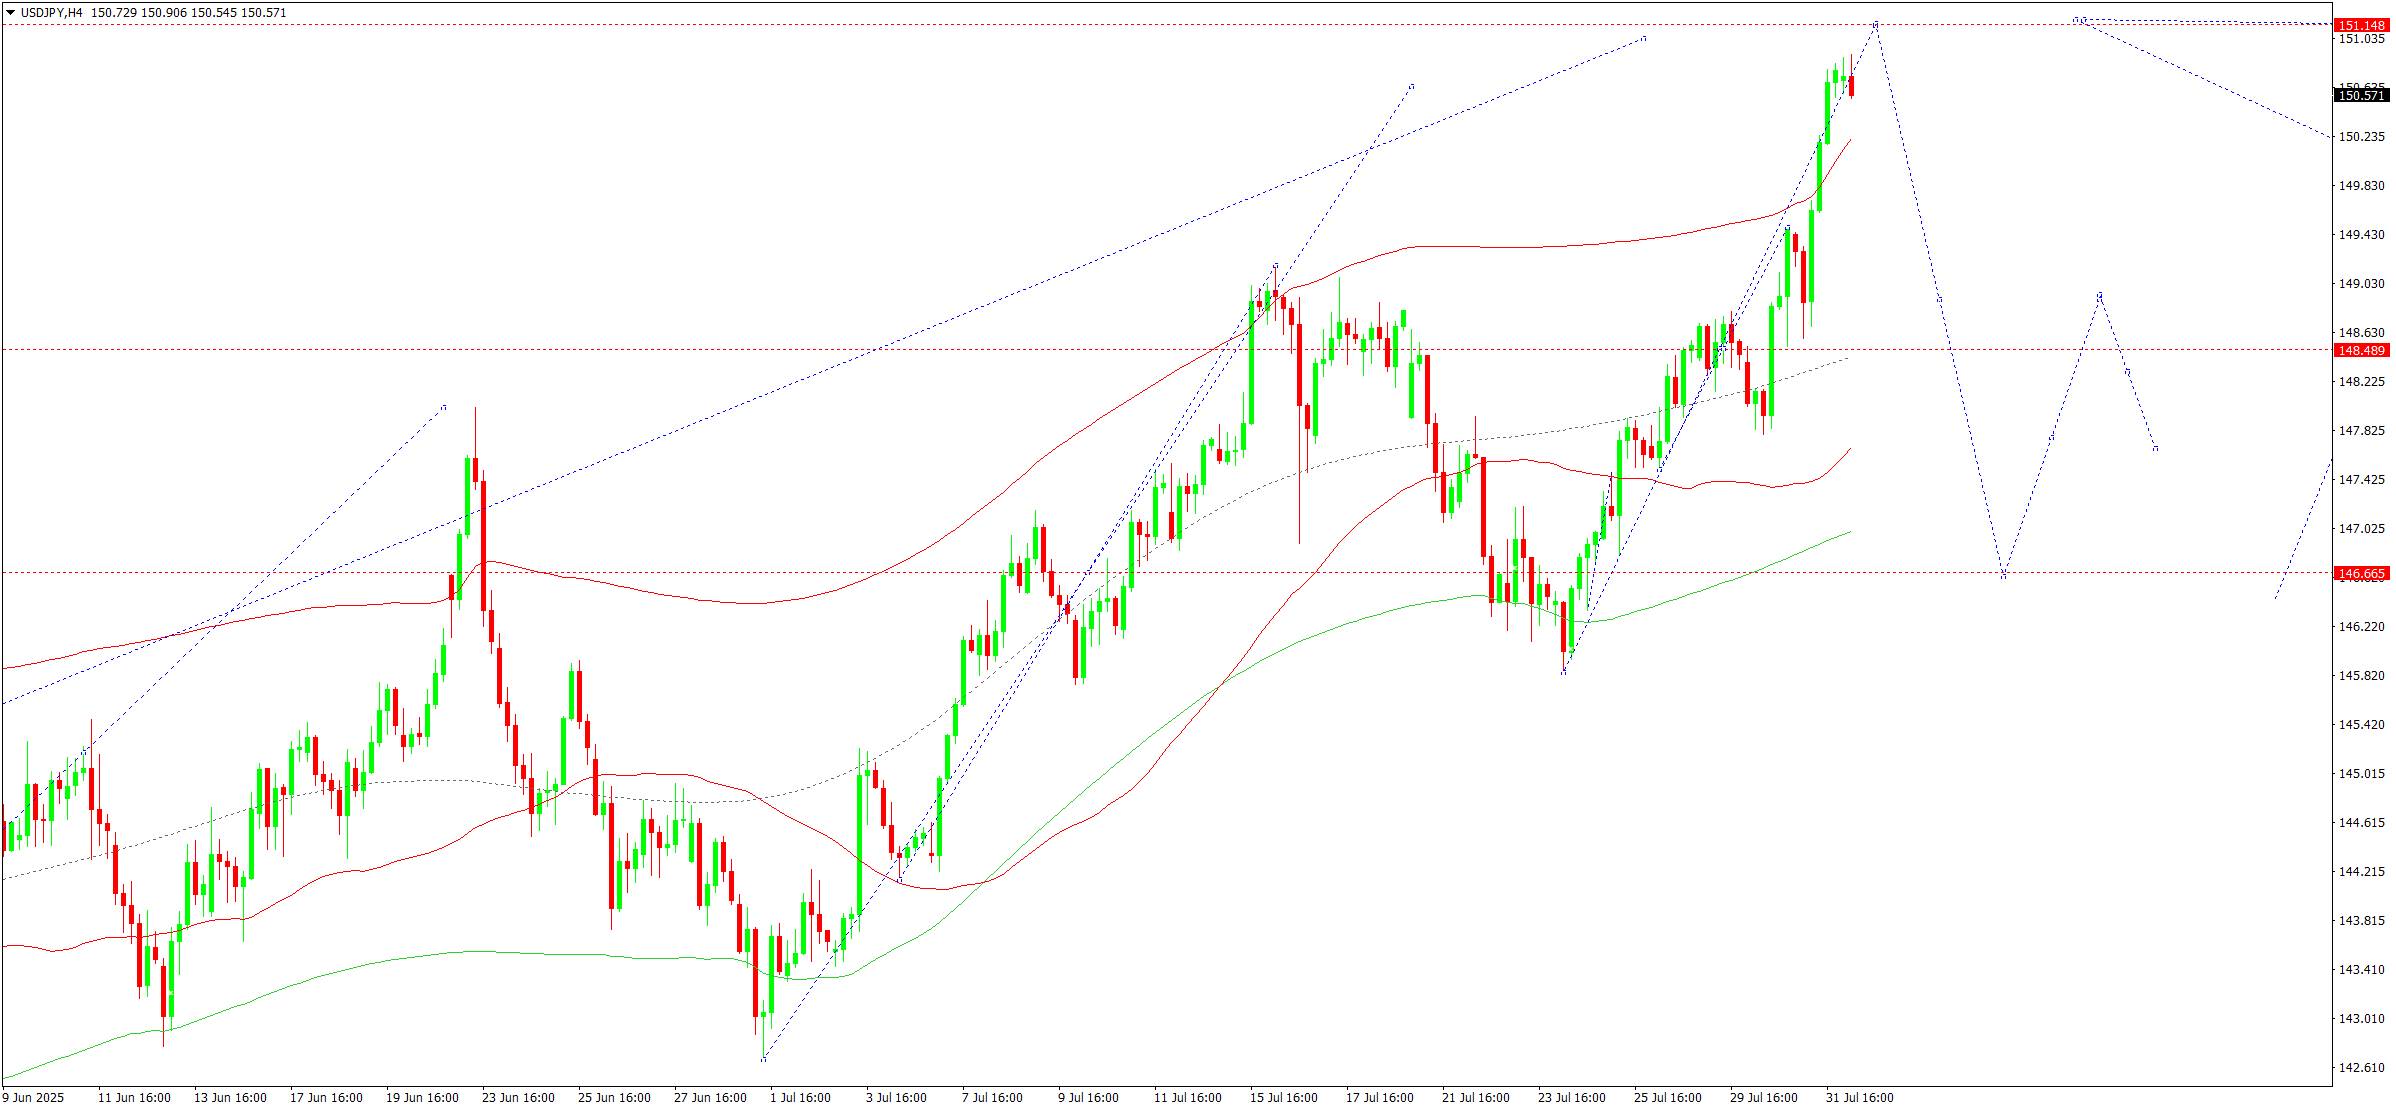
On the H4 chart of USDJPY, the market formed a consolidation range around 148.62 and broke out upwards. Today, 1 August 2025, a growth leg towards 151.45 is possible. Later, the price is expected to correct back to 148.62 (testing from above), followed by a rise to 153.40.Technically, the Elliott wave structure and the matrix of the growth wave with a rotation centre at 148.62 confirm this scenario. This level is considered key in this wave. The market completed a growth wave to the upper boundary of the Price Envelope at 151.45. A decline to the central line at 148.62 is not excluded, followed by a move up to the upper boundary at 153.40.
Technical indicators for today’s USDJPY forecast suggest a rise to 151.45.
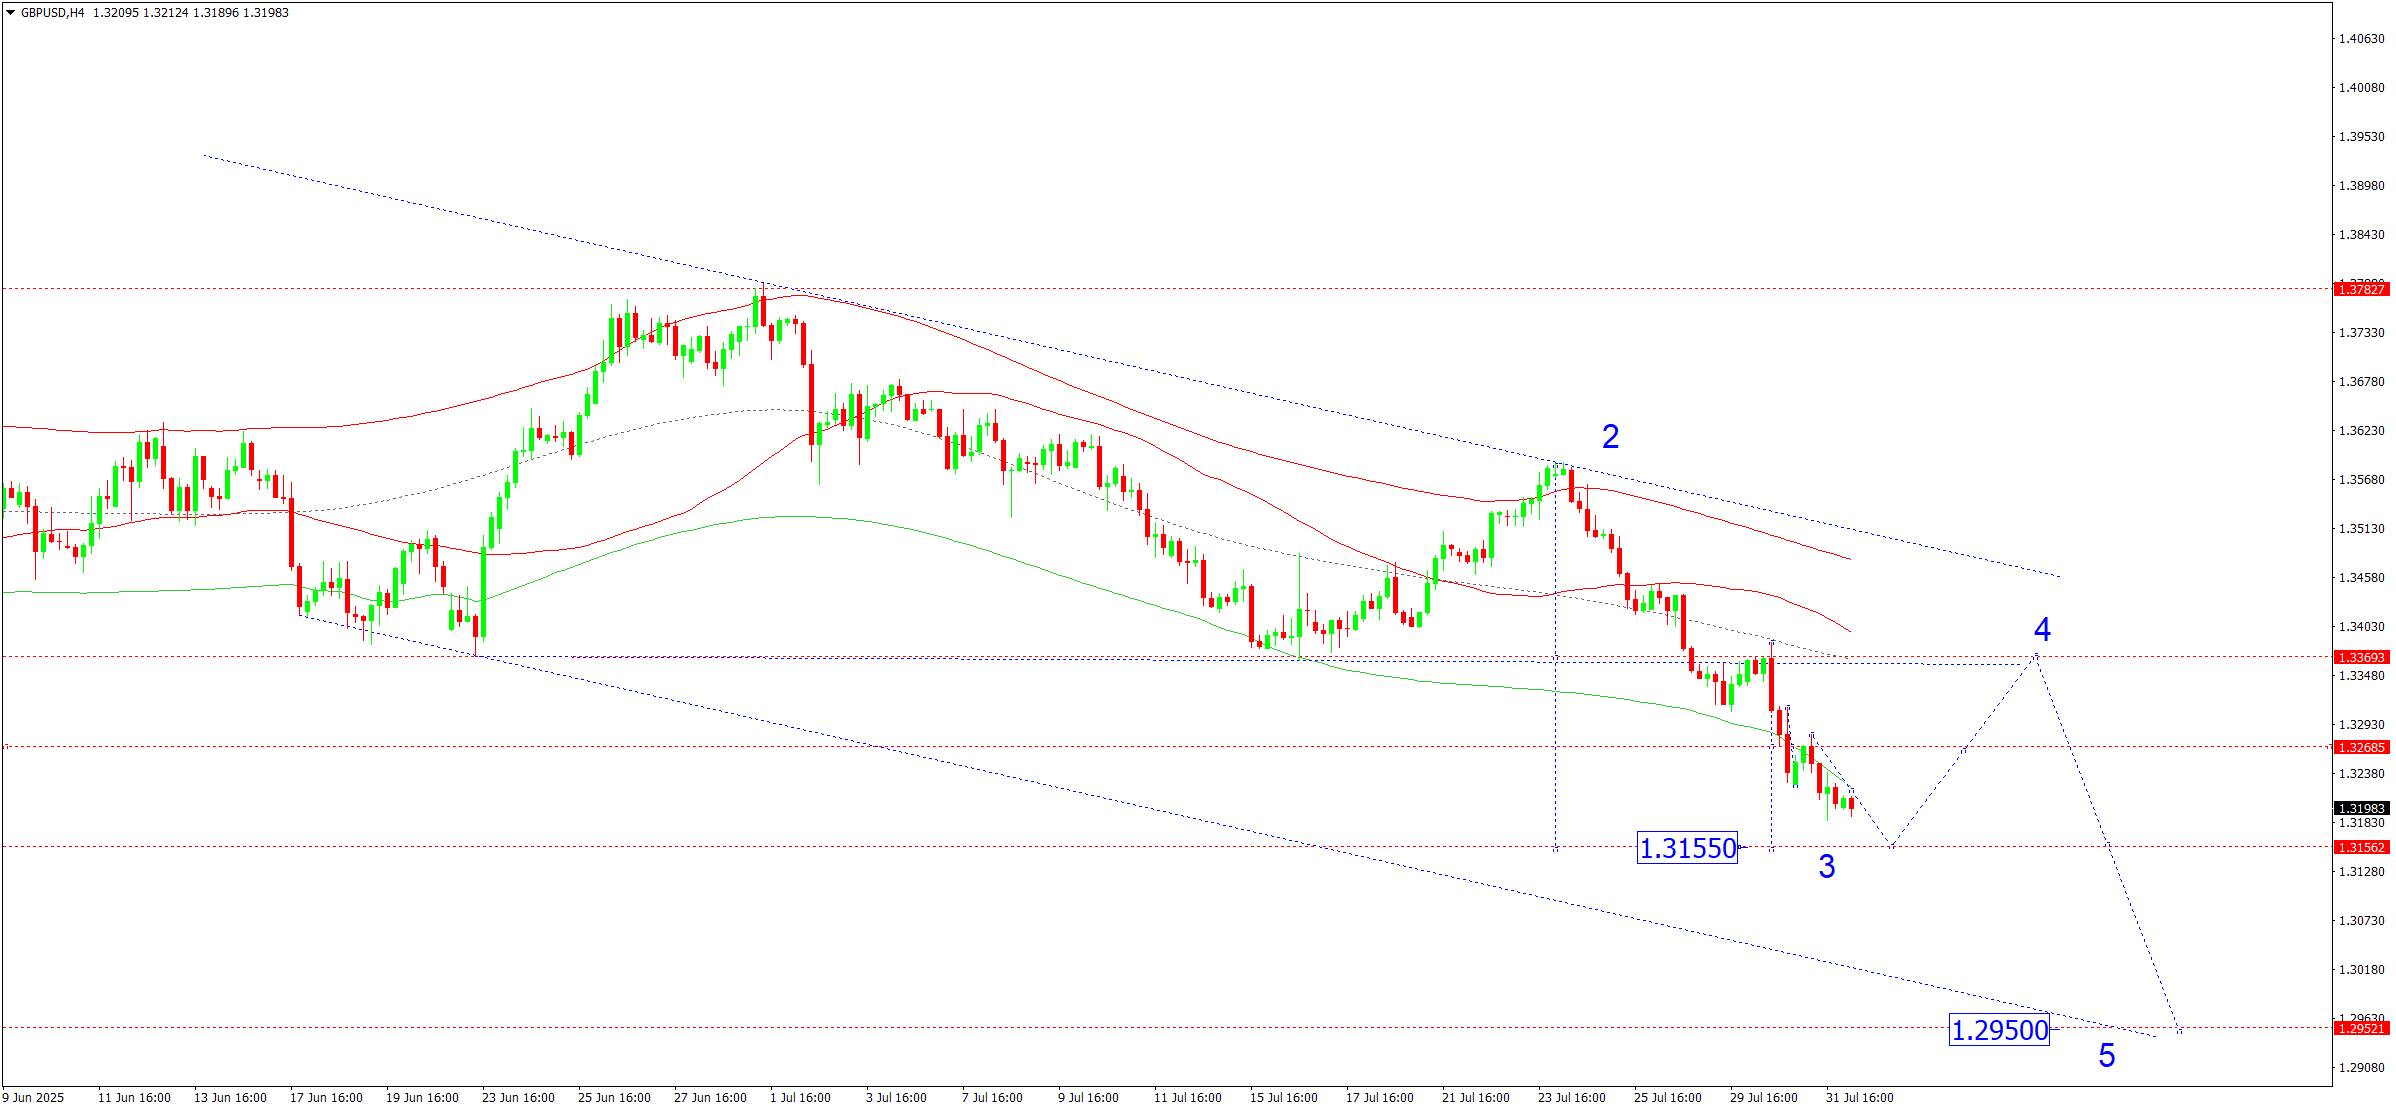
On the H4 chart of GBPUSD, the market continues a downward wave towards 1.3155 as a local target. Today, 1 August 2025, this target level may be reached. Afterwards, a correction to 1.3370 (testing from below) is likely, followed by a decline to 1.2950.Technically, the Elliott wave structure and the matrix of the downward wave with a pivot point at 1.3370 confirm this scenario. This level remains key in the wave structure. The market is currently forming a downward wave to the lower boundary of the price Envelope at 1.3155. Later, a correction to the central line at 1.3370 is possible.
Technical indicators for today’s GBPUSD forecast suggest a decline towards 1.3152.
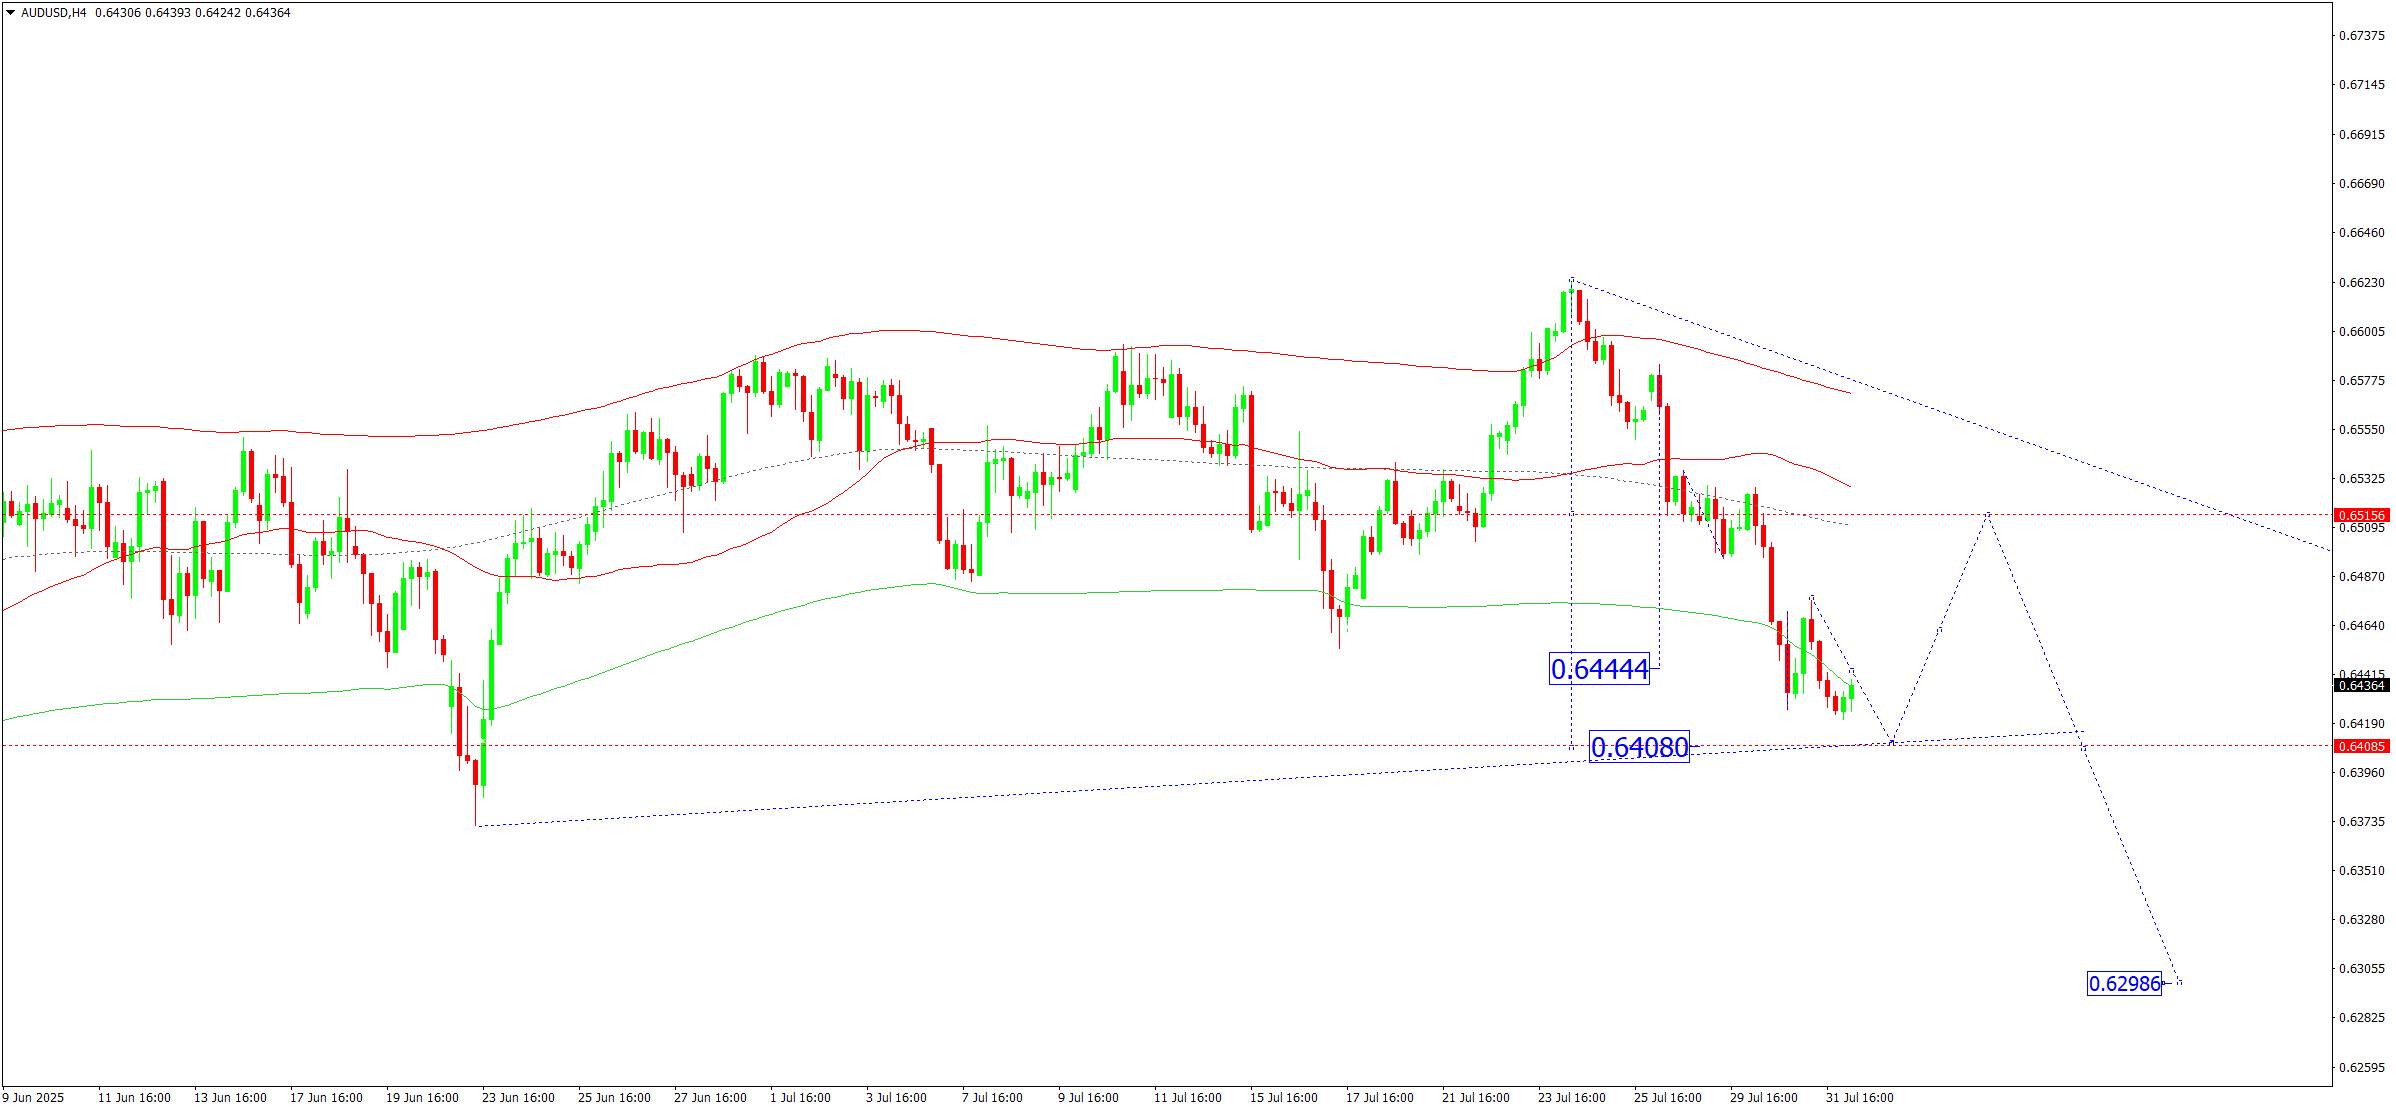
On the H4 chart of AUDUSD, the market continues to develop a consolidation range around 0.6444. Today, 1 August 2025, an upward breakout would open the way for a correction to 0.6555. If it breaks downwards, the downward wave may continue to 0.6408 as the first target.Technically, the Elliott wave structure and the matrix of the AUDUSD downward wave with a pivot point at 0.6515 confirm this scenario. This level is viewed as key in this wave structure. The market is currently forming a downward wave to the lower boundary of the price Envelope at 0.6408. Afterwards, a rise to the central line at 0.6515 is possible, followed by a continued decline to the lower boundary at 0.6400.
Technical indicators for today’s AUDUSD forecast suggest a decline to 0.6408.
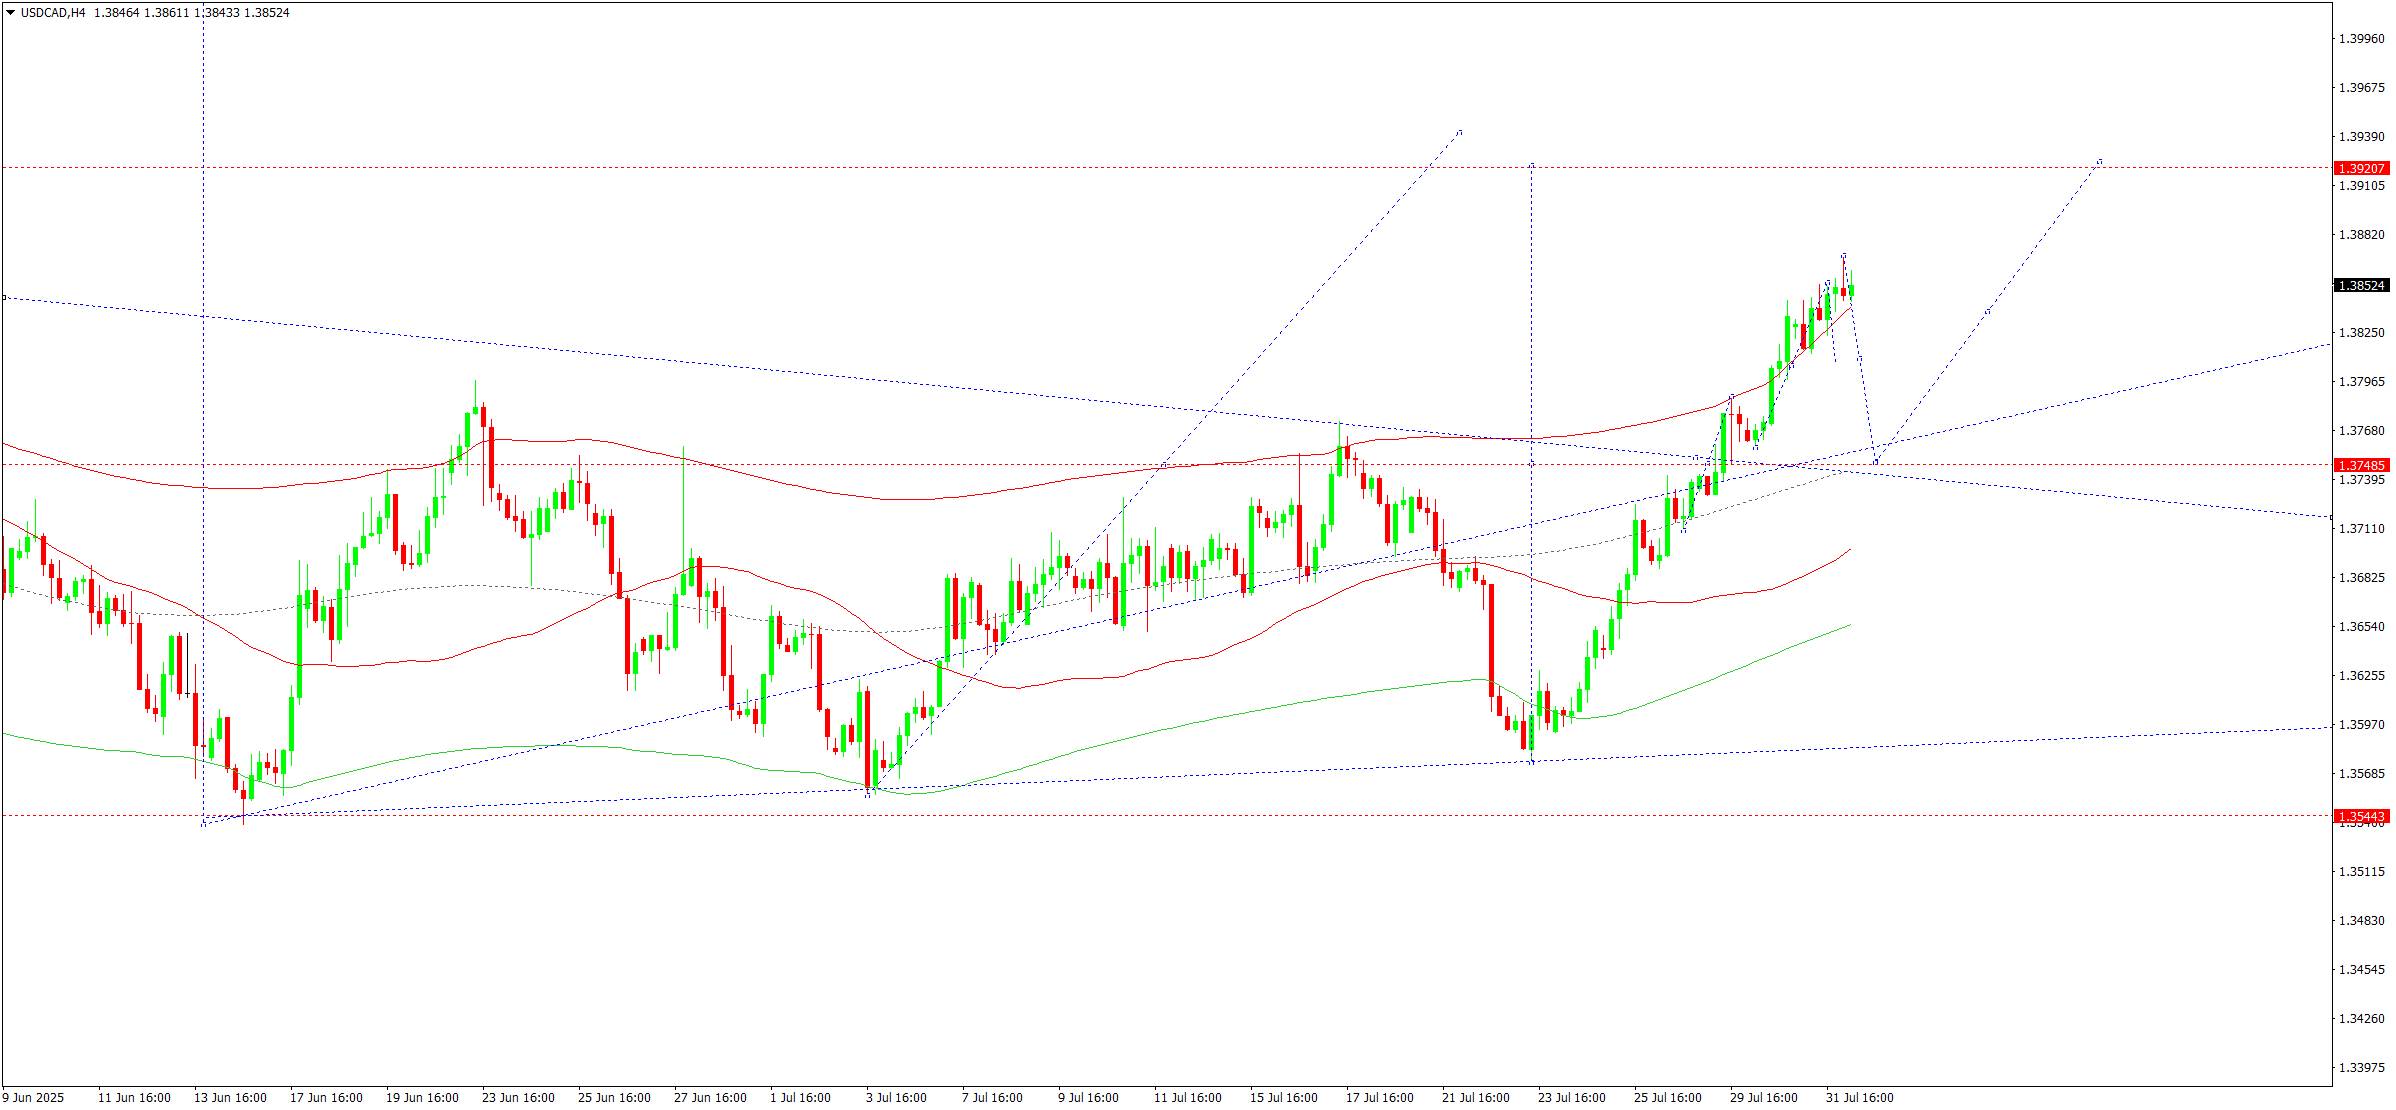
On the H4 chart of USDCAD, the market formed a consolidation range around 1.3747 and broke out upwards. Today, 1 August 2025, a continued upward wave towards 1.3920 is expected. Later, a pullback to 1.3750 (testing from above) is possible.Technically, the Elliott wave structure and the matrix of the growth wave with a pivot point at 1.3750 confirm this scenario. This level is considered key in the wave structure of USDCAD. The market formed a consolidation range around the central line of the price Envelope at 1.3750 and broke upwards. Today, the scenario of growth towards the upper boundary at 1.3920 remains relevant.
Technical indicators for today’s USDCAD forecast suggest a move up to 1.3920.
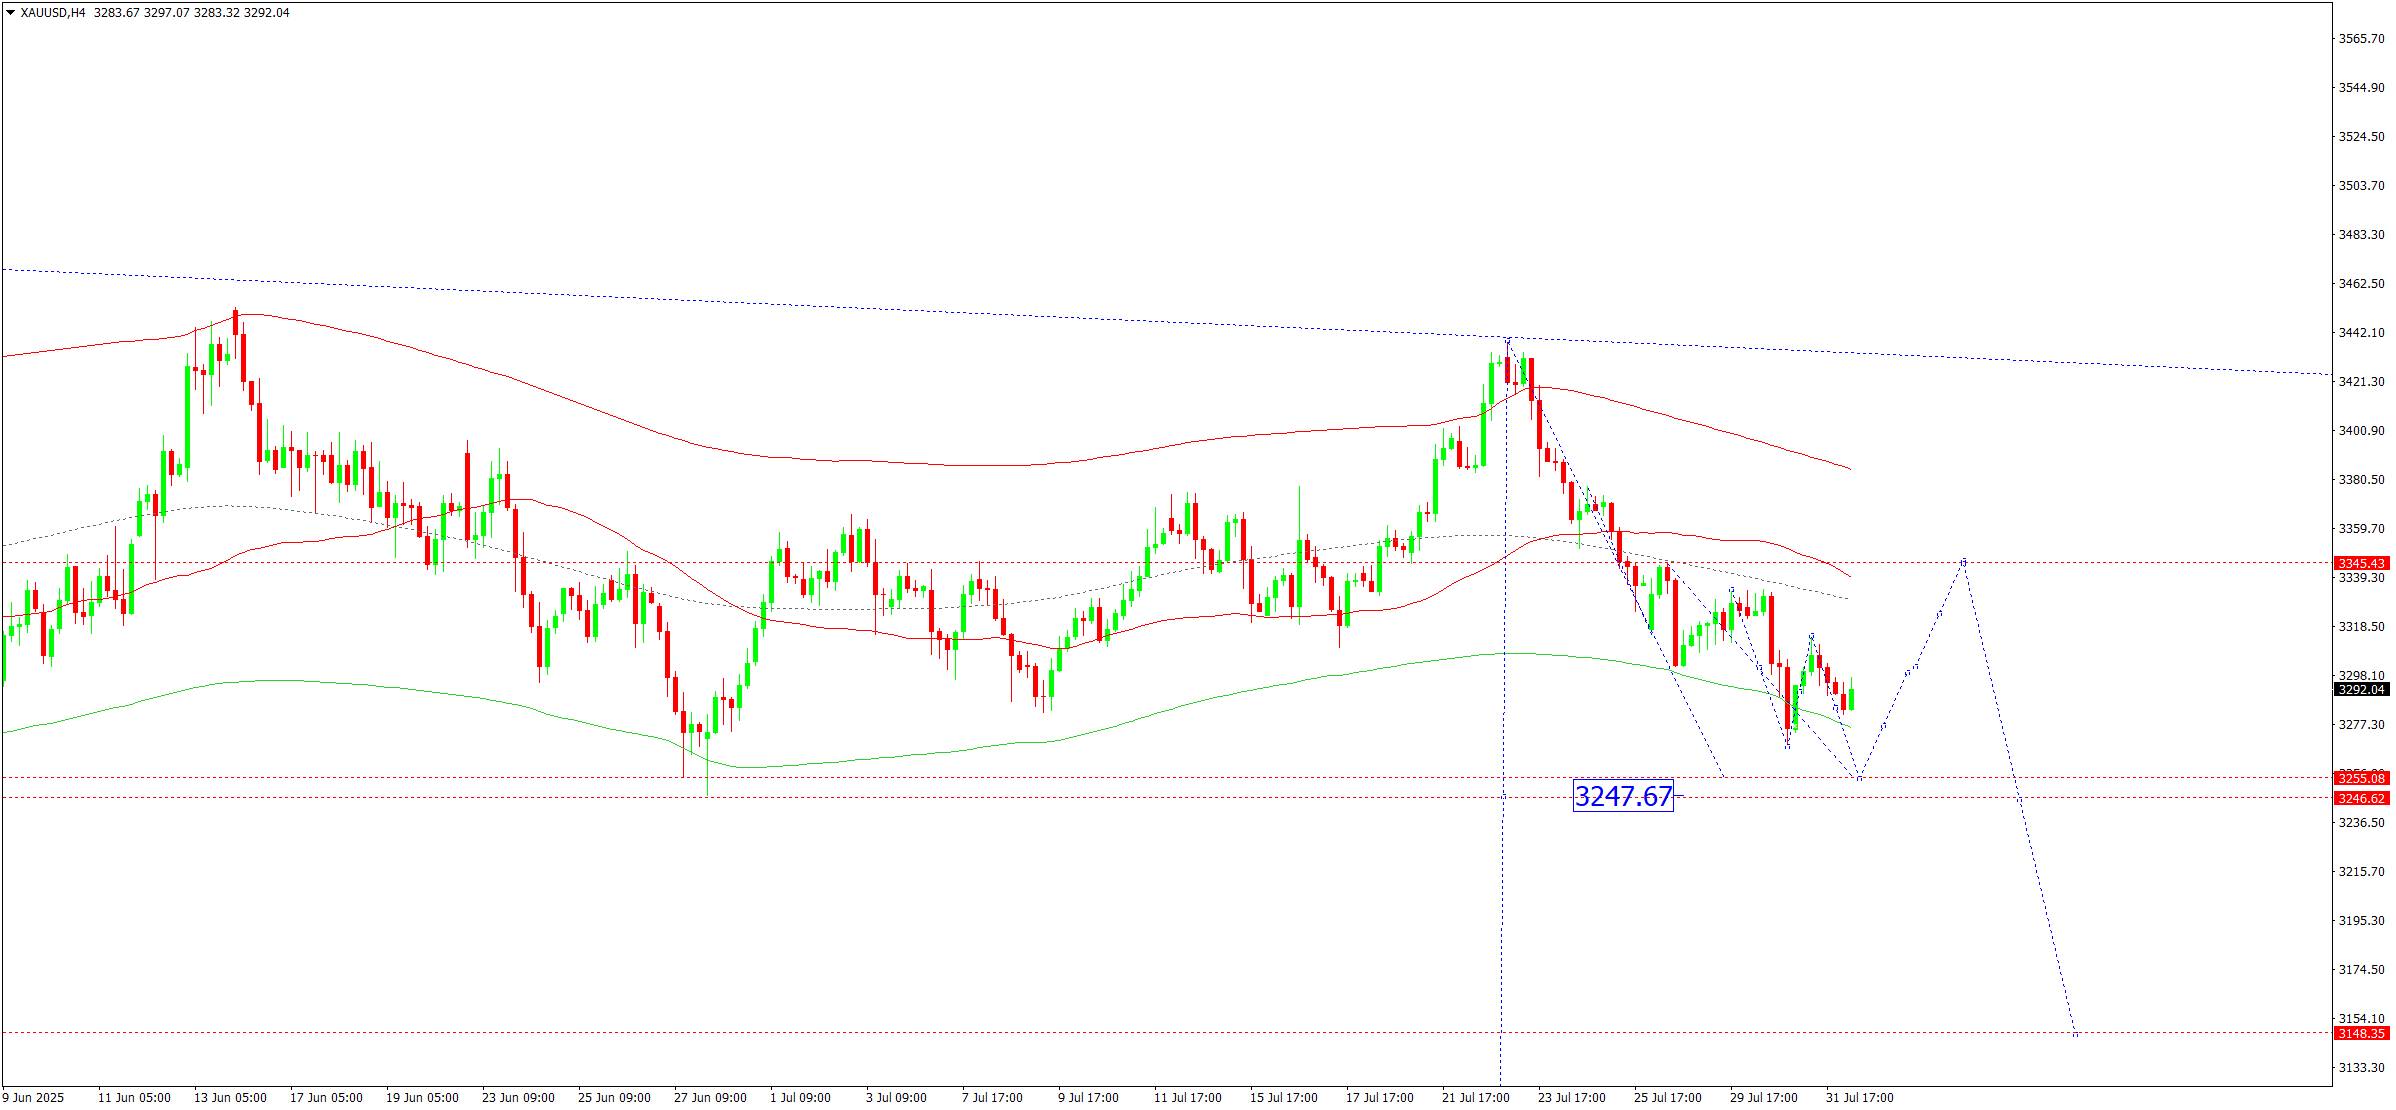
On the H4 chart of XAUUSD, the market is forming a consolidation range around 3,300. The range currently extends down to 3,268 and up to 3,314. Today, 1 August 2025, a decline to 3,247 is possible. This is a local target.Technically, the Elliott wave structure and the matrix of the downward wave with a pivot point at 3,345 confirm this scenario. This level is viewed as key in the wave structure of XAUUSD. The market is executing a downward wave to the lower boundary of the price Envelope at 3,247. Afterwards, a rise to the central line at 3,345 is possible, followed by a decline to the lower boundary at 3,150.
Technical indicators for today’s XAUUSD forecast point to a downward wave towards 3,247.
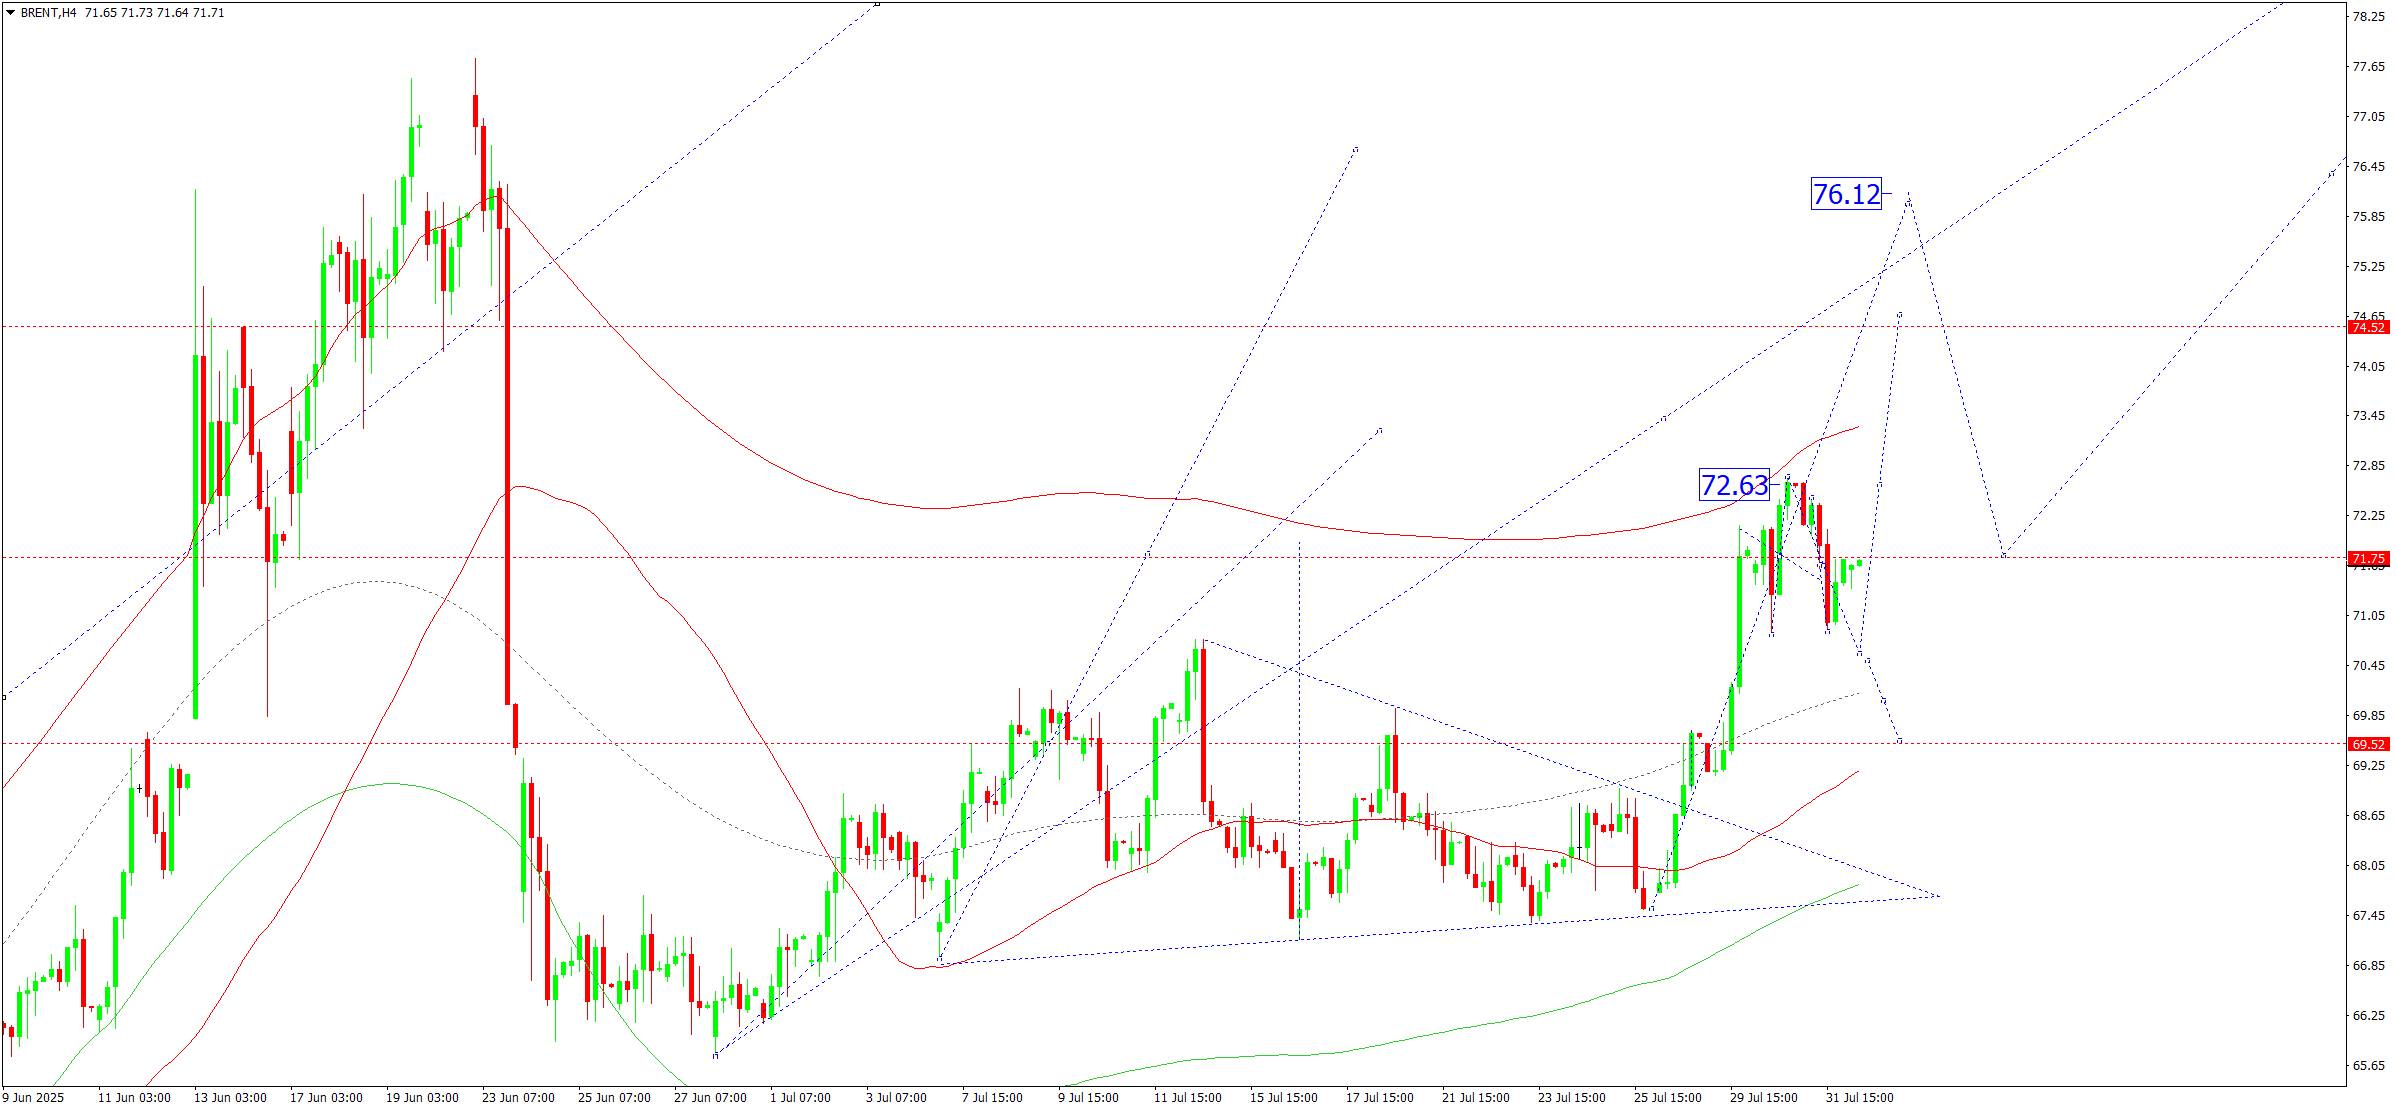
On the H4 chart of Brent crude, the market is forming a consolidation range around 71.75. Today, 1 August 2025, a downward breakout may lead to a correction to 70.00. If the price breaks upwards, the wave may continue to 73.33 with the potential to extend the trend to 76.00 as a local target.Technically, the Elliott wave structure and the matrix of the growth wave with a pivot point at 71.80 confirm this scenario. This level remains key in the current wave of Brent. The market is forming a consolidation range around the central line of the price Envelope at 71.80. A short-term decline to 70.00 is not excluded, followed by a rise to the upper boundary at 73.33. Later, a pullback to the central line at 70.80 is possible.
Technical indicators for today’s Brent forecast suggest the continuation of the growth wave towards 73.33 and 76.00.
728 RM B 7/F GEE LOK IND BLDG NO 34 HUNG TO RD KWUN TONG KLN HONG KONG


White Label
Data API
Web Plug-ins
Poster Maker
Affiliate Program
The risk of loss in trading financial instruments such as stocks, FX, commodities, futures, bonds, ETFs and crypto can be substantial. You may sustain a total loss of the funds that you deposit with your broker. Therefore, you should carefully consider whether such trading is suitable for you in light of your circumstances and financial resources.
No decision to invest should be made without thoroughly conducting due diligence by yourself or consulting with your financial advisors. Our web content might not suit you since we don't know your financial conditions and investment needs. Our financial information might have latency or contain inaccuracy, so you should be fully responsible for any of your trading and investment decisions. The company will not be responsible for your capital loss.
Without getting permission from the website, you are not allowed to copy the website's graphics, texts, or trademarks. Intellectual property rights in the content or data incorporated into this website belong to its providers and exchange merchants.
Not Logged In
Log in to access more features

FastBull Membership
Not yet
Purchase


Log In
Sign Up


