• Trade
  • Markets
  • Copy
  • Contests
  • News
  • 24/7
  • Calendar
  • Q&A
  • Chats
Trending
Screeners
SYMBOL
LAST
BID
ASK
HIGH
LOW
NET CHG.
%CHG.
SPREAD
SPX
S&P 500 Index
6819.45
6819.45
6819.45
6861.30
6801.50
-7.96
-0.12%
--
DJI
Dow Jones Industrial Average
48383.18
48383.18
48383.18
48679.14
48285.67
-74.86
-0.15%
--
IXIC
NASDAQ Composite Index
23112.23
23112.23
23112.23
23345.56
23012.00
-82.93
-0.36%
--
USDX
US Dollar Index
97.960
98.040
97.960
98.070
97.740
+0.010
+ 0.01%
--
EURUSD
Euro / US Dollar
1.17442
1.17451
1.17442
1.17686
1.17262
+0.00048
+ 0.04%
--
GBPUSD
Pound Sterling / US Dollar
1.33693
1.33703
1.33693
1.34014
1.33546
-0.00014
-0.01%
--
XAUUSD
Gold / US Dollar
4302.73
4303.14
4302.73
4350.16
4285.08
+3.34
+ 0.08%
--
WTI
Light Sweet Crude Oil
56.371
56.401
56.371
57.601
56.233
-0.862
-1.51%
--

Community Accounts

Signal Accounts
--
Profit Accounts
--
Loss Accounts
--
View More

Become a signal provider

Sell trading signals to earn additional income

View More

Guide to Copy Trading

Get started with ease and confidence

View More

Signal Accounts for Members

All Signal Accounts

Best Return
  • Best Return
  • Best P/L
  • Best MDD
Past 1W
  • Past 1W
  • Past 1M
  • Past 1Y

All Contests

  • All
  • Trump Updates
  • Recommend
  • Stocks
  • Cryptocurrencies
  • Central Banks
  • Featured News
Top News Only
Share

Turkey: Shoots Down A Drone In The Black Sea Using F-16 Fighter Jets

Share

Goldman Sachs Says They Believe That The Copper Price Is Vulnerable To An Ai-Linked Price Correction

Share

Goldman Sachs Upgrades 2026 Copper Price Forecast To $11400 From $10,650

Share

Attempts By Ukrainian Troops To Advance From The South-West To Outskirts Of Kupiansk Are Being Thwarted

Share

Russian Troops Control All Of Kupiansk - IFX Cites Russian Military

Share

On Monday (December 15), The South Korean Won Ultimately Rose 0.60% Against The US Dollar, Closing At 1468.91 Won. The Won Was On An Upward Trend Throughout The Day, Rising Significantly At 17:00 Beijing Time And Reaching A Daily High Of 1463.04 Won At 17:36

Share

Health Ministry: Israeli Forces Kill Palestinian Teen In West Bank

Share

New York Federal Reserve President Williams: Over Time, The Size Of Reserves Could Grow From $2.9 Trillion

Share

New York Fed President Williams: AI Valuations Are High, But There Is A Real Driving Factor

Share

New York Federal Reserve President Williams: The Job Market Is In Very Good Shape

Share

New York Fed President Williams: 'Very Supportive' Of USA Central Bank's Decision To Cut Interest Rates Last Week

Share

New York Fed President Williams: 'Too Early To Say' What Central Bank Should Do At January Meeting

Share

New York Fed President Williams: Strong Markets Part Of Reason Why Economy Will Grow Robustly In 2026

Share

New York Fed President Williams: What Constitutes Ample Reserves Will Change Over Time

Share

New York Fed President Williams: Market Valuations 'Elevated,' But There Are Reasons For Pricing

Share

New York Fed President Williams: Ample Reserves System Working Very Well

Share

New York Fed President Williams: Some Signs That Parts Of Underlying Economy Not As Strong As GDP Data Suggests

Share

New York Fed President Williams: Expects Coming Job Data Will Show Gradual Cooling

Share

Ukraine President Zelenskiy: Monitoring Of Ceasefire Should Be Part Of Security Guarantees

Share

Ukraine President Zelenskiy: Ukraine Needs Clear Understanding On Security Guarantees Before Taking Any Decisions Regarding Frontlines

TIME
ACT
FCST
PREV
Japan Tankan Small Manufacturing Outlook Index (Q4)

A:--

F: --

P: --

Japan Tankan Large Non-Manufacturing Outlook Index (Q4)

A:--

F: --

P: --

Japan Tankan Large Manufacturing Outlook Index (Q4)

A:--

F: --

P: --

Japan Tankan Small Manufacturing Diffusion Index (Q4)

A:--

F: --

P: --

Japan Tankan Large-Enterprise Capital Expenditure YoY (Q4)

A:--

F: --

P: --

U.K. Rightmove House Price Index YoY (Dec)

A:--

F: --

P: --

China, Mainland Industrial Output YoY (YTD) (Nov)

A:--

F: --

P: --

China, Mainland Urban Area Unemployment Rate (Nov)

A:--

F: --

P: --

Saudi Arabia CPI YoY (Nov)

A:--

F: --

P: --

Euro Zone Industrial Output YoY (Oct)

A:--

F: --

P: --

Euro Zone Industrial Output MoM (Oct)

A:--

F: --

P: --

Canada Existing Home Sales MoM (Nov)

A:--

F: --

P: --

Canada National Economic Confidence Index

A:--

F: --

P: --

Canada New Housing Starts (Nov)

A:--

F: --

P: --
U.S. NY Fed Manufacturing Employment Index (Dec)

A:--

F: --

P: --

U.S. NY Fed Manufacturing Index (Dec)

A:--

F: --

P: --

Canada Core CPI YoY (Nov)

A:--

F: --

P: --

Canada Manufacturing Unfilled Orders MoM (Oct)

A:--

F: --

P: --

U.S. NY Fed Manufacturing Prices Received Index (Dec)

A:--

F: --

P: --

U.S. NY Fed Manufacturing New Orders Index (Dec)

A:--

F: --

P: --

Canada Manufacturing New Orders MoM (Oct)

A:--

F: --

P: --

Canada Core CPI MoM (Nov)

A:--

F: --

P: --

Canada Trimmed CPI YoY (SA) (Nov)

A:--

F: --

P: --

Canada Manufacturing Inventory MoM (Oct)

A:--

F: --

P: --

Canada CPI YoY (Nov)

A:--

F: --

P: --

Canada CPI MoM (Nov)

A:--

F: --

P: --

Canada CPI YoY (SA) (Nov)

A:--

F: --

P: --

Canada Core CPI MoM (SA) (Nov)

A:--

F: --

P: --

Canada CPI MoM (SA) (Nov)

A:--

F: --

P: --

Federal Reserve Board Governor Milan delivered a speech
U.S. NAHB Housing Market Index (Dec)

A:--

F: --

P: --

Australia Composite PMI Prelim (Dec)

--

F: --

P: --

Australia Services PMI Prelim (Dec)

--

F: --

P: --

Australia Manufacturing PMI Prelim (Dec)

--

F: --

P: --

Japan Manufacturing PMI Prelim (SA) (Dec)

--

F: --

P: --

U.K. 3-Month ILO Employment Change (Oct)

--

F: --

P: --

U.K. Unemployment Claimant Count (Nov)

--

F: --

P: --

U.K. Unemployment Rate (Nov)

--

F: --

P: --

U.K. 3-Month ILO Unemployment Rate (Oct)

--

F: --

P: --

U.K. Average Weekly Earnings (3-Month Average, Including Bonuses) YoY (Oct)

--

F: --

P: --

U.K. Average Weekly Earnings (3-Month Average, Excluding Bonuses) YoY (Oct)

--

F: --

P: --

France Services PMI Prelim (Dec)

--

F: --

P: --

France Composite PMI Prelim (SA) (Dec)

--

F: --

P: --

France Manufacturing PMI Prelim (Dec)

--

F: --

P: --

Germany Services PMI Prelim (SA) (Dec)

--

F: --

P: --

Germany Manufacturing PMI Prelim (SA) (Dec)

--

F: --

P: --

Germany Composite PMI Prelim (SA) (Dec)

--

F: --

P: --

Euro Zone Composite PMI Prelim (SA) (Dec)

--

F: --

P: --

Euro Zone Services PMI Prelim (SA) (Dec)

--

F: --

P: --

Euro Zone Manufacturing PMI Prelim (SA) (Dec)

--

F: --

P: --

U.K. Services PMI Prelim (Dec)

--

F: --

P: --

U.K. Manufacturing PMI Prelim (Dec)

--

F: --

P: --

U.K. Composite PMI Prelim (Dec)

--

F: --

P: --

Euro Zone ZEW Economic Sentiment Index (Dec)

--

F: --

P: --

Germany ZEW Current Conditions Index (Dec)

--

F: --

P: --

Germany ZEW Economic Sentiment Index (Dec)

--

F: --

P: --

Euro Zone Trade Balance (Not SA) (Oct)

--

F: --

P: --

Euro Zone ZEW Current Conditions Index (Dec)

--

F: --

P: --

Euro Zone Trade Balance (SA) (Oct)

--

F: --

P: --

Euro Zone Total Reserve Assets (Nov)

--

F: --

P: --

U.K. Inflation Rate Expectations

--

F: --

P: --

Q&A with Experts
    • All
    • Chatrooms
    • Groups
    • Friends
    Connecting
    .
    .
    .
    Type here...
    Add Symbol or Code

      No matching data

      All
      Trump Updates
      Recommend
      Stocks
      Cryptocurrencies
      Central Banks
      Featured News
      • All
      • Russia-Ukraine Conflict
      • Middle East Flashpoint
      • All
      • Russia-Ukraine Conflict
      • Middle East Flashpoint
      Search
      Products

      Charts Free Forever

      Chats Q&A with Experts
      Screeners Economic Calendar Data Tools
      Membership Features
      Data Warehouse Market Trends Institutional Data Policy Rates Macro

      Market Trends

      Market Sentiment Order Book Forex Correlations

      Top Indicators

      Charts Free Forever
      Markets

      News

      News Analysis 24/7 Columns Education
      From Institutions From Analysts
      Topics Columnists

      Latest Views

      Latest Views

      Trending Topics

      Top Columnists

      Latest Update

      Signals

      Copy Rankings Latest Signals Become a signal provider AI Rating
      Contests
      Brokers

      Overview Brokers Assessment Rankings Regulators News Claims
      Broker listing Forex Brokers Comparison Tool Live Spread Comparison Scam
      Q&A Complaint Scam Alert Videos Tips to Detect Scam
      More

      Business
      Events
      Careers About Us Advertising Help Center

      White Label

      Data API

      Web Plug-ins

      Affiliate Program

      Awards Institution Evaluation IB Seminar Salon Event Exhibition
      Vietnam Thailand Singapore Dubai
      Fans Party Investment Sharing Session
      FastBull Summit BrokersView Expo
      Recent Searches
        Top Searches
          Markets
          News
          Analysis
          User
          24/7
          Economic Calendar
          Education
          Data
          • Names
          • Latest
          • Prev

          View All

          No data

          Scan to Download

          Faster Charts, Chat Faster!

          Download App
          English
          • English
          • Español
          • العربية
          • Bahasa Indonesia
          • Bahasa Melayu
          • Tiếng Việt
          • ภาษาไทย
          • Français
          • Italiano
          • Türkçe
          • Русский язык
          • 简中
          • 繁中
          Open Account
          Search
          Products
          Charts Free Forever
          Markets
          News
          Signals

          Copy Rankings Latest Signals Become a signal provider AI Rating
          Contests
          Brokers

          Overview Brokers Assessment Rankings Regulators News Claims
          Broker listing Forex Brokers Comparison Tool Live Spread Comparison Scam
          Q&A Complaint Scam Alert Videos Tips to Detect Scam
          More

          Business
          Events
          Careers About Us Advertising Help Center

          White Label

          Data API

          Web Plug-ins

          Affiliate Program

          Awards Institution Evaluation IB Seminar Salon Event Exhibition
          Vietnam Thailand Singapore Dubai
          Fans Party Investment Sharing Session
          FastBull Summit BrokersView Expo

          Stocks Rise Modestly, Euro Slides After US-EU Trade Deal

          Olivia Brooks

          Economic

          Stocks

          Forex

          Summary:

          Wall Street equities rose slightly while European stock indexes turned lower and the euro took a tumble on Monday as investors greeted a trade agreement between the U.S. and European Union with cautious relief at the start of an action-packed week for markets.

          Wall Street equities rose slightly while European stock indexes turned lower and the euro took a tumble on Monday as investors greeted a trade agreement between the U.S. and European Union with cautious relief at the start of an action-packed week for markets.

          The weekend's framework trade deal, which European Commission President Ursula von der Leyen described as the best the bloc could get, will impose a 15% import tariff on most EU goods and see the EU spend $600 billion on U.S. investments while opening up some important parts of its market.

          While the accord may avert a damaging standoff between the trading partners, which account for almost a third of global trade, some European capitals complained it was lopsided in favor of Washington.

          Monday's modest equity reaction followed a series of record highs for the S&P 500 and Nasdaq, thanks to solid quarterly earnings so far, bets on megacaps and artificial intelligence stocks as well as optimism that the U.S. would ultimately reach agreements with its trading partners.

          The removal of uncertainty for the U.S.-EU relationship was a relief for investors, according to Phil Orlando, chief market strategist at Federated Hermes, who saw the 15% tariff as a lot better than "some of the ridiculous numbers that were being thrown around back in the first week in April."

          "You've got some certainty going forward, and you've got numbers that seem reasonable," said Orlando, while noting that Monday's modest reaction made sense after recent gains and ahead of a big week for economic releases, major earnings reports and a U.S. Federal Reserve meeting.

          Orlando said that at this point he would not be "throwing massive amounts of money" into a market where the S&P 500 has risen 32% since its April lows.

          "Our view is that you need to be patient. You absolutely could have a little bit of a hiccup here, consolidation and some digestion. We still think the market is going to work higher, longer term," he said.

          This week traders are waiting for interest rate decisions from the U.S. Federal Reserve and the Bank of Japan, the monthly U.S. non-farm payrolls report, and earnings from megacap companies Apple (AAPL.O), Microsoft (MSFT.O), and Amazon (AMZN.O).

          The Fed has been cautious on any rate cuts as officials have said they want to determine the impact of tariffs on inflation before they ease rates further. But the Fed's stance has led to tensions with the White House with President Donald Trump repeatedly lashing out at Fed Chair Jerome Powell for not cutting rates.

          On Wall Street at 11:03 a.m. the Dow Jones Industrial Average (.DJI), fell 8.27 points, or 0.02%, to 44,894.24, the S&P 500 (.SPX), rose 4.91 points, or 0.08%, to 6,393.48 and the Nasdaq Composite (.IXIC), rose 62.76 points, or 0.30%, to 21,170.54.

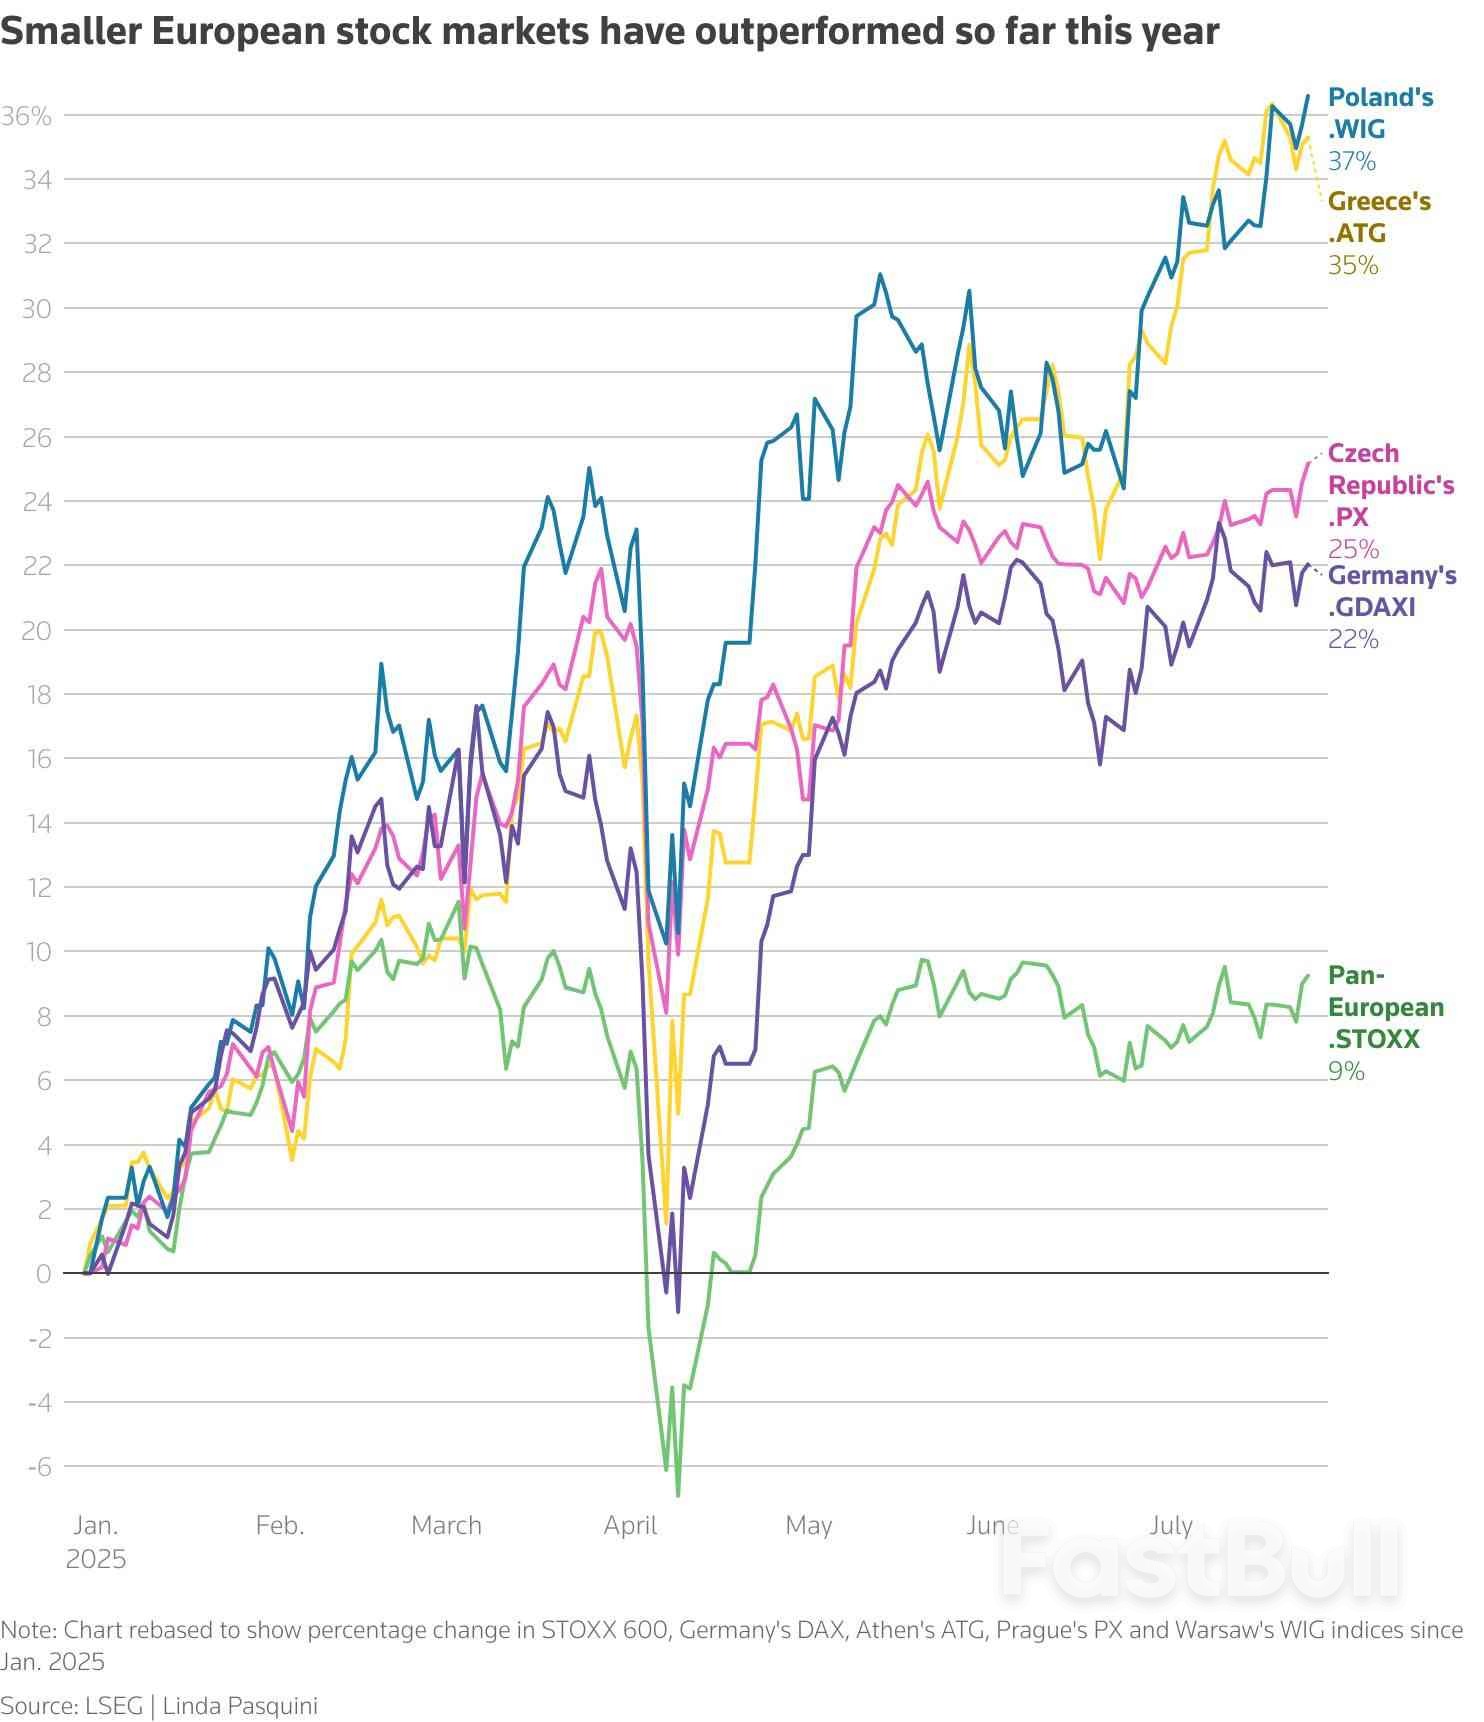
          MSCI's gauge of stocks across the globe (.MIWD00000PUS), fell 1.79 points, or 0.19%, to 939.47.The pan-European STOXX 600 (.STOXX), index fell 0.27%, while Europe's broad FTSEurofirst 300 index (.FTEU3), fell 5.16 points, or 0.24%

          And meanwhile, other countries are still scrambling to make deals ahead of Trump's August 1 deadline. Europe's deal follows U.S. pacts with Japan, Indonesia and the Philippines made last week. But talks between the U.S. and China in Stockholm on Monday are expected to lead to the two sides extending their trade truce for another 90 days.

          In currencies, the dollar rose against major currencies after the weekend's trade pact, with investors also looking to this week's U.S. and Japanese central bank meetings.

          The dollar index , which measures the greenback against a basket of currencies including the yen and the euro, rose 0.75% to 98.33.The euro was down 0.92% at $1.1632 while against the Japanese yen , the dollar strengthened 0.43% to 148.3.

          Apolline Menut at fund manager Carmignac meanwhile called it a win for the U.S., given the forced purchases of U.S. energy and military equipment and zero tariff retaliation by Europe.

          "This isn’t a trade breakthrough - it’s damage control for the sake of diplomatic pragmatism," she said. "The economic cost may sting, but the strategic calculus is brutally rational."

          In Treasuries, the yield on benchmark U.S. 10-year notes rose 2.6 basis points to 4.412%, from 4.386% late on Friday while the 30-year bond yield rose 2.4 basis points to 4.9533%.

          The 2-year note yield, which typically moves in step with interest rate expectations for the Federal Reserve, rose 1.7 basis points to 3.934%, from 3.917% late on Friday.

          In energy markets, oil prices rose after the U.S.-EU deal and Trump's announcement he would set for Russia to end its war in Ukraine or face severe tariffs.

          U.S. crude rose 1.86% to $66.36 a barrel and Brent rose to $69.68 per barrel, up 1.81% on the day.

          In precious metals, gold fell to a near three-week low as the trade accord lifted the dollar and risk sentiment, while investors awaited fresh cues on rate policy from this week's Federal Reserve meeting.

          Spot gold fell 0.83% to $3,308.34 an ounce. U.S. gold futures fell 0.25% to $3,325.50 an ounce.

          Source: Kitco

          To stay updated on all economic events of today, please check out our Economic calendar
          Risk Warnings and Disclaimers
          You understand and acknowledge that there is a high degree of risk involved in trading. Following any strategies or investment methods may lead to potential losses. The content on the site is provided by our contributors and analysts for information purposes only. You are solely responsible for determining whether any trading assets, securities, strategy, or any other product is suitable for investing based on your own investment objectives and financial situation.
          Add to Favorites
          Share

          Stocks Week Ahead: Complacent S&P 500 Bulls Face an Avalanche of News

          Adam

          Stocks

          A busy week is coming up with several significant market-moving events. Any one of these events individually could shake things up, but in this case, there’s at least one event every day.
          On Monday, we get the first part of the quarterly refunding announcement, followed later in the day by the 2-year and 5-year Treasury auctions. Tuesday brings JOLTS data and a 7-year Treasury auction.
          Wednesday is packed, featuring the ADP employment report, second-quarter GDP data, the second half of the quarterly refunding announcement, and meetings of both the Bank of Japan and the FOMC. On Thursday, we’ll see the Employment Cost Index and the June PCE report.
          The week concludes on Friday with the release of the jobs report and ISM Manufacturing data. As if that weren’t enough, Amazon, Apple, Meta, and Microsoft are all reporting earnings this week as well.
          Additionally, a largely forgotten court battle on tariffs will start on July 31, as the appeals court reviews the legality of the President’s tariffs.
          Yet, remarkably, the market doesn’t seem the least bit concerned about any of this. Implied volatility for Monday sits at a breezy 6.6%, rising to a supposedly “ground-shaking” 12.7% by Friday. This must be a joke, right? It has to be…
          Stocks Week Ahead: Complacent S&P 500 Bulls Face an Avalanche of News_1
          If the market continues trading in the tight ranges we’ve seen in recent weeks, even after all this news, I would be shocked. Something wouldn’t just be wrong—it would be completely broken. For 1-month realized volatility to fall further, we’d need daily trading ranges of less than 40 bps. To push the 10-day realized volatility lower, the index would need to trade in ranges narrower than 30 basis points per day.
          Stocks Week Ahead: Complacent S&P 500 Bulls Face an Avalanche of News_2
          I’ve noted repeatedly that the end of last week marked the window when the implied correlation should begin to rise, potentially signaling a market top. So far, that hasn’t happened, but the window remains open through the end of this week, especially given the major earnings reports still due from META, MSFT, AAPL, and AMZN.
          On top of that, the S&P 500 is now in overbought territory, with an RSI of 76, and is trading above its upper Bollinger Band.
          Stocks Week Ahead: Complacent S&P 500 Bulls Face an Avalanche of News_3
          Not only that, but the NASDAQ 100 is also overbought on the monthly chart, with an RSI above 72 and trading above its upper Bollinger Band. Additionally, notice the price is rising while the RSI is forming a lower high—a divergence pattern similar to what occurred in 2018 and 2021.
          Stocks Week Ahead: Complacent S&P 500 Bulls Face an Avalanche of News_4
          Additionally, as month-end approaches, liquidity typically becomes a concern—a problem compounded this week by significant Treasury settlements, which are likely to drive a more pronounced rise in the Treasury General Account (TGA). Overnight repo rates have already begun to increase, suggesting SOFR will move higher on Monday and will need to be watched during the week.
          Stocks Week Ahead: Complacent S&P 500 Bulls Face an Avalanche of News_5
          Overall, a lot is going on this week, yet the market appears overly complacent. Given the sheer volume of news flow, I would be genuinely surprised if volatility remains this tight for much longer.

          Source: investing

          Risk Warnings and Disclaimers
          You understand and acknowledge that there is a high degree of risk involved in trading. Following any strategies or investment methods may lead to potential losses. The content on the site is provided by our contributors and analysts for information purposes only. You are solely responsible for determining whether any trading assets, securities, strategy, or any other product is suitable for investing based on your own investment objectives and financial situation.
          Add to Favorites
          Share

          Markets Hope For One Thing From US-China Tariff Talks: Another 90-day Extension

          Thomas

          Economic

          US and Chinese trade negotiators are meeting this week for at least two days of trade talks as most of the immediate term focus — at least from markets — remains on whether recent de-escalatory signals between the two superpowers will translate into a further delay of punishing additional tariffs.

          Trump officials also hope this third gathering of the trade teams in recent months will provide an opportunity to pivot to longer-term issues even as a short-term deadline of Aug. 12 remains front of mind.

          The talks are being closely watched for whether they move the countries toward a face-to-face later this year between Presidents Trump and Xi Jinping as well as whether negotiators can solidify recent gains, such as a lessening of tensions around semiconductors and rare earth minerals.

          "We have a good relationship with China," President Trump said Monday just after his team stepped into the talks.

          He signaled his focus could be on market access, saying "I'd love to see China open up their country."

          Chinese state media also confirmed Monday that talks were underway at the Rosenbad building in Stockholm without providing additional details.

          The talks come during another crucial week for Trump's trade agenda, with a separate deadline looming this Friday for other countries to strike a deal after a pact was announced with the European Union Sunday setting 15% tariffs. Other major trading partners from Canada to South Korea are still in talks.

          Yet the recent momentum on trade for Trump could have a limited impact on the more complex talks with China.

          Zoe Liu, a senior fellow at the Council on Foreign Relations, noted on Yahoo Finance Monday morning that she does not think "the EU's model is going to be a good template for U.S.China negotiation" — pointing to how China has already proved a willingness to retaliate and that the country has key points of leverage and "knows exactly where to hit back."

          Terry Haines, Pangaea Policy Founder, added that potential carrots from China could also have less impact.

          He noted how foreign investment has been a key piece of recent deals — both with Europe and another pact with Japan — but that in the China context "they don't want Chinese investment in a lot of areas" — citing an effort to remove the influence of Chinese money in areas ranging from social media app TikTok to land purchases in the US.

          China's Vice Premier He Lifeng waves as he arrives on July 28 for trade talks. (FREDRIK SANDBERG/TT News Agency/AFP via Getty Images) · FREDRIK SANDBERG via Getty Images

          Overall talks seen as 'going in the right direction'

          The China talks are being led on the US side by Treasury Secretary Scott Bessent with He Lifeng, the China's vice premier for economic policy, representing his country

          Source: Yahoo Finance

          To stay updated on all economic events of today, please check out our Economic calendar
          Risk Warnings and Disclaimers
          You understand and acknowledge that there is a high degree of risk involved in trading. Following any strategies or investment methods may lead to potential losses. The content on the site is provided by our contributors and analysts for information purposes only. You are solely responsible for determining whether any trading assets, securities, strategy, or any other product is suitable for investing based on your own investment objectives and financial situation.
          Add to Favorites
          Share

          Four Themes Powering Europe's Equity Bull Market

          Winkelmann

          Stocks

          Economic

          The STOXX 600 posted its best first-quarter relative to the S&P 500 in a decade - but is now clocking an 8.4% gain in 2025, just a touch ahead of the S&P 500's 8.2% rise.

          The European Union over the weekend reached a framework deal with the U.S. for tariffs of 15%. But optimism has been building for some time that the two sides would avert a damaging trade war and the data points to an economy that is holding up for now. Investors are warming to four key themes at play under the surface of the European stock market.

          1) EXPORTERS LAG DOMESTIC-FOCUSED STOCKS

          A performance gap has emerged between euro zone domestic-focused stocks and exporters, all thanks to a stronger euro, which has risen 13.4% versus the dollar in 2025 , hurting exporter earnings.

          Trade-sensitive sectors like autos and consumer durables have fallen behind, while domestically-oriented stocks like banks and utilities have soared.

          A STOXX autos basket , opens new tab added over 3% last week after news of a U.S.-Japan trade deal, but is still about 1% lower in 2025, a stark contrast to a 35% increase in bank stocks, opens new tab and 15% surge in utilities.

          Line chart showing the year-to-date performance of autos, luxury, utilities and bank stocks in Europe

          Analysts have been revising down overall 2025 earnings forecasts in Europe, but zooming in, there is a clear split between the pace of earnings revisions for euro zone exporters versus domestic plays, with the forward EPS of exporters dropping at an accelerated pace.JPMorgan equity strategists advise clients to keep favouring domestics over exporters in their non-U.S. portfolios, while Barclays equity strategists say the current positioning gap is so extreme that the risk of a reversal is rising.

          Line chart shows year-on-year EPS estimates revisions for both EU exporters versus EU domestics, with exporters showing a more dramatic drop in 2025 versus domestics

          Helen Jewell, CIO of BlackRock Fundamental Equities EMEA, flagged select opportunities in the export-focused luxury and semiconductor sectors.

          "If we get some resolution of where the tariffs are and if we get some sort of levelling out of the dollar, I think these names will start to perform well, and that could potentially be the second leg for the European story,” Jewell said.

          2) HALO EFFECT

          Germany's massive spending plans, aimed at boosting the country's economy after decades of fiscal conservatism, brought optimism to broader European markets, as EU companies are set to benefit from increased spending on defense and infrastructure.The U.S. tariff announcement in April caused a massive stock sell-off, but the German DAX , has since recovered to touch a fresh year high in July. Midcap stocks , have followed a similar path. Both indexes are up over 20% this year and set for their strongest annual performance since 2019.

          "The relevance of Germany as a market for EU countries is great," Uwe Hohmann, equity strategist at Metzler Capital Markets said, pointing to the country's strong trade relationship with other EU states.Germany's spending plans will have a modest effect on European growth, according to the European Commission's spring economic forecasts, but the market impact is expected to be profound.

          "...the optimism around the German fiscal balance will still be the main driver of European markets in the next years," said Nabil Milali, portfolio manager at Edmond de Rothschild Asset Management, warning however that money will not concretely flow into the economy until 2026 at least.A potential deterioration in trade relationships with the U.S. or China could dampen sentiment on European equity markets, at least in the short term.

          "It would then only and mostly solely depend on what's going on in the German political arena, which is, I think, probably not good enough on a standalone basis to support an overall positive trend," said Hohmann.

          Chart shows percentage change in the DAX and STOXX 600 indices since Jan. 2025

          3) SMALL CAPS STEAL THE SPOTLIGHT

          European small-caps are on track to outperform large-caps in Europe for the first time since 2020.

          A basket of European small caps, opens new tab is up 13.4% in 2025, outperforming its large cap counterpart , opens new tab which is up 9.1%, for the first time since 2020. Since April, Graham Secker, head of equity strategy, Pictet Wealth Management said a stronger euro and better economic outlook have driven the small-cap turnaround."European small-caps were the proverbial value-trap: you're cheap but you stay cheap until something changes," said Secker, adding that in illiquid areas of the market, it doesn't take much to move the dial."There has been a lot of interest with the fiscal stimulus announcement out of Germany for revisiting German mid- and small-caps, as probably the cleanest way to play the fiscal push that's coming through Europe," Secker said.

          Bar chart comparing the annual performance of European small cap stocks versus large cap stocks, with small caps posting their first outperformance vs larger ones since 2019

          4) SMALLER MARKETS ALSO PACK A PUNCH

          Talking size, some smaller markets have also been outperforming the wider European landscape this year.

          Indexes in Czech Republic opens new tab, Greece, opens new tab and Poland , opens new tab have added 25%, 35% and 37%, respectively, compared with an 8% rise in the STOXX 600.

          "I think the positioning of investors is going more and more towards these smaller markets" which are benefiting from sectorial factors and higher exposure to the domestic economy, said Edmond de Rothschild's Milali.

          Chart shows percentage change in STOXX 600, Germany's DAX, Athen's ATG, Prague's PX and Warsaw's WIG indices since Jan. 2025

          Source: Reuters

          To stay updated on all economic events of today, please check out our Economic calendar
          Risk Warnings and Disclaimers
          You understand and acknowledge that there is a high degree of risk involved in trading. Following any strategies or investment methods may lead to potential losses. The content on the site is provided by our contributors and analysts for information purposes only. You are solely responsible for determining whether any trading assets, securities, strategy, or any other product is suitable for investing based on your own investment objectives and financial situation.
          Add to Favorites
          Share

          Japan’s $550 Billion US Fund Revealed to Be Mostly Loans, Not Investment

          Gerik

          Economic

          Breakdown of the Fund: Loans, Not Large-Scale Investment

          Japan’s chief trade negotiator Ryosei Akazawa revealed that only a sliver 1% to 2% of the highly publicized $550 billion US fund agreed in the recent US-Japan trade deal will be actual investment. The majority will be structured as loans and loan guarantees by Japanese state-backed financial institutions such as the Japan Bank for International Cooperation (JBIC) and Nippon Export and Investment Insurance (NEXI).
          This sharply reduces Japan’s financial risk, with Akazawa emphasizing that “it’s not that $550 billion in cash will be sent to the US.” In effect, Japan retains control over capital while leveraging the framework to deepen bilateral cooperation and influence US-based projects, including those involving third-country firms like Taiwanese semiconductor manufacturers.

          Revenue Mechanics: Profits for the US, Interest for Japan

          Japan has agreed to let the US keep 90% of the profits from the limited equity portion of the fund up from an initial 50-50 proposal. However, Akazawa dismissed concerns of a sellout, arguing the equity exposure is so small that the net loss will be marginal, amounting to “a couple of tens of billions of yen” at most.
          For the loan components, Japan expects to collect interest, while loan guarantees if unused will generate fee income. These mechanisms suggest Japan stands to benefit financially, flipping the narrative from concession to smart capital deployment.

          Tariff Cuts Offset Investment Asymmetry

          The US has agreed to reduce its universal tariffs on Japanese goods to 15%, effective as early as August 1, 2025, subject to a pending executive order. These cuts could yield tariff savings of approximately ¥10 trillion ($68 billion) for Japan, offering a strong economic rationale for the deal’s structure. The fund’s role, then, is not just about economic stimulus, but also a strategic tradeoff for securing more favorable access to the American market.
          The fund also signals Japan’s commitment to President Trump’s economic agenda during his second term, aligning with parallel agreements the US has struck with the European Union and other allies. The White House has promoted the Japan deal as a model for future trade frameworks, pairing tariff alignment with large capital pledges.
          Nonetheless, the lack of a formal, signed joint document raises implementation concerns. Akazawa said Japan is pushing for immediate action via US executive order to lock in tariff reductions, even without finalized paperwork, highlighting Tokyo’s urgency to cement gains before delays or political shifts threaten momentum.
          Japan’s $550 billion fund may appear massive, but the details show a cautious, strategic deployment of financial tools favoring loans and risk mitigation over direct spending. In return, Japan secures significant tariff relief and strengthens its geopolitical alliance with the US under Trump’s second term. As global trade policy realigns along security and investment lines, Tokyo’s approach reflects a pragmatic blend of diplomacy and financial prudence.

          Source: Reuters

          To stay updated on all economic events of today, please check out our Economic calendar
          Risk Warnings and Disclaimers
          You understand and acknowledge that there is a high degree of risk involved in trading. Following any strategies or investment methods may lead to potential losses. The content on the site is provided by our contributors and analysts for information purposes only. You are solely responsible for determining whether any trading assets, securities, strategy, or any other product is suitable for investing based on your own investment objectives and financial situation.
          Add to Favorites
          Share

          Apple, Meta, Amazon Face Mounting Tariff Pressures Amid AI Push: US Earnings Week Ahead

          Adam

          Economic

          Apple Inc., Amazon.com Inc. and Microsoft Corp. are among the bluechip names reporting that will underscore how companies are confronting tariff-fueled cost increases even as consumer confidence falters and artificial-intelligence investment needs grow.
          Meta Platforms Inc., seen as the most exposed to an ad spending pullback in the US by large Chinese advertisers, is likely to be quizzed about its unusually high compensation offers to lure AI talent.

          Highlights to look out for:

          Monday: Waste Management’s (WM US) adjusted earnings per share should rise after falling two consecutive quarters with its purchase of Stericycle already proving to be “more accretive than initially projected,” Bloomberg Intelligence said.
          Tuesday: Procter & Gamble (PG US) could detail more productivity efforts beyond the office job cuts it has planned over the next two years as it seeks to jumpstart stalling profit growth. Adjusted EPS is seen up 1.6% versus 2.2% a year ago.
          UnitedHealth (UNH US) is unlikely to reinstate guidance it withdrew in May, BI said, but any medical cost trend comments will be scrutinized after spiraling costs marred its peers’ results. The insurer is set to report its first adjusted EPS drop in four years. It also faces questions about federal spending cuts and Justice Department probes .Boeing (BA US) revenue should surge 29% as total commercial plane deliveries hit their highest in six quarters. Its defense segment is recovering from money-losing, fixed-price contracts, BI said.
          Apple, Meta, Amazon Face Mounting Tariff Pressures Amid AI Push: US Earnings Week Ahead_1
          UPS (UPS US) adjusted EPS could fall the first time in a year on tariffs and weak industrial demand. Management could skip guidance for the fourth quarter, BI said.Starbucks (SBUX US) US same-store sales are forecast to contract for sixth straight quarter even as international traffic expands for the first time in a year and a half. The US turnaround spearheaded by CEO Brian Niccol is taking longer than expected, probably due to stiff competition and the brand’s large footprint, BI said.Visa’s (V US) profit should be in line with its guidance, bolstered by healthy leisure and service spending, BI said. Like PayPal (PYPL US) and Mastercard (MA US), which reports Thursday, Visa faces concerns of volume share and margin erosion with stablecoins emerging as a possible payment tool. The threat isn’t immediate given regulatory hurdles and stablecoin’s prolonged consumer adoption curve, BI noted.
          Wednesday: Meta (META US) sales growth should be the slowest in two years. Ad pricing gains are stable due to its AI-driven ad targeting, BI said. Margins remain pressured near term by higher AI spending as exemplified by recent high-profile hires, Jefferies said.
          Microsoft (MSFT US) faces questions over the ramifications of a cyberattack on its SharePoint servers. Revenue is forecast to rise 14%, supported by gains in its intelligent cloud unit. Critical software and AI sales are less suspectible to tariff shocks and should prove resilient, BI said.Ford’s (F US) adjusted earnings may land at the low end of estimates, dragged down by tariffs and a production halt at its Chicago plant, BI said. The automaker has warned of $570 million in costs from a vehicle recall that will be treated as a special item in the quarter’s results. With US auto sales sputtering after a springtime surge, investors will want more clarity on prospects for the rest of the year.Qualcomm (QCOM US) sales growth is set to be the slowest in more than a year. PC and handset chips demand has stabilized but remains vulnerable to abrupt policy shifts, BI said.Altria (MO US) cigarette shipments are forecast to fall 10% as the flagship Malboro brand cedes market share to cheaper rivals. Higher selling prices and cost-saving efforts should offset the impact and pave the way for a 5-6% EPS gain, BI said.
          Thursday: Apple’s (AAPL US) Greater China revenue is seen rising for the first time in two years. Aggressive promotions there should have helped its product sales firm while its services segment chalks up its eighth quarter of double-digit gains. European Union antitrust moves have yet to slow App Store sales growth, Citi said. Continued delays with AI offerings and US trade policy will weigh on iPhone demand for the rest of the year, Citi added.
          Amazon’s (AMZN US) core retail business remains healthy in the face of tariffs thanks to its cost discipline, as evidenced in recent headount cuts, Jefferies said. Cloud computing is forecast to grow 5.1% sequentially amid persistent capacity limits. Modest margin compression is likely as the firm pursues automation and AI improvements.Reddit (RDDT US) ad sales likely rose 54%, versus 41% a year ago. User growth has stabilized on consistent Google Search traffic, Citizens said.AbbVie (ABBV US) revenue probably rose for a sixth straight quarter, buoyed by demand for its Skyrizi and Rinvoq therapies. Bristol-Meyers Squibb (BMY US) could raise profit guidance on the back of persistent dollar weakness, BI said. Merck (MRK US) — reporting Tuesday — should see sales shrink for a second quarter in a row due to a 50% drop in sales of its Gardasil vaccine.Coinbase (COIN US) likely lost market share as trading volume grew at the slowest pace in a year and a half. Healthy stablecoin growth could lift subscription and services revenue above its guidance of $600 million to $680 million, BI said.Comcast (CMCSA US) could post record broadband defections, with as many as 300,000 customers lost, BI said. Stepped up promotions to fend off competition will hit earnings with adjusted EPS forecast to contract for the first time since 2020.
          Friday: Chevron’s (CVX US) competitive inventory will be strengthened vis-a-vis arch rival Exxon Mobil’s (XOM US), following the close of its long-delayed Hess Corp. acquisition, BI said. Exxon, expected to post a 14% drop in revenue, may be asked about reports that it’s in talks to explore for oil and gas off the coast of Trinidad and Tobago.

          Source: Bloomberg

          To stay updated on all economic events of today, please check out our Economic calendar
          Risk Warnings and Disclaimers
          You understand and acknowledge that there is a high degree of risk involved in trading. Following any strategies or investment methods may lead to potential losses. The content on the site is provided by our contributors and analysts for information purposes only. You are solely responsible for determining whether any trading assets, securities, strategy, or any other product is suitable for investing based on your own investment objectives and financial situation.
          Add to Favorites
          Share

          Dallas Fed Manufacturing Index Rises To 0.9; SP500 Pulls Back From Session Highs

          Olivia Brooks

          Economic

          Key Points:

          ●Dallas Fed Manufacturing Index increased from -12.7 to +0.9.
          ●Production Index improved from +1.3 to +21.3.
          ●Capacity Utilization Index grew from -1.0 to +17.3.

          On July 28, 2025, the Federal Reserve Bank of Dallas released Dallas Fed Manufacturing Index report for July. The report indicated that Dallas Fed Manufacturing Index improved from -12.7 in June to +0.9 in July, compared to analyst forecast of -8.

          Production Index increased from 1.3 in June to 21.3 in July, while Capacity Utilization grew from -1.0 to 17.3. It should be noted that Production Index reached its highest level in more than three years.

          Prices Paid for Raw Materials declined from 43.0 in June to 41.7 in July, while Wages and Benefits decreased from 13.4 to 13.2.

          U.S. Dollar Index settled near session highs as traders reacted to the better-than-expected Dallas Fed Manufacturing Index report. Currently, U.S. Dollar Index is trying to settle above the 98.30 level. U.S. dollar is also supported by the U.S. – EU trade deal.

          Gold is trading near session lows as traders focus on the strong U.S. dollar. Gold has recently made an attempt to settle below the $3300 level.

          SP500 pulled back towards the 6400 level as traders took some profits off the table near historic highs. It remains to be seen whether the encouraging Dallas Fed Manufacturing Index report will provide sufficient support to SP500 as traders may stay focused on Trump’s tariff policy.

          Source: FX Empire

          To stay updated on all economic events of today, please check out our Economic calendar
          Risk Warnings and Disclaimers
          You understand and acknowledge that there is a high degree of risk involved in trading. Following any strategies or investment methods may lead to potential losses. The content on the site is provided by our contributors and analysts for information purposes only. You are solely responsible for determining whether any trading assets, securities, strategy, or any other product is suitable for investing based on your own investment objectives and financial situation.
          Add to Favorites
          Share
          FastBull
          Copyright © 2025 FastBull Ltd

          728 RM B 7/F GEE LOK IND BLDG NO 34 HUNG TO RD KWUN TONG KLN HONG KONG

          TelegramInstagramTwitterfacebooklinkedin
          App Store Google Play Google Play
          Products
          Charts

          Chats

          Q&A with Experts
          Screeners
          Economic Calendar
          Data
          Tools
          Membership
          Features
          Function
          Markets
          Copy Trading
          Latest Signals
          Contests
          News
          Analysis
          24/7
          Columns
          Education
          Company
          Careers
          About Us
          Contact Us
          Advertising
          Help Center
          Feedback
          User Agreement
          Privacy Policy
          Business

          White Label

          Data API

          Web Plug-ins

          Poster Maker

          Affiliate Program

          Risk Disclosure

          The risk of loss in trading financial instruments such as stocks, FX, commodities, futures, bonds, ETFs and crypto can be substantial. You may sustain a total loss of the funds that you deposit with your broker. Therefore, you should carefully consider whether such trading is suitable for you in light of your circumstances and financial resources.

          No decision to invest should be made without thoroughly conducting due diligence by yourself or consulting with your financial advisors. Our web content might not suit you since we don't know your financial conditions and investment needs. Our financial information might have latency or contain inaccuracy, so you should be fully responsible for any of your trading and investment decisions. The company will not be responsible for your capital loss.

          Without getting permission from the website, you are not allowed to copy the website's graphics, texts, or trademarks. Intellectual property rights in the content or data incorporated into this website belong to its providers and exchange merchants.

          Not Logged In

          Log in to access more features

          FastBull Membership

          Not yet

          Purchase

          Become a signal provider
          Help Center
          Customer Service
          Dark Mode
          Price Up/Down Colors

          Log In

          Sign Up

          Position
          Layout
          Fullscreen
          Default to Chart
          The chart page opens by default when you visit fastbull.com