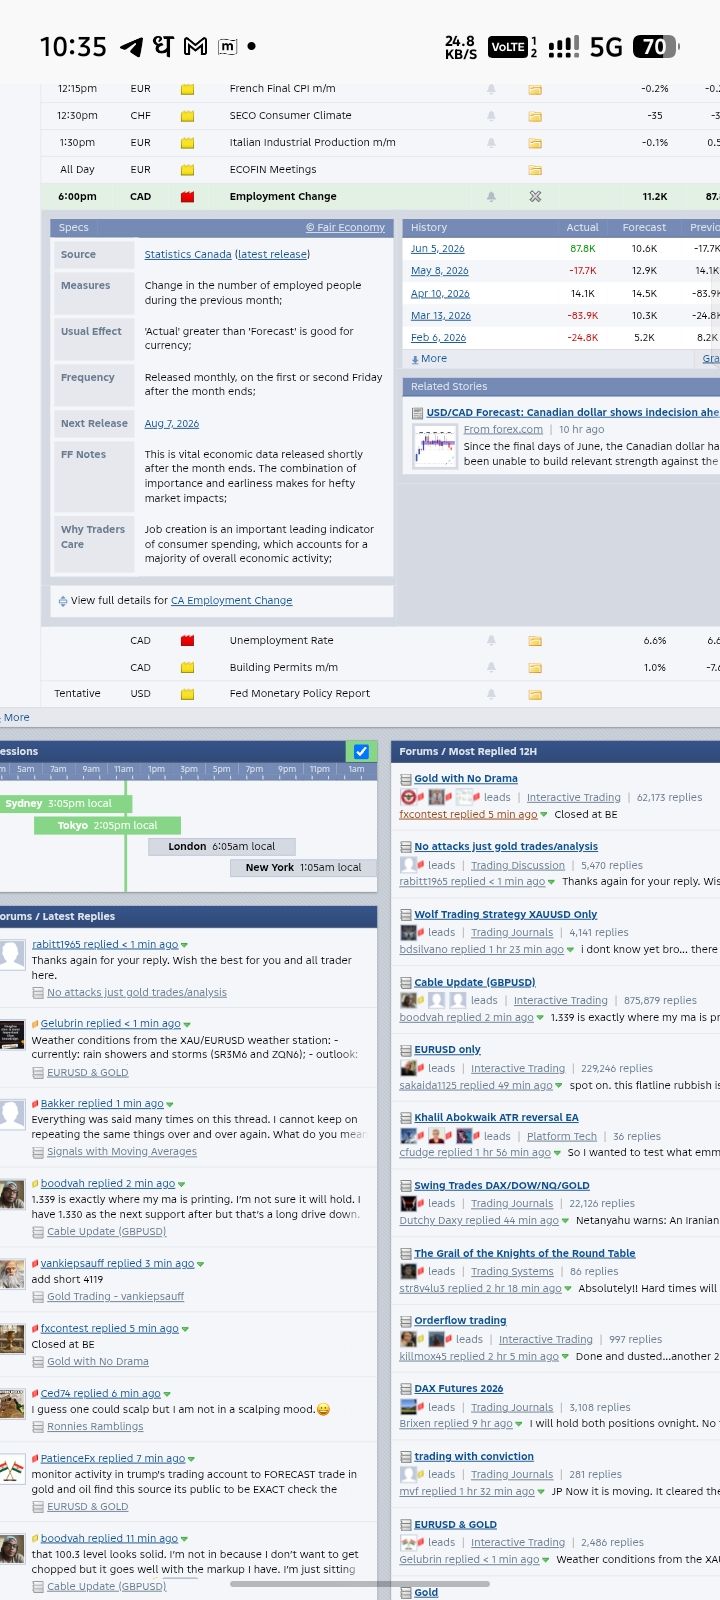
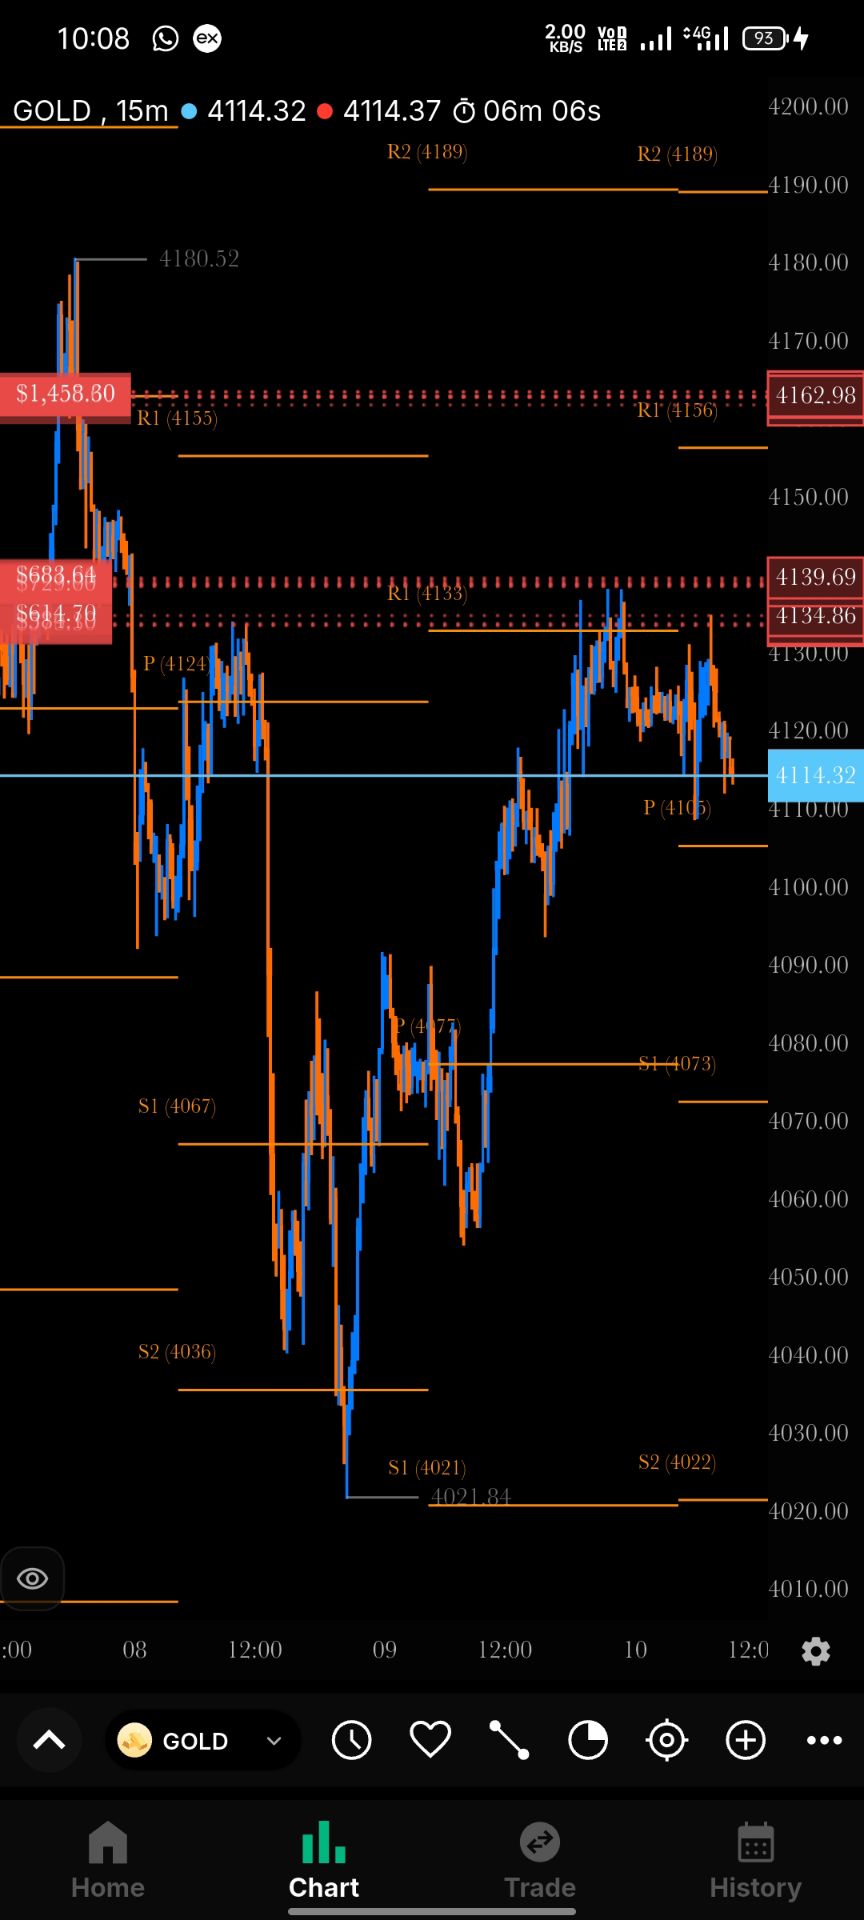
• Trade
  • Markets
  • Copy
  • Contests
  • 24/7
  • Calendar
  • Q&A
  • Chats
Screeners
SYMBOL
LAST
ASK
BID
HIGH
LOW
NET CHG.
%CHG.
SPREAD
SPX
S&P 500 Index
6932.31
6932.31
6932.31
6944.90
6828.78
+133.91
+ 1.97%
--
DJI
Dow Jones Industrial Average
50115.66
50115.66
50115.66
50169.65
49032.19
+1206.95
+ 2.47%
--
IXIC
NASDAQ Composite Index
23031.20
23031.20
23031.20
23088.46
22586.40
+490.63
+ 2.18%
--
USDX
US Dollar Index
97.210
97.290
97.210
97.600
97.130
-0.310
-0.32%
--
EURUSD
Euro / US Dollar
1.18611
1.18618
1.18611
1.18695
1.18094
+0.00468
+ 0.40%
--
GBPUSD
Pound Sterling / US Dollar
1.36060
1.36070
1.36060
1.36285
1.35861
+0.00010
+ 0.01%
--
XAUUSD
Gold / US Dollar
4998.34
4998.77
4998.34
5046.98
4964.41
+32.30
+ 0.65%
--
WTI
Light Sweet Crude Oil
63.604
63.634
63.604
63.694
62.468
+0.294
+ 0.46%
--

Community Accounts

Signal Accounts
--
Profit Accounts
--
Loss Accounts
--
View More

Become a signal provider

Sell trading signals to earn additional income

View More

Guide to Copy Trading

Get started with ease and confidence

View More

Signal Accounts for Members

All Signal Accounts

Best Return
  • Best Return
  • Best P/L
  • Best MDD
Past 1W
  • Past 1W
  • Past 1M
  • Past 1Y

All Contests

  • All
  • Trump Updates
  • Recommend
  • Stocks
  • Cryptocurrencies
  • Central Banks
  • Featured News
Top News Only
Share

Stats Office - Tanzania Inflation At 3.3% Year-On-Year In January

Share

UK Prime Minister Starmer's Director Of Communications Tim Allan Steps Down - Guardian Reporter

Share

Israel Budget Deficit 4.9% Of GDP In January Over Past 12 Months Versus 4.7% Deficit In December

Share

Spot Platinum Falls Over 3% At $2029.78/Oz

Share

[Bitcoin Dips Below $69K Temporarily, 24-Hour Loss Of 3.3%] February 9Th, According To Htx Market Data, Bitcoin Briefly Fell Below $69,000, Currently Trading At $68,868.58, With A 24-Hour Percentage Decrease Of 3.3%

Share

USA S&P 500 E-Mini Futures Down 0.3%, NASDAQ 100 Futures Down 0.5%

Share

Unicredit CEO: We Speak To Generali Regularly, They'Re An Industrial Partner

Share

Wright Expects The Country To Hold Democratic Elections In The Next 18 To 24 Months

Share

US Energy Secretary Chris Wright Will Soon Travel To Venezuela To Meet Its Leaders And Discuss The Future Of Its State-Run Oil Company

Share

US Vice President Vance Heads To Armenia, Azerbaijan To Push Peace, Trade

Share

Indian Rupee Down 0.1% At 90.7625 Per USA Dollar As Of 3:30 P.M. Ist, Previous Close 90.6550

Share

European Central Bank's Kocher: Inflation Expectations Fully Anchored And Forex Movements Already Factored In

Share

Descartes: China Imports Were 771093 Teus, Down 22.7% From January 2025

Share

European Central Bank's Kocher: Europe Must Prepare For Greater Financial Safe Haven Role

Share

Descartes: USA Container Imports Totaled 2.3 Million Teus In January, Down 6.8% Year-On-Year

Share

Slovenia's CPI Rises By 2.6% Year-On-Year In January

Share

Uganda Central Bank Holds Its Key Lending Rate At 9.75%

Share

53 Migrants Dead Or Missing After Boat Capsized Off Cost Of Libya - Iom

Share

Kremlin: US Attempts To Suffocate Cuba Are Causing Difficulties, We Are Talking To Havana About Resolving These Problems

Share

Japan Prime Minister Takaichi: We're Keeping Dialogue With China Open

TIME
ACT
FCST
PREV
U.K. Halifax House Price Index YoY (SA) (Jan)

A:--

F: --

P: --
U.K. Halifax House Price Index MoM (SA) (Jan)

A:--

F: --

P: --
France Trade Balance (SA) (Dec)

A:--

F: --

P: --
Canada Leading Index MoM (Jan)

A:--

F: --

P: --
Mexico Consumer Confidence Index (Jan)

A:--

F: --

P: --

Canada Employment (SA) (Jan)

A:--

F: --

P: --
Canada Full-time Employment (SA) (Jan)

A:--

F: --

P: --
Canada Part-Time Employment (SA) (Jan)

A:--

F: --

P: --
Canada Unemployment Rate (SA) (Jan)

A:--

F: --

P: --

Canada Labor Force Participation Rate (SA) (Jan)

A:--

F: --

P: --

Due to the previous government shutdown, the release date of the US January non-farm payroll report has been changed to February 11.
U.S. UMich Consumer Sentiment Index Prelim (Feb)

A:--

F: --

P: --

U.S. UMich Consumer Expectations Index Prelim (Feb)

A:--

F: --

P: --

Canada Ivey PMI (Not SA) (Jan)

A:--

F: --

P: --

U.S. UMich Current Economic Conditions Index Prelim (Feb)

A:--

F: --

P: --

Canada Ivey PMI (SA) (Jan)

A:--

F: --

P: --

U.S. UMich 5-Year-Ahead Inflation Expectations Prelim YoY (Feb)

A:--

F: --

P: --

U.S. UMich 1-Year-Ahead Inflation Expectations Prelim (Feb)

A:--

F: --

P: --

U.S. 5-10 Year-Ahead Inflation Expectations (Feb)

A:--

F: --

P: --

Russia Retail Sales YoY (Dec)

A:--

F: --

P: --

Russia Unemployment Rate (Dec)

A:--

F: --

P: --

Russia Quarterly GDP Prelim YoY (Q1)

--

F: --

P: --

U.S. Weekly Total Oil Rig Count

A:--

F: --

P: --

U.S. Weekly Total Rig Count

A:--

F: --

P: --

U.S. Consumer Credit (SA) (Dec)

A:--

F: --

P: --
China, Mainland Foreign Exchange Reserves (Jan)

A:--

F: --

P: --

Japan Wages MoM (Dec)

A:--

F: --

P: --

Japan Trade Balance (Customs Data) (SA) (Dec)

A:--

F: --

P: --

Japan Trade Balance (Dec)

A:--

F: --

P: --

Euro Zone Sentix Investor Confidence Index (Feb)

A:--

F: --

P: --

Mexico CPI YoY (Jan)

--

F: --

P: --

Mexico 12-Month Inflation (CPI) (Jan)

--

F: --

P: --

Mexico PPI YoY (Jan)

--

F: --

P: --

Mexico Core CPI YoY (Jan)

--

F: --

P: --

ECB Chief Economist Lane Speaks
Canada National Economic Confidence Index

--

F: --

P: --

China, Mainland M0 Money Supply YoY (Jan)

--

F: --

P: --

China, Mainland M2 Money Supply YoY (Jan)

--

F: --

P: --

China, Mainland M1 Money Supply YoY (Jan)

--

F: --

P: --

ECB President Lagarde Speaks
U.K. BRC Overall Retail Sales YoY (Jan)

--

F: --

P: --

U.K. BRC Like-For-Like Retail Sales YoY (Jan)

--

F: --

P: --

Indonesia Retail Sales YoY (Dec)

--

F: --

P: --

France ILO Unemployment Rate (SA) (Q4)

--

F: --

P: --

U.S. NFIB Small Business Optimism Index (SA) (Jan)

--

F: --

P: --

Brazil IPCA Inflation Index YoY (Jan)

--

F: --

P: --

Brazil CPI YoY (Jan)

--

F: --

P: --

U.S. Retail Sales (Dec)

--

F: --

P: --

U.S. Retail Sales YoY (Dec)

--

F: --

P: --

U.S. Labor Cost Index QoQ (Q4)

--

F: --

P: --

U.S. Import Price Index MoM (Dec)

--

F: --

P: --

U.S. Export Price Index YoY (Dec)

--

F: --

P: --

U.S. Export Price Index MoM (Dec)

--

F: --

P: --

U.S. Import Price Index YoY (Dec)

--

F: --

P: --

U.S. Retail Sales MoM (Dec)

--

F: --

P: --

U.S. Core Retail Sales MoM (Dec)

--

F: --

P: --

U.S. Core Retail Sales (Dec)

--

F: --

P: --

U.S. Retail Sales MoM (Excl. Gas Stations & Vehicle Dealers) (SA) (Dec)

--

F: --

P: --

U.S. Retail Sales MoM (Excl. Automobile) (SA) (Dec)

--

F: --

P: --

U.S. Weekly Redbook Index YoY

--

F: --

P: --

U.S. Commercial Inventory MoM (Nov)

--

F: --

P: --

Q&A with Experts
    • All
    • Chatrooms
    • Groups
    • Friends
    SALVADOR flag
    Why did the dollar fall this morning?
    Size flag
    Size flag
    Size
    @Сергей Арх
    Size flag
    Сергей Арх
    @Сергей Архyou are welcome mate..
    3271138 flag
    pls updete buy position price pls updete bro
    3271138 flag
    gold
    Size flag
    SALVADOR
    Why did the dollar fall this morning?
    @SALVADORMainly due to softer economic signals and growing expectations for Fed easing.
    3271138 flag
    pls updete gold buy position price pls updete bro
    SlowBear ⛅ flag
    3271138
    pls updete buy position price pls updete bro
    @3271138An update buy position where and on what?
    SlowBear ⛅ flag
    3271138
    gold
    @3271138Oh okay buy around... you know what let me check and share with you
    SlowBear ⛅ flag
    Сергей Арх flag
    Size
    @Size I didn't find it, I'm on my PC
    SlowBear ⛅ flag
    SlowBear ⛅
    @3271138 for a short buy on Gold lok at this 4955-60 is a good region for a buy!
    Visxa Benfica flag
    Faburama Bojang
    @Faburama BojangThe plan has two buying zones, which sounds very reasonable, bro
    Visxa Benfica flag
    Waiting for the price to drop to 4975 to buy again is a good idea
    Size flag
    Сергей Арх
    @Сергей Архon PC it’s usually under Menu → Tools → Bar Replay / Backtesting.
    Visxa Benfica flag
    3271138
    pls updete gold buy position price pls updete bro
    @3271138For me, I still prefer to hold long provided that it doesn't break below the crucial 4900-4920 support level
    Size flag
    Make sure your chart is loaded first, then you can select the period to replay.”@Сергей Арх
    Visxa Benfica flag
    In my opinion, don't FOMO when you see prices rising rapidly; it could be a bull trap
    Visxa Benfica flag
    Type here...
    Add Symbol or Code

      No matching data

      All
      Trump Updates
      Recommend
      Stocks
      Cryptocurrencies
      Central Banks
      Featured News
      • All
      • Russia-Ukraine Conflict
      • Middle East Flashpoint
      • All
      • Russia-Ukraine Conflict
      • Middle East Flashpoint
      Search
      Products

      Charts Free Forever

      Chats Q&A with Experts
      Screeners Economic Calendar Data Tools
      Membership Features
      Data Warehouse Market Trends Institutional Data Policy Rates Macro

      Market Trends

      Market Sentiment Order Book Forex Correlations

      Top Indicators

      Charts Free Forever
      Markets

      News

      24/7 Analysis Education

      Latest Views

      Latest Update

      Signals

      Copy Rankings Latest Signals Become a signal provider AI Rating
      Contests
      Brokers

      Overview Brokers Assessment Rankings Regulators News Claims
      Broker listing Forex Brokers Comparison Tool Live Spread Comparison Scam
      Q&A Complaint Scam Alert Videos Tips to Detect Scam
      More

      Business
      Events
      Careers About Us Advertising Help Center

      White Label

      Broker API

      Data API

      Web Plug-ins

      Affiliate Program

      Awards Institution Evaluation IB Seminar Salon Event Exhibition
      Vietnam Thailand Singapore Dubai
      Fans Party Investment Sharing Session
      FastBull Summit BrokersView Expo
      Recent Searches
        Top Searches
          Markets
          Analysis
          User
          24/7
          Economic Calendar
          Education
          Data
          • Names
          • Latest
          • Prev

          View All

          No data

          Scan to Download

          Faster Charts, Chat Faster!

          Download App
          English
          • English
          • Español
          • العربية
          • Bahasa Indonesia
          • Bahasa Melayu
          • Tiếng Việt
          • ภาษาไทย
          • Français
          • Italiano
          • Türkçe
          • Русский язык
          • 简中
          • 繁中
          Open Account
          Search
          Products
          Charts Free Forever
          Markets
          News
          Signals

          Copy Rankings Latest Signals Become a signal provider AI Rating
          Contests
          Brokers

          Overview Brokers Assessment Rankings Regulators News Claims
          Broker listing Forex Brokers Comparison Tool Live Spread Comparison Scam
          Q&A Complaint Scam Alert Videos Tips to Detect Scam
          More

          Business
          Events
          Careers About Us Advertising Help Center

          White Label

          Broker API

          Data API

          Web Plug-ins

          Affiliate Program

          Awards Institution Evaluation IB Seminar Salon Event Exhibition
          Vietnam Thailand Singapore Dubai
          Fans Party Investment Sharing Session
          FastBull Summit BrokersView Expo

          Stellar XLM Price Prediction 2025, 2026 – 2030: Will The XLM Coin Reach $1?

          Coinpedia
          Ethereum / Tether
          -2.69%
          1inch / Tether
          -2.25%
          Vaulta / Tether
          -3.73%
          AAVE / Tether
          -2.12%

          Story Highlights

          • The live price of the Stellar crypto is
          • XLM price could reach a maximum of $1.29 in 2025.
          • This altcoin could surpass the $6 mark with a high of $6.19 by 2030.

          With the crypto market expecting 2025 to be a bullish year, marketers have their radars on the top 20 fundamentally strong cryptos. And Stellar is one among the many altcoins that the marketers do not want to miss out on ahead of the altcoin season.

          The intricate dynamics of XLM have raised the curtain for the million-dollar question: “Will XLM make a comeback?” If yes, then “When will XLM reach $1?”

          This Stellar Price Prediction clears all such queries and hints at the price targets for 2025 and the years to follow until 2030

          Table of contents

          • Story Highlights
          • Overview
          • XLM Price Prediction 2025
          • Stellar Lumens Price Targets 2026 - 2030
            • Stellar Crypto Price Prediction 2026
            • XLM Price Prediction 2027
            • XLM Stellar Price Prediction 2028
            • XLM Coin Price Analysis 2029
            • Stellar Price Prediction 2030
          • Market Analysis
          • CoinPedia’s Stellar Price Prediction
          • Navigating Stellar's Future: A Conclusion on XLM's Potential
          • FAQs

          Overview

          Cryptocurrency
          Token
          USD Price
          Market Cap
          Trading Volume
          Circulating Supply
          All-time high$0.9381 on 04th January 2018
          All-time low$0.0011227 on 19th November 2014

          *The statistics are from press time.

          XLM Price Prediction 2025

          If the market sentiment intensifies and investors experience an AltSeason, this can push the price of this crypto token toward a new ATH. Considering the present market sentiments, the XLM price could conclude the year 2025 with a potential high of $1.29.

          In case of a bearish correction, the XLM price USD might slide down to $0.65. With this, the Stellar price could settle with an average trading price of $0.97.

          Year2025
          Potential Low$0.65
          Average Price$0.97
          Potential High$1.29

          Read our XRP Price Prediction 2025, 2026 - 2030!

          Stellar Lumens Price Targets 2026 - 2030

          YearPotential Low ($)Average Price ($)Potential High ($)
          20260.861.311.76
          20271.271.922.58
          20281.762.563.36
          20292.493.674.85
          20303.014.606.19

          Stellar Crypto Price Prediction 2026

          The XLM price could reach a high of $1.76 in 2026 by potentially breaching its psychological level of $1.50. However, it may hit a low of $0.86, with an average price of $1.31.

          XLM Price Prediction 2027

          The Stellar price may continue its bullish run in 2027, potentially reaching a high of $2.58. On the other hand, the low could be around $1.27, with an average price of $1.92.

          XLM Stellar Price Prediction 2028

          The XLM Stellar price may trade within the range of $1.76 and $3.36 during the year 2028, with an average price of $2.56.

          XLM Coin Price Analysis 2029

          This altcoin may surpass $4.50 and reach a high of $4.85 in 2029. Conversely, if the bears dominate the market, it could hit a low of $2.49, with an average price of $3.67.

          Stellar Price Prediction 2030

          By 2030, the XLM price may achieve a new all-time high of $6.19. However, it could hit a low of $3.01, with an average price of $4.60.

          Market Analysis

          Firm Name202520262030
          Changelly$0.149$0.217$1.07
          coincodex$0.676$0.358$0.681
          Binance$0.417$0.437$0.532

          *The aforementioned targets are the average targets set by the respective firms.

          CoinPedia’s Stellar Price Prediction

          Soaring with the altcoins, Stellar Price Prediction projects an uphill movement. Moreover, the recent breakout will push the price of XLM to soar to a maximum of $1.29 this year.

          However, the updates not yielding the desired results could turn bearish for the price, which could fall to $0.65.

          We expect this altcoin to reach the high of $1.29 by the end of 2025.

          Year2025
          Potential Low$0.65
          Average Price$0.97
          Potential High$1.29

          Also Check Out The Cronos Price Prediction 2025, 2026 - 2030!

          Navigating Stellar's Future: A Conclusion on XLM's Potential

          Our analysis of XLM's technical indicators and adoption trends suggests it could reach $1 by 2030. However, macro factors may pose resistance. Remember, cryptocurrency predictions carry uncertainty—research before investing.

          Only invest amounts you can afford to lose and be prepared for volatility.

          FAQs

          Is Stellar a good investment?

          Yes, it is a good investment option for the long term, as its stout fundamentals could eventually drive the price up.

          What will be the Maximum trading price of Stellar by the end of 2025?

          The Stellar price could reach a maximum of $1.29 during 2025.

          What will be the maximum trading price of XLM by the end of 2030?

          With a potential surge, the price may reach a maximum of $6.19 by 2030.

          Is XLM an ERC-20 token?

          No, XLM serves the Stellar blockchain, it is not correlated with Ethereum.

          Does Stellar have a future?

          Its vision holds numerous milestones and updates, considering that the future does seem to be bright.

          What algorithm does Stellar use?

          The Stellar cryptocurrency project uses the Consensus Protocol algorithm.

          Does Stellar use mining?

          No, this crypto token cannot be mined.

          XLM

          BINANCE

          Risk Warnings and Disclaimers
          You understand and acknowledge that there is a high degree of risk involved in trading. Following any strategies or investment methods may lead to potential losses. The content on the site is provided by our contributors and analysts for information purposes only. You are solely responsible for determining whether any trading assets, securities, strategy, or any other product is suitable for investing based on your own investment objectives and financial situation.
          Add to Favorites
          Share
          FastBull
          Copyright © 2026 FastBull Ltd

          728 RM B 7/F GEE LOK IND BLDG NO 34 HUNG TO RD KWUN TONG KLN HONG KONG

          TelegramInstagramTwitterfacebooklinkedin
          App Store Google Play Google Play
          Products
          Charts

          Chats

          Q&A with Experts
          Screeners
          Economic Calendar
          Data
          Tools
          Membership
          Features
          Function
          Markets
          Copy Trading
          Latest Signals
          Contests
          24/7
          Analysis
          Education
          Company
          Careers
          About Us
          Contact Us
          Advertising
          Help Center
          Feedback
          User Agreement
          Privacy Policy
          Personal Information Protection Statement
          Business

          White Label

          Broker API

          Data API

          Web Plug-ins

          Poster Maker

          Affiliate Program

          Risk Disclosure

          The risk of loss in trading financial instruments such as stocks, FX, commodities, futures, bonds, ETFs and crypto can be substantial. You may sustain a total loss of the funds that you deposit with your broker. Therefore, you should carefully consider whether such trading is suitable for you in light of your circumstances and financial resources.

          No decision to invest should be made without thoroughly conducting due diligence by yourself or consulting with your financial advisors. Our web content might not suit you since we don't know your financial conditions and investment needs. Our financial information might have latency or contain inaccuracy, so you should be fully responsible for any of your trading and investment decisions. The company will not be responsible for your capital loss.

          Without getting permission from the website, you are not allowed to copy the website's graphics, texts, or trademarks. Intellectual property rights in the content or data incorporated into this website belong to its providers and exchange merchants.

          Not Logged In

          Log in to access more features

          Connect Broker
          Become a signal provider
          Help Center
          Customer Service
          Dark Mode
          Price Up/Down Colors

          Log In

          Sign Up

          Position
          Layout
          Fullscreen
          Default to Chart
          The chart page opens by default when you visit fastbull.com