

Markets
News
Analysis
User
24/7
Economic Calendar
Education
Data
- Names
- Latest
- Prev


Signal Accounts for Members
All Signal Accounts
All Contests
 Japan Tankan Small Manufacturing Outlook Index (Q4)
A:--
F: --
P: --
Japan Tankan Large Non-Manufacturing Outlook Index (Q4)A:--
F: --
P: --
Japan Tankan Large Manufacturing Outlook Index (Q4)A:--
F: --
P: --
Japan Tankan Small Manufacturing Diffusion Index (Q4)A:--
F: --
P: --
Japan Tankan Large-Enterprise Capital Expenditure YoY (Q4)A:--
F: --
P: --
 U.K. Rightmove House Price Index YoY (Dec)
A:--
F: --
P: --
 China, Mainland Industrial Output YoY (YTD) (Nov)
A:--
F: --
P: --
China, Mainland Urban Area Unemployment Rate (Nov)A:--
F: --
P: --
 Saudi Arabia CPI YoY (Nov)
A:--
F: --
P: --
 Euro Zone Industrial Output YoY (Oct)
A:--
F: --
P: --
Euro Zone Industrial Output MoM (Oct)A:--
F: --
P: --
 Canada Existing Home Sales MoM (Nov)
A:--
F: --
P: --
Canada National Economic Confidence IndexA:--
F: --
P: --
Canada New Housing Starts (Nov)A:--
F: --
 U.S. NY Fed Manufacturing Employment Index (Dec)
A:--
F: --
P: --
U.S. NY Fed Manufacturing Index (Dec)A:--
F: --
P: --
Canada Core CPI YoY (Nov)A:--
F: --
P: --
Canada Manufacturing Unfilled Orders MoM (Oct)A:--
F: --
P: --
U.S. NY Fed Manufacturing Prices Received Index (Dec)A:--
F: --
P: --
U.S. NY Fed Manufacturing New Orders Index (Dec)A:--
F: --
P: --
Canada Manufacturing New Orders MoM (Oct)A:--
F: --
P: --
Canada Core CPI MoM (Nov)A:--
F: --
P: --
Canada Trimmed CPI YoY (SA) (Nov)A:--
F: --
P: --
Canada Manufacturing Inventory MoM (Oct)A:--
F: --
P: --
Canada CPI YoY (Nov)A:--
F: --
P: --
Canada CPI MoM (Nov)A:--
F: --
P: --
Canada CPI YoY (SA) (Nov)A:--
F: --
P: --
Canada Core CPI MoM (SA) (Nov)A:--
F: --
P: --
Canada CPI MoM (SA) (Nov)A:--
F: --
P: --
Federal Reserve Board Governor Milan delivered a speech U.S. NAHB Housing Market Index (Dec)A:--
F: --
P: --
 Australia Composite PMI Prelim (Dec)
--
F: --
P: --
Australia Services PMI Prelim (Dec)--
F: --
P: --
Australia Manufacturing PMI Prelim (Dec)--
F: --
P: --
Japan Manufacturing PMI Prelim (SA) (Dec)--
F: --
P: --
U.K. 3-Month ILO Employment Change (Oct)--
F: --
P: --
U.K. Unemployment Claimant Count (Nov)--
F: --
P: --
U.K. Unemployment Rate (Nov)--
F: --
P: --
U.K. 3-Month ILO Unemployment Rate (Oct)--
F: --
P: --
U.K. Average Weekly Earnings (3-Month Average, Including Bonuses) YoY (Oct)--
F: --
P: --
U.K. Average Weekly Earnings (3-Month Average, Excluding Bonuses) YoY (Oct)--
F: --
P: --
 France Services PMI Prelim (Dec)
--
F: --
P: --
France Composite PMI Prelim (SA) (Dec)--
F: --
P: --
France Manufacturing PMI Prelim (Dec)--
F: --
P: --
 Germany Services PMI Prelim (SA) (Dec)
--
F: --
P: --
Germany Manufacturing PMI Prelim (SA) (Dec)--
F: --
P: --
Germany Composite PMI Prelim (SA) (Dec)--
F: --
P: --
Euro Zone Composite PMI Prelim (SA) (Dec)--
F: --
P: --
Euro Zone Services PMI Prelim (SA) (Dec)--
F: --
P: --
Euro Zone Manufacturing PMI Prelim (SA) (Dec)--
F: --
P: --
U.K. Services PMI Prelim (Dec)--
F: --
P: --
U.K. Manufacturing PMI Prelim (Dec)--
F: --
P: --
U.K. Composite PMI Prelim (Dec)--
F: --
P: --
Euro Zone ZEW Economic Sentiment Index (Dec)--
F: --
P: --
Germany ZEW Current Conditions Index (Dec)--
F: --
P: --
Germany ZEW Economic Sentiment Index (Dec)--
F: --
P: --
Euro Zone Trade Balance (Not SA) (Oct)--
F: --
P: --
Euro Zone ZEW Current Conditions Index (Dec)--
F: --
P: --
Euro Zone Trade Balance (SA) (Oct)--
F: --
P: --
U.S. Retail Sales MoM (Excl. Gas Stations & Vehicle Dealers) (SA) (Oct)--
F: --
P: --
U.S. Retail Sales MoM (Excl. Automobile) (SA) (Oct)--
F: --
P: --

No matching data
Latest Views
Latest Views
Trending Topics
Top Columnists
Latest Update
White Label
Data API
Web Plug-ins
Affiliate Program
View All
No data
Trading on 12 December was overshadowed by a sharp decline in the S&P 500 (US SPX 500 mini on FXOpen), with the session low approaching December's previous trough.
Trading on 12 December was overshadowed by a sharp decline in the S&P 500 (US SPX 500 mini on FXOpen), with the session low approaching December's previous trough.
Among the key fundamental drivers behind Friday's drop was the market reaction to Broadcom's quarterly report. Shares (AVGO) plunged more than 10%, possibly as investors aggressively took profits in tech stocks, concerned that the AI hype may be overheated.
A review of the 4-hour chart of the S&P 500 (US SPX 500 mini on FXOpen) suggests that Friday's negative sentiment may have begun to ease, as the index is now recovering. Overall, this presents an interesting picture from a price-action perspective.
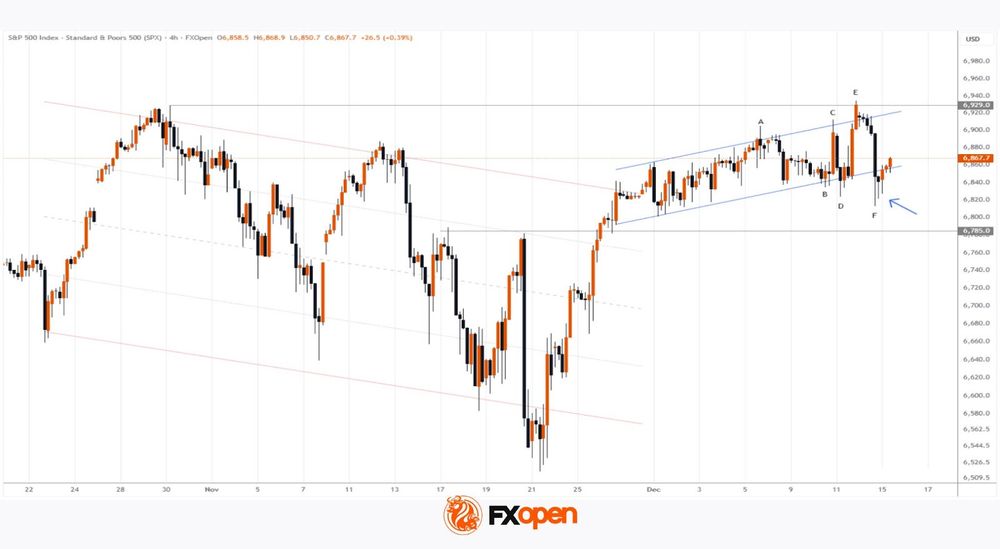
Five days ago, we noted that an ascending channel had formed in early December, which could be interpreted as cautious optimism ahead of key news.
However, Fed-related announcements triggered a surge in volatility (as we described, "the calm before the storm"), pushing prices beyond both boundaries of the blue channel:
→ The failure to hold above the upper boundary can be seen as bulls lacking confidence to challenge the all-time high. The false break around 6929 looks like a trader trap.
→ Conversely, bears may have been unable to suppress buying near Friday's low, as indicated by the long lower wicks on the candles (highlighted by the arrow).
The chart now shows a complex Megaphone pattern (marked A–F).
It is possible that the coming week will be characterised by consolidation following Wednesday–Friday's swings, with market sentiment increasingly influenced by the approaching holiday period.
The Federal Reserve's policymakers were far from unanimous in voting for last week's quarter-point cut in interest rates — and that's a good thing. The economic outlook is unusually uncertain, and the risks pull the central bank in opposing directions. Disagreement under such circumstances is healthy. Before much longer, it might be essential.
Despite the economic fog, investors had firmly priced in a third cut in the space of three months, to a range of 3.5% to 3.75%. This was mainly because the Fed had encouraged them to take one for granted. Such certitude is unhelpful amid so many conflicting economic signals: persistent above-target inflation, continuing confusion over the administration's tariffs, missing data (thanks to the government shutdown), an exuberant stock market and signs that the labor market is softening.
Reflecting this reality, three voting members of the Federal Open Market Committee dissented, one of them calling for a bigger cut and two for no change. Four nonvoting officials also registered "soft dissents," stating their preference to leave the rate where it was.
Fed Chair Jerome Powell says the new policy rate is now broadly neutral, meaning that it neither adds to nor subtracts from demand in the economy. In fact, this "neutral" rate is also uncertain. (According to the Fed's new summary of economic projections, officials put it anywhere from 2.5% to 4%.)
With inflation still above target, aiming to keep policy "slightly restrictive" probably would've made more sense. Still, the truth is that this further quarter-point tweak was, in itself, neither here nor there. What matters as new information arrives is that the central bank keeps, and is understood to keep, an open mind. Unconcealed disagreement among policymakers helps serve this purpose.
To be fair, the Fed has been admirably clear about one thing: With just a single main instrument of macroeconomic policy, it cannot hit two targets pulling in opposite directions. Thanks mainly to tariffs, there's an upside risk to inflation. Meanwhile, sluggish hiring signals a downside risk to jobs, and there are fears that official statistics are understating the problem.
These signs of possible stagflation put the central bank in a tough spot. Its dual mandate of stable prices and maximum employment requires it to judge which risk is greater — and right now, there's no clear answer.
From here on, its predicament will get worse. Powell's term as chair ends in May, and investors are increasingly preoccupied with who will succeed him. The White House has given them every reason to fear that the next leader of the central bank will be chosen based on loyalty and a willingness to cut rates sharply regardless of incoming data. That, in turn, might finally unanchor inflation expectations, raising longer-term interest rates and destabilizing financial markets.
It's to be hoped that whoever is chosen understands this risk and, once appointed, puts the public interest ahead of White House dictates. It will help if the Fed's other policymakers make a habit of openly dissenting from the chair's position when they disagree on the merits. The notion that apparent consensus enhances the central bank's credibility was always flawed. In the next stage of the Fed's evolution, it might be dangerous.

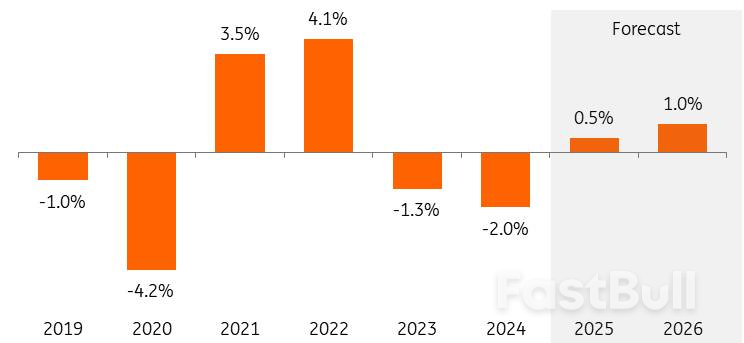
We've seen a notable pick-up in Dutch manufacturing production since August this year. In October, production was significantly higher for the third consecutive month than it was for 11 months prior.
The technology industry has played an important part in the recent growth. In both machinery production and in that of electrical appliances and means of transport, we're seeing a clear recovery emerging after a period of stagnation. Like their counterparts in the eurozone, Dutch manufacturers have become somewhat more optimistic about the near future since the summer.
Now that the unrest around trade tariffs is also easing, production could increase further from +0.5% in 2025 to +1.0% in 2026. Still, many factors continue to slow down growth, such as export restrictions and import tariffs, stiff competition from China and structural factors like grid congestion, nitrogen emission limitations and relatively high energy costs.
Volume growth of output of Dutch manufacturing
Increasing consumer spending and additional government investment, in particular, will lead to more manufacturing orders in 2026. Although production expectations have improved and manufacturers have been receiving more new orders for some time, producers have become only slightly more positive about their order books in recent months. Getting the pipeline of customer orders well-filled again is a process that takes time.
It also takes a while for investments in defence, for example, to translate substantially into more orders and production. Expanding production takes time due to staff shortages and the required construction or conversion of factories. In turn, it isn't surprising that progress in producer confidence and the purchasing managers' index is currently stalling around the long-term average. Like the slight improvement in the orders-to-stocks ratio, sentiment indices do not yet point to substantial growth.
Industrial producers' assessment of order books and stocks of finished products*
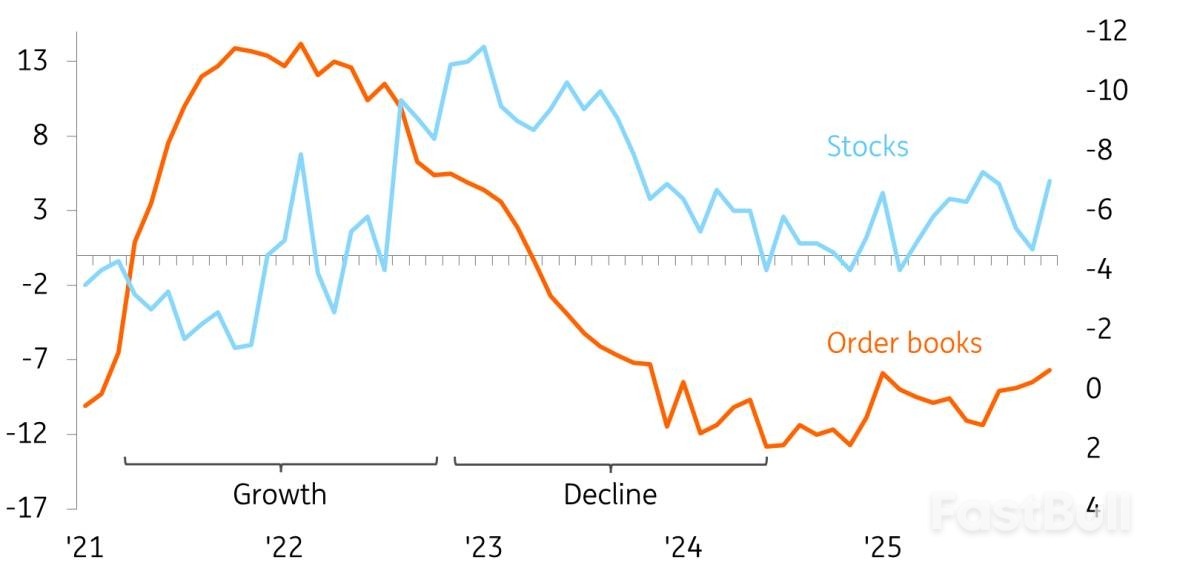 *balance of positive-negative judgments; 2-month moving average, inventory judgment inverted (r.h.axis) Source: Statistics Netherlands, ING Research
The gradually increasing global demand for chip machines is yet another growth driver for Dutch manufacturing. The growth of chipmakers and equipment manufacturers remained under pressure in 2025 due to a slower-than-expected normalisation of customer inventories. While semiconductor company ASML continues to keep a close eye on this, ASM and Besi are seeing order growth recover and are optimistic about 2026.
Investors are also anticipating increasing chip machine demand in 2026. The artificial intelligence boom requires additional chips for data centres, for example, which is creating a growing need for production capacity among semiconductor producers. Demand for chips for applications other than AI, such as consumer electronics, automotive and industrial applications, is also improving.
The uncertainty surrounding the size and impact of US President Donald Trump's import tariffs has caused consumers and businesses to spend only reluctantly. As uncertainties are eased by recent trade deals, the outlook for consumption and investment is improving. Nevertheless, the uniform tariff on EU exports to the US – previously an important growth market for Dutch industry – still remains at 15%. Together with the cooling of the US economy, this will dampen export growth in 2026. The 50% rate on European products and parts made of steel and aluminium is still in place. In fact, the US is bringing more and more products with steel and aluminium parts below the high 50% tariff.
Headwinds and uncertainty also remain due to trade restrictions stemming from increasing technological rivalry with and resource dependence on China. Government policy has an increasingly large and unpredictable influence on market conditions.
Think of the intervention in Nexperia's business operations and the subsequent export restrictions of essential automotive chips by China. The restrictions on the export of advanced chip machines to China also directly affect Dutch makers and suppliers. At the same time, the persistently expensive euro against the dollar and rising competition from China, which has intensified since Trump's tariffs, are directly – and, through lower exports, indirectly – at the expense of the demand for Dutch products.
Low demand, high energy costs and cheap imports continue to hurt chemicals and base metals
Companies in the chemical and base metal sectors, in particular, will continue to face three persistent bottlenecks in 2026:
The relatively large number of eight large chemical plants (or parts thereof) that have been closed in the Netherlands this year will also have a negative impact on growth in the coming years, as part of the production (capacity) has been taken out of the market.
In that light, the current downward trend in energy prices is encouraging, but not immediately sufficient for renewed growth. This is also expected to continue in 2026, mainly due to increasing global LNG production capacity (especially in the United States and Qatar), and the gas market will structurally expand. This reduces the chance of extreme price peaks and supply problems. The high transport and processing costs of LNG do ensure that energy in Europe remains relatively expensive. LNG imports will continue to be needed for years to meet energy needs.
In addition to the increasing demand for chip machines, higher government spending on defence is also gradually increasing product demand. For example, for radars from Thales, frigates from Damen Naval and submarine parts from IHC. The €800 billion from the European Commission's ReArm-Europe programme and the new NATO standard of 3.5% of GDP will consolidate long-term investments.
An increasing amount of unused capacity is now being used for defence purposes, such as VDL's old Nedcar factory. Drone manufacturing is a fast-growing branch in which the Netherlands excels, previously for civilian purposes. More and more "dual-use companies" are responding to the new growth market by developing new military resources based on existing civilian applications.
Production growth in the food industry is set to pause in 2026 after a strong increase in 2025. Based on figures from Statistics Netherlands up to and including September, we assume production growth of at least 3% for 2025. This is partly pent-up demand after several lean years; foreign turnover is also currently growing considerably faster than domestic turnover.
In terms of production levels, the sector will come close to 2018's peak. The fact that the expected growth will fall in 2026 is mainly due to supply constraints and limited room for expansion investments. The impact of the shrinking livestock herd on the dairy and meat processing industry plays a major role in this. Still, consumer demand is developing positively, and that provides a counterbalance.
The USDCAD pair continues to decline amid positive macroeconomic data from Canada. The current quote stands at 1.3763. Details — in our analysis for 15 December 2025.
The USDCAD pair is correcting but remains under selling pressure. Investors' attention is still focused on the geopolitical environment, which continues to generate heightened volatility in commodity and currency markets.
Macroeconomic data from Canada present a mixed picture. In October 2025, wholesale trade volumes rose by 0.1% month-over-month to CAD 86.0 billion, while the market had expected a decline of 0.1%. Additional support for domestic demand came from the construction sector. In October 2025, the value of building permits issued surged by 14.9% compared to the previous month, reaching CAD 13.8 billion — the fastest pace of growth since June 2024.
Positive signals from individual sectors of the Canadian economy are increasing pressure on USDCAD, strengthening the Canadian dollar and keeping the short-term outlook for USDCAD bearish.
The USDCAD pair is consolidating below the EMA-65, confirming persistent bearish pressure. The price structure points to the formation of a Triangle pattern with a projected target near 1.3680. The USDCAD outlook for today suggests a continuation of the decline, with the nearest target at 1.3690.
An additional signal in favor of the bearish scenario is provided by the Stochastic Oscillator: the signal lines are bouncing off the descending trend line, indicating that bearish momentum remains intact.
A firm consolidation below the 1.3745 level will confirm the downside scenario and signal a breakout below the lower boundary of the Triangle pattern.
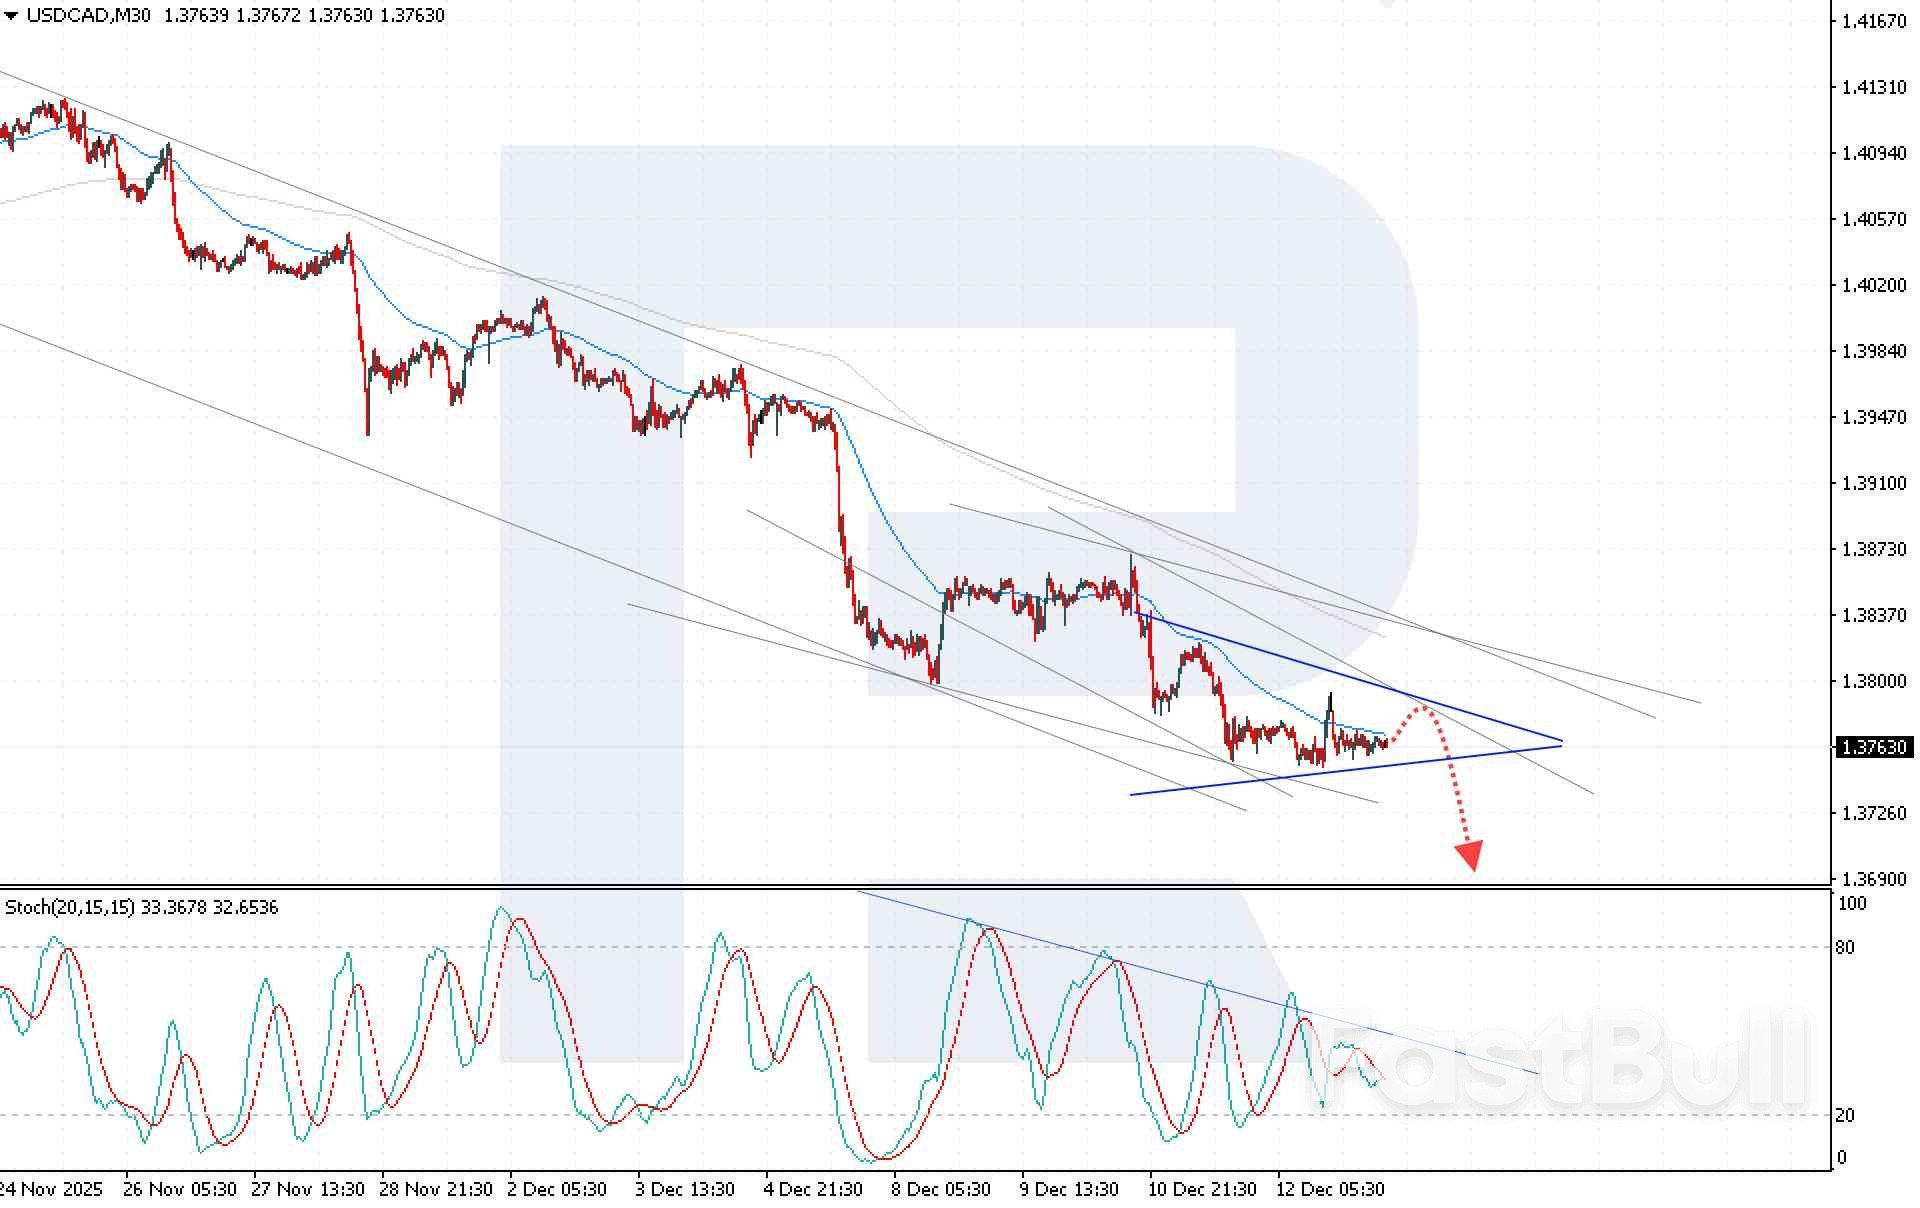

Short-term USDCAD dynamics remain under pressure. Technical analysis of USDCAD points to a continuation of the bearish move with a target at 1.3680, provided that the price holds below the 1.3745 level.
728 RM B 7/F GEE LOK IND BLDG NO 34 HUNG TO RD KWUN TONG KLN HONG KONG


White Label
Data API
Web Plug-ins
Poster Maker
Affiliate Program
The risk of loss in trading financial instruments such as stocks, FX, commodities, futures, bonds, ETFs and crypto can be substantial. You may sustain a total loss of the funds that you deposit with your broker. Therefore, you should carefully consider whether such trading is suitable for you in light of your circumstances and financial resources.
No decision to invest should be made without thoroughly conducting due diligence by yourself or consulting with your financial advisors. Our web content might not suit you since we don't know your financial conditions and investment needs. Our financial information might have latency or contain inaccuracy, so you should be fully responsible for any of your trading and investment decisions. The company will not be responsible for your capital loss.
Without getting permission from the website, you are not allowed to copy the website's graphics, texts, or trademarks. Intellectual property rights in the content or data incorporated into this website belong to its providers and exchange merchants.
Not Logged In
Log in to access more features

FastBull Membership
Not yet
Purchase


Log In
Sign Up


