• Trade
  • Markets
  • Copy
  • Contests
  • News
  • 24/7
  • Calendar
  • Q&A
  • Chats
Trending
Screeners
SYMBOL
LAST
BID
ASK
HIGH
LOW
NET CHG.
%CHG.
SPREAD
SPX
S&P 500 Index
6813.33
6813.33
6813.33
6861.30
6801.50
-14.08
-0.21%
--
DJI
Dow Jones Industrial Average
48394.77
48394.77
48394.77
48679.14
48317.93
-63.27
-0.13%
--
IXIC
NASDAQ Composite Index
23064.49
23064.49
23064.49
23345.56
23012.00
-130.67
-0.56%
--
USDX
US Dollar Index
97.810
97.890
97.810
98.070
97.740
-0.140
-0.14%
--
EURUSD
Euro / US Dollar
1.17590
1.17599
1.17590
1.17686
1.17262
+0.00196
+ 0.17%
--
GBPUSD
Pound Sterling / US Dollar
1.33928
1.33936
1.33928
1.34014
1.33546
+0.00221
+ 0.17%
--
XAUUSD
Gold / US Dollar
4319.72
4320.15
4319.72
4350.16
4294.68
+20.33
+ 0.47%
--
WTI
Light Sweet Crude Oil
56.628
56.658
56.628
57.601
56.625
-0.605
-1.06%
--

Community Accounts

Signal Accounts
--
Profit Accounts
--
Loss Accounts
--
View More

Become a signal provider

Sell trading signals to earn additional income

View More

Guide to Copy Trading

Get started with ease and confidence

View More

Signal Accounts for Members

All Signal Accounts

Best Return
  • Best Return
  • Best P/L
  • Best MDD
Past 1W
  • Past 1W
  • Past 1M
  • Past 1Y

All Contests

  • All
  • Trump Updates
  • Recommend
  • Stocks
  • Cryptocurrencies
  • Central Banks
  • Featured News
Top News Only
Share

The Offshore Yuan Broke Through 7.04 Against The US Dollar

Share

Fbi Director: A Fifth Individual Believed To Be Planning A Separate Attack Arrested By Fbi New Orleans

Share

New York Fed President Williams: The 2% Inflation Target Must Be Achieved Without Impacting The Job Market

Share

New York Fed President Williams: Monetary Policy Very Focused On Balancing Job, Inflation Risks

Share

New York Fed President Williams Expects USA Unemployment To Be 4.5% By End Of 2025

Share

New York Fed President Williams: Labor Market Risks Have Risen As Risks To Inflation Have Eased

Share

New York Fed President Williams Expects Inflation To Move To 2.5% In 2026, 2% In 2027

Share

New York Fed President Williams Sees Tariffs As A One-Off Price Adjustment, Not Spilling Over Into Broader Inflation

Share

New York Fed President Williams: Labor Market Cooling Has Been Gradual Process

Share

New York Fed President Williams Expects Active Usage Of Standing Repo Facility To Manage Liquidity

Share

New York Fed President Williams: Critical For USA Central Bank To Get Inflation Back To 2%

Share

New York Fed President Williams Expects 2026 GDP Growth To Hit 2.25%, Well Above 2025 Rate

Share

New York Fed President Williams Projects Jobless Rate Will Come Back Down Over Next Few Years

Share

New York Fed President Williams: Fed Policy Has Moved Toward Neutral From Modestly Restrictive

Share

Federal Reserve Governor Milan: I Would Be Happy To Vote For The Re-election Of Regional Fed Presidents

Share

Miran: What Is Most Surprising Is How Nice And Collegial The Fed Has Been

Share

Miran: The Least Attractive Part Of Being At The Fed Is Having Only 1 Of 12 Votes On A Committee

Share

White House To Host Press Call On Russia-Ukraine Peace Talks

Share

Miran: Was Delighted To Vote In Favor Of Reappointing Current Reserve Bank Presidents, Think They Are Doing A Good Job

Share

Miran: The Reserve Banks Play A Valuable Role In Providing Local Perspectives And Contacts

TIME
ACT
FCST
PREV
Japan Tankan Small Manufacturing Outlook Index (Q4)

A:--

F: --

P: --

Japan Tankan Large Non-Manufacturing Outlook Index (Q4)

A:--

F: --

P: --

Japan Tankan Large Manufacturing Outlook Index (Q4)

A:--

F: --

P: --

Japan Tankan Small Manufacturing Diffusion Index (Q4)

A:--

F: --

P: --

Japan Tankan Large-Enterprise Capital Expenditure YoY (Q4)

A:--

F: --

P: --

U.K. Rightmove House Price Index YoY (Dec)

A:--

F: --

P: --

China, Mainland Industrial Output YoY (YTD) (Nov)

A:--

F: --

P: --

China, Mainland Urban Area Unemployment Rate (Nov)

A:--

F: --

P: --

Saudi Arabia CPI YoY (Nov)

A:--

F: --

P: --

Euro Zone Industrial Output YoY (Oct)

A:--

F: --

P: --

Euro Zone Industrial Output MoM (Oct)

A:--

F: --

P: --

Canada Existing Home Sales MoM (Nov)

A:--

F: --

P: --

Canada National Economic Confidence Index

A:--

F: --

P: --

Canada New Housing Starts (Nov)

A:--

F: --

P: --
U.S. NY Fed Manufacturing Employment Index (Dec)

A:--

F: --

P: --

U.S. NY Fed Manufacturing Index (Dec)

A:--

F: --

P: --

Canada Core CPI YoY (Nov)

A:--

F: --

P: --

Canada Manufacturing Unfilled Orders MoM (Oct)

A:--

F: --

P: --

U.S. NY Fed Manufacturing Prices Received Index (Dec)

A:--

F: --

P: --

U.S. NY Fed Manufacturing New Orders Index (Dec)

A:--

F: --

P: --

Canada Manufacturing New Orders MoM (Oct)

A:--

F: --

P: --

Canada Core CPI MoM (Nov)

A:--

F: --

P: --

Canada Trimmed CPI YoY (SA) (Nov)

A:--

F: --

P: --

Canada Manufacturing Inventory MoM (Oct)

A:--

F: --

P: --

Canada CPI YoY (Nov)

A:--

F: --

P: --

Canada CPI MoM (Nov)

A:--

F: --

P: --

Canada CPI YoY (SA) (Nov)

A:--

F: --

P: --

Canada Core CPI MoM (SA) (Nov)

A:--

F: --

P: --

Canada CPI MoM (SA) (Nov)

A:--

F: --

P: --

Federal Reserve Board Governor Milan delivered a speech
U.S. NAHB Housing Market Index (Dec)

A:--

F: --

P: --

Australia Composite PMI Prelim (Dec)

--

F: --

P: --

Australia Services PMI Prelim (Dec)

--

F: --

P: --

Australia Manufacturing PMI Prelim (Dec)

--

F: --

P: --

Japan Manufacturing PMI Prelim (SA) (Dec)

--

F: --

P: --

U.K. 3-Month ILO Employment Change (Oct)

--

F: --

P: --

U.K. Unemployment Claimant Count (Nov)

--

F: --

P: --

U.K. Unemployment Rate (Nov)

--

F: --

P: --

U.K. 3-Month ILO Unemployment Rate (Oct)

--

F: --

P: --

U.K. Average Weekly Earnings (3-Month Average, Including Bonuses) YoY (Oct)

--

F: --

P: --

U.K. Average Weekly Earnings (3-Month Average, Excluding Bonuses) YoY (Oct)

--

F: --

P: --

France Services PMI Prelim (Dec)

--

F: --

P: --

France Composite PMI Prelim (SA) (Dec)

--

F: --

P: --

France Manufacturing PMI Prelim (Dec)

--

F: --

P: --

Germany Services PMI Prelim (SA) (Dec)

--

F: --

P: --

Germany Manufacturing PMI Prelim (SA) (Dec)

--

F: --

P: --

Germany Composite PMI Prelim (SA) (Dec)

--

F: --

P: --

Euro Zone Composite PMI Prelim (SA) (Dec)

--

F: --

P: --

Euro Zone Services PMI Prelim (SA) (Dec)

--

F: --

P: --

Euro Zone Manufacturing PMI Prelim (SA) (Dec)

--

F: --

P: --

U.K. Services PMI Prelim (Dec)

--

F: --

P: --

U.K. Manufacturing PMI Prelim (Dec)

--

F: --

P: --

U.K. Composite PMI Prelim (Dec)

--

F: --

P: --

Euro Zone ZEW Economic Sentiment Index (Dec)

--

F: --

P: --

Germany ZEW Current Conditions Index (Dec)

--

F: --

P: --

Germany ZEW Economic Sentiment Index (Dec)

--

F: --

P: --

Euro Zone Trade Balance (Not SA) (Oct)

--

F: --

P: --

Euro Zone ZEW Current Conditions Index (Dec)

--

F: --

P: --

Euro Zone Trade Balance (SA) (Oct)

--

F: --

P: --

U.S. Retail Sales MoM (Excl. Gas Stations & Vehicle Dealers) (SA) (Oct)

--

F: --

P: --

U.S. Retail Sales MoM (Excl. Automobile) (SA) (Oct)

--

F: --

P: --

Q&A with Experts
    • All
    • Chatrooms
    • Groups
    • Friends
    Connecting
    .
    .
    .
    Type here...
    Add Symbol or Code

      No matching data

      All
      Trump Updates
      Recommend
      Stocks
      Cryptocurrencies
      Central Banks
      Featured News
      • All
      • Russia-Ukraine Conflict
      • Middle East Flashpoint
      • All
      • Russia-Ukraine Conflict
      • Middle East Flashpoint
      Search
      Products

      Charts Free Forever

      Chats Q&A with Experts
      Screeners Economic Calendar Data Tools
      Membership Features
      Data Warehouse Market Trends Institutional Data Policy Rates Macro

      Market Trends

      Market Sentiment Order Book Forex Correlations

      Top Indicators

      Charts Free Forever
      Markets

      News

      News Analysis 24/7 Columns Education
      From Institutions From Analysts
      Topics Columnists

      Latest Views

      Latest Views

      Trending Topics

      Top Columnists

      Latest Update

      Signals

      Copy Rankings Latest Signals Become a signal provider AI Rating
      Contests
      Brokers

      Overview Brokers Assessment Rankings Regulators News Claims
      Broker listing Forex Brokers Comparison Tool Live Spread Comparison Scam
      Q&A Complaint Scam Alert Videos Tips to Detect Scam
      More

      Business
      Events
      Careers About Us Advertising Help Center

      White Label

      Data API

      Web Plug-ins

      Affiliate Program

      Awards Institution Evaluation IB Seminar Salon Event Exhibition
      Vietnam Thailand Singapore Dubai
      Fans Party Investment Sharing Session
      FastBull Summit BrokersView Expo
      Recent Searches
        Top Searches
          Markets
          News
          Analysis
          User
          24/7
          Economic Calendar
          Education
          Data
          • Names
          • Latest
          • Prev

          View All

          No data

          Scan to Download

          Faster Charts, Chat Faster!

          Download App
          English
          • English
          • Español
          • العربية
          • Bahasa Indonesia
          • Bahasa Melayu
          • Tiếng Việt
          • ภาษาไทย
          • Français
          • Italiano
          • Türkçe
          • Русский язык
          • 简中
          • 繁中
          Open Account
          Search
          Products
          Charts Free Forever
          Markets
          News
          Signals

          Copy Rankings Latest Signals Become a signal provider AI Rating
          Contests
          Brokers

          Overview Brokers Assessment Rankings Regulators News Claims
          Broker listing Forex Brokers Comparison Tool Live Spread Comparison Scam
          Q&A Complaint Scam Alert Videos Tips to Detect Scam
          More

          Business
          Events
          Careers About Us Advertising Help Center

          White Label

          Data API

          Web Plug-ins

          Affiliate Program

          Awards Institution Evaluation IB Seminar Salon Event Exhibition
          Vietnam Thailand Singapore Dubai
          Fans Party Investment Sharing Session
          FastBull Summit BrokersView Expo

          Short-term USDCAD Dynamics Remain Bearish

          Blue River

          Forex

          Technical Analysis

          Summary:

          The USDCAD pair continues to decline amid positive macroeconomic data from Canada. The current quote stands at 1.3763. Details — in our analysis for 15 December 2025.

          The USDCAD pair continues to decline amid positive macroeconomic data from Canada. The current quote stands at 1.3763. Details — in our analysis for 15 December 2025.

          USDCAD forecast: key trading points

          • In October 2025, Canada's wholesale trade volume increased by 0.1% month-over-month
          • Growth in building permits in Canada in October 2025 was the fastest since June 2024
          • Positive signals from individual sectors of the Canadian economy increase pressure on USDCAD
          • USDCAD forecast for 15 December 2025: 1.3690

          Fundamental analysis

          The USDCAD pair is correcting but remains under selling pressure. Investors' attention is still focused on the geopolitical environment, which continues to generate heightened volatility in commodity and currency markets.

          Macroeconomic data from Canada present a mixed picture. In October 2025, wholesale trade volumes rose by 0.1% month-over-month to CAD 86.0 billion, while the market had expected a decline of 0.1%. Additional support for domestic demand came from the construction sector. In October 2025, the value of building permits issued surged by 14.9% compared to the previous month, reaching CAD 13.8 billion — the fastest pace of growth since June 2024.

          Positive signals from individual sectors of the Canadian economy are increasing pressure on USDCAD, strengthening the Canadian dollar and keeping the short-term outlook for USDCAD bearish.

          USDCAD technical analysis

          The USDCAD pair is consolidating below the EMA-65, confirming persistent bearish pressure. The price structure points to the formation of a Triangle pattern with a projected target near 1.3680. The USDCAD outlook for today suggests a continuation of the decline, with the nearest target at 1.3690.

          An additional signal in favor of the bearish scenario is provided by the Stochastic Oscillator: the signal lines are bouncing off the descending trend line, indicating that bearish momentum remains intact.

          A firm consolidation below the 1.3745 level will confirm the downside scenario and signal a breakout below the lower boundary of the Triangle pattern.

          Summary

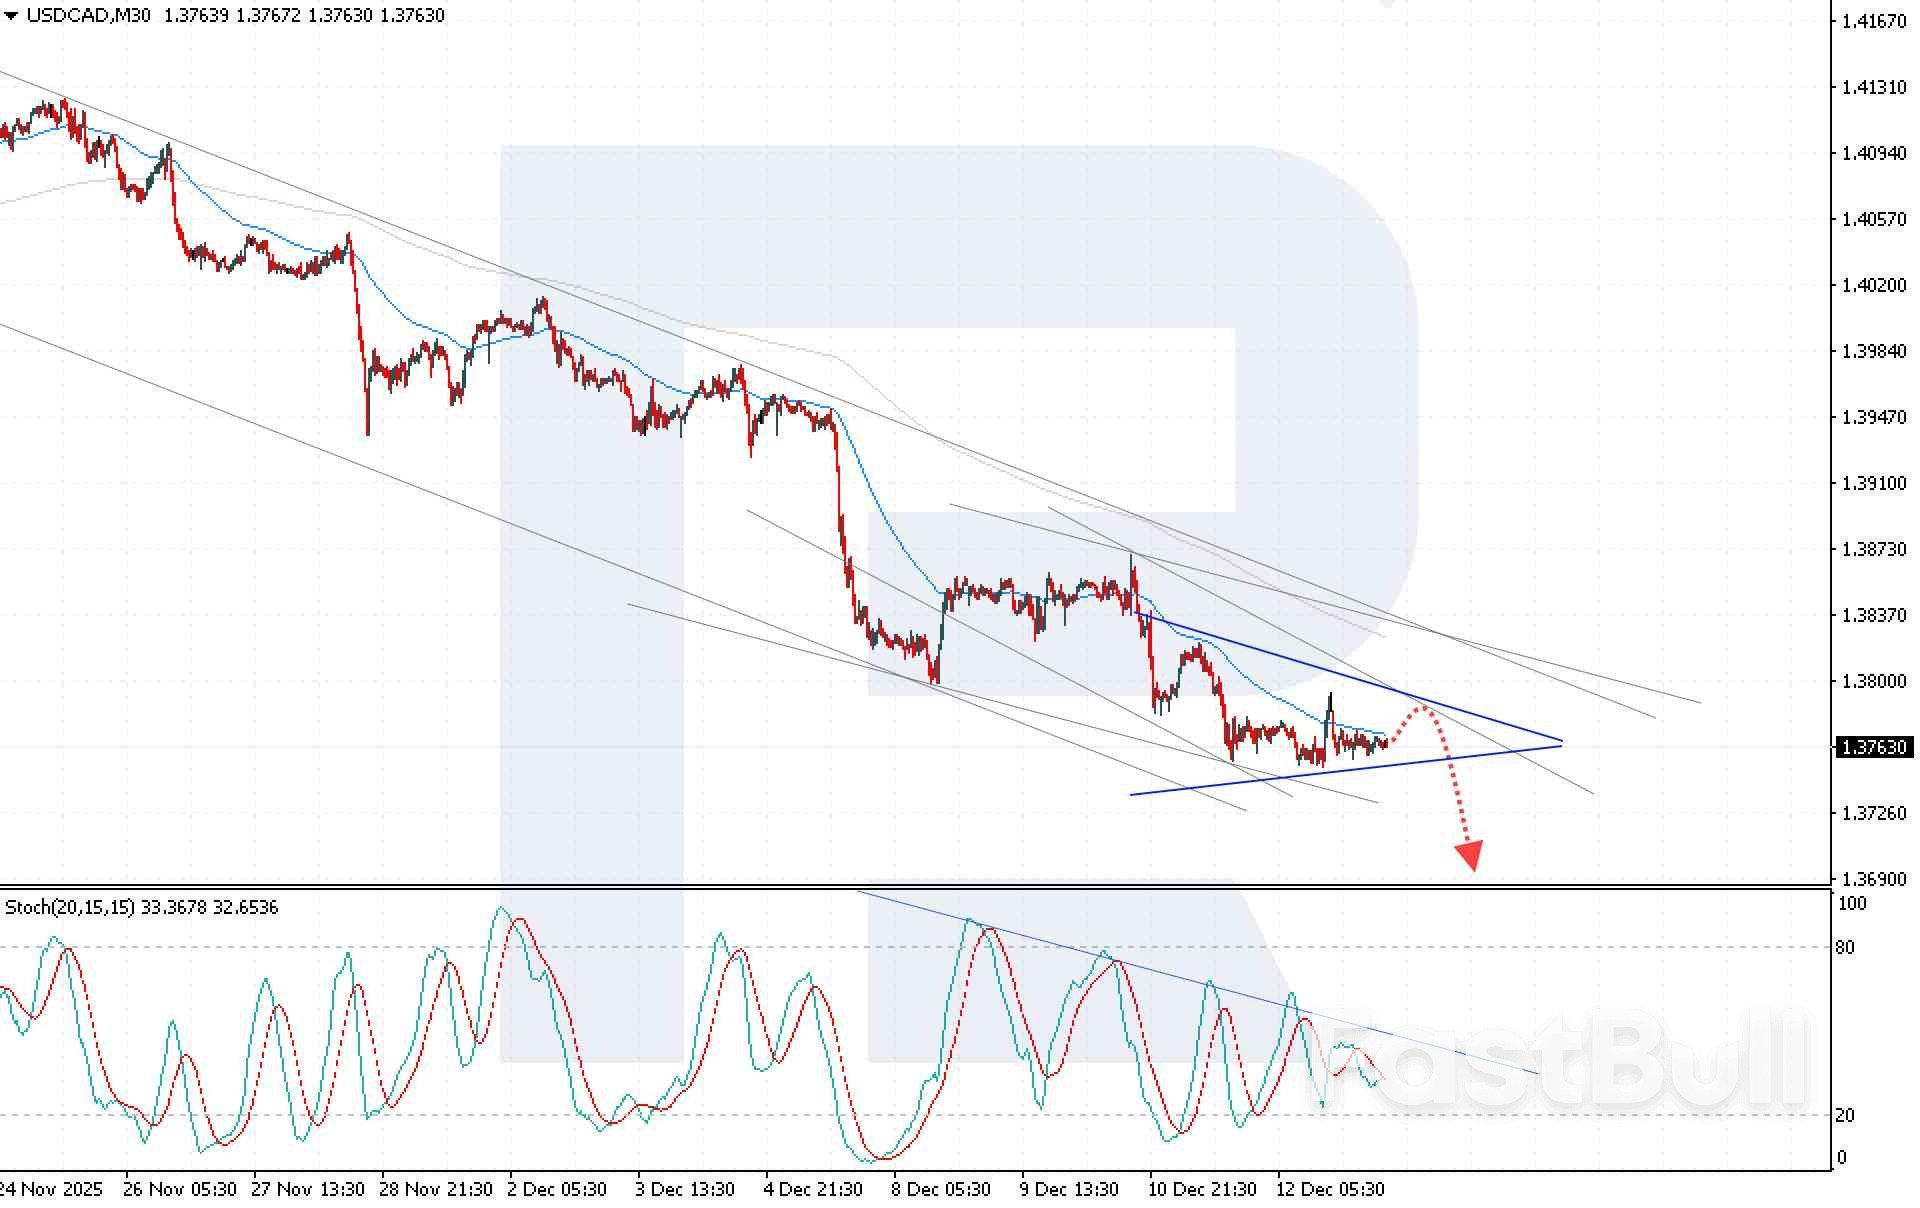
          Short-term USDCAD dynamics remain under pressure. Technical analysis of USDCAD points to a continuation of the bearish move with a target at 1.3680, provided that the price holds below the 1.3745 level.

          Source: RoboForex

          Risk Warnings and Disclaimers
          You understand and acknowledge that there is a high degree of risk involved in trading. Following any strategies or investment methods may lead to potential losses. The content on the site is provided by our contributors and analysts for information purposes only. You are solely responsible for determining whether any trading assets, securities, strategy, or any other product is suitable for investing based on your own investment objectives and financial situation.
          Add to Favorites
          Share

          Emerging Markets Surge as Currency Volatility Redraws Global FX Landscape

          Gerik

          Economic

          Forint Leads EM Currency Boom as Dollar Declines

          In a year marked by geopolitical disruption and diverging global monetary policies, 2025 has seen a striking resurgence in emerging market (EM) currencies. The Hungarian forint has strengthened nearly 20% against the U.S. dollar, placing it among the best-performing EM currencies in over two decades. This reflects a broader rally across the space, as evidenced by the MSCI Emerging Market Currency Index, which hit a record high in July and is on track for its strongest annual return since 2017 with a gain exceeding 6%.
          This EM currency surge is not viewed as an anomaly by market participants. Analysts, fund managers, and strategists widely interpret this as the early stage of a new cycle one in which emerging currencies reclaim relevance after years of underperformance. According to Jonny Goulden of JPMorgan, the tide is turning after a 14-year bear market for EM currencies, driven by a weakening U.S. dollar and a global portfolio rebalancing away from dollar-dominated assets.

          Dollar Weakness and Developed Market Volatility Shift Capital Flows

          A key catalyst for this trend has been the dollar's retreat. As developed economies navigate divergent policy paths and increased domestic volatility, investors are increasingly scrutinizing long-held assumptions about the greenback’s dominance. The weakening dollar has reawakened interest in EM assets, particularly currencies backed by stable macro fundamentals or central banks that remain hawkish relative to peers.
          Surprisingly, much of the volatility in 2025 has originated not in developing markets but in the developed world. Elina Theodorakopoulou of Manulife observed that emerging markets were not the primary source of FX turbulence this year. Instead, shocks such as the U.S. “Liberation Day” tariffs, shifting trade alliances, and interest rate divergence among G10 central banks have created fertile ground for EM outperformance.

          Carry Trades Reemerge as Currency Markets Stabilize

          As short-term volatility has eased from its April peak when developed market currency swings hit a two-year high carry trades have reentered the spotlight. Traders have increasingly borrowed in low-yielding currencies to invest in high-yielding EM instruments, benefiting from the wider interest rate differentials and renewed stability in the FX landscape. Systematic hedge funds and bank FX desks have been among the largest beneficiaries of these shifts, reaping profits on well-timed directional bets.
          The scale of this transformation is underscored by the latest Bank for International Settlements data, which shows global FX trading volumes rising nearly 30% over the past three years. This structural growth has enhanced liquidity but also raised systemic concerns due to the concentration of trading among a small number of major banks.

          IMF Flags Structural Risks Amid Surging Volumes

          While investors capitalize on the newfound dynamism in EM currencies, the International Monetary Fund has issued cautionary warnings. In its recent financial stability report, the IMF pointed to rising risk in currency markets, particularly due to the concentration of FX flows among a few large institutions. Should these banks withdraw during times of stress, liquidity could dry up rapidly, intensifying volatility and disrupting capital flows to and from vulnerable economies.
          Governments, too, are navigating a delicate balance. On one hand, stronger currencies improve their ability to service external debt and attract foreign investment. On the other hand, sharp appreciation can dampen export competitiveness and stifle manufacturing-led recoveries, particularly in smaller, trade-dependent economies.

          From Margins to Mainstream EM Currencies Regain Global Prominence

          As 2025 draws to a close, EM currencies have reasserted themselves at the center of global FX markets. The narrative has shifted from fragility to opportunity, driven by structural changes in global capital allocation, declining dollar dominance, and newfound resilience across many developing economies.
          While risks remain from concentration in FX intermediaries to geopolitical unpredictability the trajectory suggests a sustained recalibration. As hedge funds and institutional investors continue to reposition, and carry trades gain momentum, emerging markets may no longer be the periphery of global finance, but a central pillar of the next currency cycle.

          Source: Reuters

          To stay updated on all economic events of today, please check out our Economic calendar
          Risk Warnings and Disclaimers
          You understand and acknowledge that there is a high degree of risk involved in trading. Following any strategies or investment methods may lead to potential losses. The content on the site is provided by our contributors and analysts for information purposes only. You are solely responsible for determining whether any trading assets, securities, strategy, or any other product is suitable for investing based on your own investment objectives and financial situation.
          Add to Favorites
          Share

          European Markets Open Higher Ahead of Pivotal Central Bank Decisions

          Gerik

          Economic

          Stocks

          European Equities Advance as Markets Eye Policy Clarity

          European stock markets kicked off a high-stakes week with modest gains across major indices. The pan-European Stoxx 600 rose 0.38% in early trading on Monday, signaling broad optimism as investors turned their focus to a series of key central bank meetings. National benchmarks followed suit, with the FTSE 100 gaining 0.43%, Germany’s DAX up 0.44%, France’s CAC 40 climbing 0.30%, and Italy’s FTSE MIB rising by 0.63%.
          These advances reflect investor confidence heading into the final European Central Bank (ECB) meeting of the year, where policymakers are expected to keep interest rates unchanged at 2%. The anticipation of stable rates paired with potentially upgraded growth forecasts has provided a constructive backdrop for European equities to extend their gains.

          Central Banks Take Center Stage as 2025 Winds Down

          This week represents a critical juncture in Europe’s monetary policy trajectory, with several central banks the ECB, Bank of England, Sweden’s Riksbank, and Norway’s Norges Bank set to announce their final decisions of the year. While the ECB is broadly expected to hold rates steady, the Bank of England may opt for a small rate cut, reflecting diverging inflationary pressures and domestic growth conditions.
          ECB President Christine Lagarde recently hinted at an upward revision to the eurozone’s GDP outlook for 2026, following a September upgrade to 1.2%. This reinforces a narrative of cautious optimism among European policymakers, even as geopolitical and macroeconomic risks remain in the background.
          UK and eurozone inflation data due Wednesday could further guide investor expectations. A downside surprise in these figures might reinforce the case for policy easing in early 2026, while stickier inflation may prompt central banks to maintain a more hawkish posture heading into the new year.

          Geopolitical Stakes Rise Amid Ukraine Funding Talks

          Beyond monetary policy, European leaders will face mounting geopolitical pressure this week as they convene in Brussels to discuss a €210 billion loan package for Ukraine. A controversial element of the proposal involves potentially reallocating frozen Russian assets to support Kyiv, a move that could carry both financial and diplomatic ramifications.
          The decision will test the EU’s ability to maintain unity in the face of prolonged conflict and fiscal fatigue. From a market perspective, a positive outcome could reinforce confidence in Europe's political cohesion, while any deadlock may revive concerns over internal fragmentation.

          Global Macro Trends Influence Sentiment

          Overnight trends from the U.S. and Asia-Pacific regions are also influencing European market behavior. Wall Street closed last week in a mixed fashion, as a broad rotation away from high-growth tech stocks into lower-valuation sectors created volatility. Futures remained flat on Sunday night, reflecting continued uncertainty ahead of a flood of delayed U.S. economic data due this week.
          Key among those reports are the nonfarm payrolls and retail sales data originally delayed by the U.S. government shutdown and the November consumer price index. These indicators will likely shape near-term expectations for the Federal Reserve’s next moves and could reverberate through global asset markets, including Europe.
          Meanwhile, Asian markets fell on Monday, echoing Wall Street’s tech-driven declines, and offering a cautionary signal to investors still bullish on global equities heading into the year-end.

          A Pivotal Week for Policy and Markets

          European markets are entering a decisive stretch, balancing between cautious optimism and lingering macro uncertainties. While the ECB is expected to maintain a steady hand, subtle shifts in tone, growth forecasts, and inflation commentary could signal the region’s 2026 policy direction. Coupled with high-stakes geopolitical decisions and global macro developments, this week’s events may set the tone for early 2026 investor behavior.
          Whether current market gains can be sustained will depend heavily on the clarity, unity, and credibility of policy announcements in the days ahead.
          To stay updated on all economic events of today, please check out our Economic calendar
          Risk Warnings and Disclaimers
          You understand and acknowledge that there is a high degree of risk involved in trading. Following any strategies or investment methods may lead to potential losses. The content on the site is provided by our contributors and analysts for information purposes only. You are solely responsible for determining whether any trading assets, securities, strategy, or any other product is suitable for investing based on your own investment objectives and financial situation.
          Add to Favorites
          Share

          Euro Zone Industry Growth Picks Up, Boosting Resilience Narrative

          Samantha Luan

          Forex

          Economic

          Blast furnaces at a ThyssenKrupp steel factory in Duisburg, Germany, November 5, 2025. REUTERS/Leon Kuegeler

          Euro zone industrial output growth accelerated in October, bolstering views that the bloc is picking up momentum as trade uncertainty is dissipating, the labour market remains tight and consumption is inching up.

          Industry expanded by 0.8% on the month after a 0.2% increase in September, in line with expectations, data from the EU's statistics agency Eurostat showed on Monday.

          Compared to a year earlier, output growth accelerated to 2.0% in October from 1.2% in September, beating expectations for 1.9% in a Reuters poll of economists.

          German industry, expanding by 1.4% on the month, was among the top performers, offsetting a 1.0% drop in Italy and lukewarm growth in France.

          The euro zone economy has proven surprisingly resilient this year, and European Central Bank President Christine Lagarde has already said that another upgrade in the growth outlook is coming this week.

          Still, expansion is far from spectacular. The bloc is only growing at a rate just above 1%, near its so-called potential, as exports, the main driver of the economy in recent decades, remain weak and the domestic sector is producing nearly all growth.

          Industrial exports have struggled for years as surging energy costs have put the bloc at a cost disadvantage just as China was expanding its high-tech industrial base, grabbing market share.

          While industry might be bottoming out this year, there is no boom in sight and it is still somewhat unclear how the new U.S. tariff regime will alter global trading patterns.

          Nevertheless the bloc appears to be adjusting well, and even if there is no boom underway, the downside risk also appears limited.

          "Incoming high-frequency indicators continue to point to positive momentum in activity heading into year-end," Barclays said in a note.

          Source: Reuters

          To stay updated on all economic events of today, please check out our Economic calendar
          Risk Warnings and Disclaimers
          You understand and acknowledge that there is a high degree of risk involved in trading. Following any strategies or investment methods may lead to potential losses. The content on the site is provided by our contributors and analysts for information purposes only. You are solely responsible for determining whether any trading assets, securities, strategy, or any other product is suitable for investing based on your own investment objectives and financial situation.
          Add to Favorites
          Share

          Fear And Greed Index in Fear 30% of The Past Year, Bitcoin Back in Extreme Fear

          Glendon

          Cryptocurrency

          Technical Analysis

          As bitcoin BTC$89.907,85 struggles to hold above $90,000, market sentiment has once again slipped into extreme fear.

          Over the past year, fear or extreme fear has accounted for more than 30% of all readings on the Crypto Fear and Greed Index. The index currently stands at 17, firmly within the extreme fear section.

          Fear has dominated sentiment since the October liquidation crash more than two months ago, as bitcoin dropped 36% from its October all-time high. While the cryptocurrency market has yet to stage a meaningful recovery. With bitcoin currently trading nearly 30% below its all-time high, investor caution remains elevated.

          A similar disconnect is occurring in U.S. equities. Sentiment currently sits at 42, which signals fear, according to the CNN Fear and Greed Index, even as the S&P 500 trades around 6,827, just a few percentage points below its all-time high.

          Across both U.S. equities and cryptocurrencies, fear continues to dominate investor psychology.

          Bitcoin entered a death cross in November, a technical pattern where the 50-day moving average falls below the 200 day moving average. In this instance, the death cross coincided with a local bottom near $80,000 on Nov. 21. Notably, every death cross during the current market cycle since 2023 has marked a significant local bottom, reinforcing its relevance as a contrarian indicator in this cycle.

          Source: CoinDesk

          Risk Warnings and Disclaimers
          You understand and acknowledge that there is a high degree of risk involved in trading. Following any strategies or investment methods may lead to potential losses. The content on the site is provided by our contributors and analysts for information purposes only. You are solely responsible for determining whether any trading assets, securities, strategy, or any other product is suitable for investing based on your own investment objectives and financial situation.
          Add to Favorites
          Share

          AI Stock Rout Pressures U.S. Markets Despite Strong Fundamentals

          Gerik

          Stocks

          Economic

          Tech-Led Sell-Off Hits Wall Street as AI Sentiment Wavers

          On Friday, major U.S. indexes retreated sharply as investor enthusiasm for artificial intelligence stocks showed fresh signs of fading. Broadcom, a central player in the AI hardware space, plunged over 11% despite delivering earnings and forward guidance that beat expectations. The downturn triggered a broader sell-off in tech names such as Nvidia, AMD, and Oracle, pulling down the S&P 500 and Nasdaq Composite by 1.07% and 1.69%, respectively.
          This week’s movement reflects a growing dissonance between company fundamentals and investor behavior, as markets increasingly question the sustainability of AI stock valuations. While financial stocks helped lift the Dow Jones by 1.1% on a weekly basis, that resilience failed to support broader indices amid tech weakness.

          Contradiction Between Fundamentals and Market Reaction

          Broadcom's earnings performance and future outlook exceeded analysts' expectations, reinforcing its position as a critical supplier in the ongoing AI infrastructure build-out. Bernstein analyst Stacy Rasgon expressed confusion over the market reaction, emphasizing the company’s accelerating AI momentum. Yet the sharp sell-off suggests a disconnect between fundamentals and valuation confidence likely fueled by fears of an AI-driven speculative bubble.
          Investor caution was not triggered by deteriorating performance but by heightened sensitivity to any signals of margin compression or overvaluation. As Oracle’s refutation of Bloomberg's report on delayed data centers indicates, even speculative headlines are enough to cause outsized market responses. Without clear catalysts to affirm AI’s long-term profitability in the near term, this sentiment-driven volatility is likely to persist.
          Global Macroeconomic Signals Add to Caution
          Contributing to the souring risk mood were fresh signs of economic weakness from China, the world’s second-largest economy. November data showed that both retail sales and industrial production slowed more than expected, with fixed asset investment also contracting. These indicators raise concerns about global demand, especially for tech hardware and semiconductors heavily linked to supply chains in Asia.
          The slowdown in China also weighed on Asia-Pacific markets early Monday, with South Korea’s KOSPI falling 1.84%, a move that echoes the weakness in U.S. tech-heavy indices. As China remains a key demand center for electronics and AI-related infrastructure, any deterioration in its macro outlook can have cascading effects on investor sentiment globally.

          Broadcom at the Center of Diverging Views

          Despite the stock decline, many analysts remain bullish on Broadcom and the broader AI theme. UBS strategists reiterated their positive outlook for 2026, driven by AI, electrification, and infrastructure investment. They argue that while current valuations are being questioned, the structural demand behind AI remains intact and will continue to benefit semiconductor and infrastructure-focused firms.
          However, near-term volatility seems inevitable. Investors are increasingly risk-averse in light of high valuations, geopolitical noise, and uncertainties around fiscal and monetary policy in the U.S. Tech stocks particularly those associated with AI may face periodic corrections as expectations reset and broader market liquidity tightens into year-end.

          Sector Rotation and the Resilience of Financials

          One notable development amid the tech downturn is the resilience of financial stocks. With expectations of stable interest rates and robust earnings, traditional banks and insurers have helped support the Dow's performance. This may indicate the beginning of a broader sector rotation away from high-growth tech and into value-oriented plays, at least temporarily.
          The divergence also reveals shifting investor priorities: from long-duration tech bets to near-term earnings stability in traditional sectors. If AI valuations remain under pressure, this rebalancing could continue into early 2026, especially if inflation data and monetary policy expectations turn more hawkish.

          Copper Rally Reflects AI’s Physical Infrastructure Needs

          While AI-linked tech stocks faltered, the physical infrastructure that supports them continues to gain value. Copper prices have soared to record highs, underpinned by increased demand from the energy transition and data center construction. The metal’s role in electrical wiring, transmission, and cooling systems positions it as a critical input in the expanding AI and clean energy ecosystem.
          Citi analysts forecast further price increases in 2026, driven by structural supply constraints and the growing role of copper in AI infrastructure development. This creates a bifurcation in the AI theme: while equity markets debate valuations, commodity markets are responding to tangible, long-term demand.

          Short-Term Volatility Masks Long-Term Potential

          The latest market pullback underscores rising sensitivity around AI valuations and the challenges of navigating macroeconomic uncertainties. While Broadcom’s results point to a solid future, investor behavior reflects unease about timing and positioning. In the near term, sentiment may continue to override fundamentals, especially in high-momentum sectors.
          Nonetheless, structural themes such as AI expansion, energy infrastructure, and digitalization remain intact, as evidenced by soaring copper prices and optimistic long-term forecasts. The market’s current volatility may simply represent a recalibration phase before a more durable upward trajectory resumes in 2026.

          Source: CNBC

          To stay updated on all economic events of today, please check out our Economic calendar
          Risk Warnings and Disclaimers
          You understand and acknowledge that there is a high degree of risk involved in trading. Following any strategies or investment methods may lead to potential losses. The content on the site is provided by our contributors and analysts for information purposes only. You are solely responsible for determining whether any trading assets, securities, strategy, or any other product is suitable for investing based on your own investment objectives and financial situation.
          Add to Favorites
          Share

          China’s Economic Engine Stalls as Factory Output and Retail Sales Lose Momentum

          Gerik

          Economic

          Weakened Output and Consumption Underscore Domestic Fragility

          In November, China's industrial production expanded by 4.8% year-on-year, slightly below the 4.9% growth recorded in October and missing the 5.0% projection from a Reuters poll. This mild deceleration, while modest on paper, points to underlying structural fatigue in the world’s second-largest economy, particularly as global demand plateaus and domestic consumption remains tepid.
          More concerning was the sharp slowdown in retail sales, which rose just 1.3% compared to the 2.9% gain seen in October. This marks a notable deterioration in consumer sentiment, especially worrying as it comes during a period typically characterized by increased seasonal spending. The underperformance reflects a broader pattern of weak demand and declining consumer confidence that is proving resistant to recent policy efforts.

          Consumer Caution Deepens Despite Promotional Efforts

          November's slump in retail activity is further highlighted by a significant 8.5% year-on-year drop in auto sales the steepest contraction in ten months. This outcome defies the usual fourth-quarter boost from year-end promotions and reveals that discretionary spending remains under intense pressure. Even the extended Singles' Day festival, which was prolonged to five weeks by major e-commerce platforms to boost sales, failed to revive demand meaningfully. This suggests a fundamental lack of willingness or ability among households to spend, despite aggressive marketing and discounting.
          The muted performance indicates that the ongoing property sector turmoil continues to erode household wealth, thereby constraining consumption. Given that consumer spending is a critical pillar for rebalancing China's economic model, these results raise concerns about the sustainability of domestic-led recovery.
          Fixed Asset Investment Falls, Raising Concerns on Investment-Led Growth
          In a parallel trend, fixed asset investment also contracted by 1.3% in the January–November period, narrowing from a 1.7% decline in the first ten months but still reflective of sluggish momentum. The slight improvement was not enough to offset broader skepticism, especially as analysts had forecast a larger 2.3% drop.
          This decline underscores a broader investment slowdown, particularly in real estate and infrastructure areas long relied upon to fuel GDP expansion. Persistent weakness in these sectors casts doubt on the effectiveness of traditional stimulus levers and highlights the limitations of a policy framework still centered around heavy production and capital deployment.

          Policymakers Under Pressure Amid Growth Target Ambitions

          Despite the growing signs of economic strain, Beijing appears determined to pursue a 5% growth target for 2026, as the country enters the first year of a new five-year development plan. This ambition, while politically important, faces increasing skepticism from global institutions such as the World Bank and the IMF, both of which have issued more conservative forecasts for China’s growth trajectory.
          At a recent high-level policy meeting, Chinese leaders reaffirmed their commitment to a “proactive” fiscal stance, promising to stimulate both consumption and investment. However, their rhetoric also acknowledged a growing contradiction between strong domestic supply and faltering demand. This admission highlights a lingering reluctance to fully transition away from supply-side, export-driven policies toward a consumption-oriented economic model.

          Geopolitical Frictions Threaten External Demand Resilience

          China’s exports have remained relatively resilient, surprising analysts who expected sharper declines due to higher U.S. tariffs. However, this strength may not last. The nation’s substantial trade surplus exceeding a trillion dollars has provoked increasing pushback from trading partners. French President Emmanuel Macron, during a state visit, publicly criticized China’s trade imbalances and hinted at potential retaliatory tariffs. Similarly, Mexico approved tariffs of up to 50% on certain Chinese imports beginning next year.
          These actions introduce new risks to China's export engine, potentially weakening one of the few bright spots in the country’s current economic landscape. If retaliation spreads, external demand could contract sharply, compounding domestic vulnerabilities.
          China’s November data paints a sobering picture of an economy caught between weakening internal demand and growing external scrutiny. Industrial production and retail sales have lost momentum, while fixed investment continues to decline. Despite public commitments to rebalance the economy, the current policy response remains tethered to legacy models of growth. Until consumer confidence returns and structural imbalances are addressed, China’s path to sustainable recovery will likely remain uneven and vulnerable to both internal pressures and external frictions.

          Source: Reuters

          To stay updated on all economic events of today, please check out our Economic calendar
          Risk Warnings and Disclaimers
          You understand and acknowledge that there is a high degree of risk involved in trading. Following any strategies or investment methods may lead to potential losses. The content on the site is provided by our contributors and analysts for information purposes only. You are solely responsible for determining whether any trading assets, securities, strategy, or any other product is suitable for investing based on your own investment objectives and financial situation.
          Add to Favorites
          Share
          FastBull
          Copyright © 2025 FastBull Ltd

          728 RM B 7/F GEE LOK IND BLDG NO 34 HUNG TO RD KWUN TONG KLN HONG KONG

          TelegramInstagramTwitterfacebooklinkedin
          App Store Google Play Google Play
          Products
          Charts

          Chats

          Q&A with Experts
          Screeners
          Economic Calendar
          Data
          Tools
          Membership
          Features
          Function
          Markets
          Copy Trading
          Latest Signals
          Contests
          News
          Analysis
          24/7
          Columns
          Education
          Company
          Careers
          About Us
          Contact Us
          Advertising
          Help Center
          Feedback
          User Agreement
          Privacy Policy
          Business

          White Label

          Data API

          Web Plug-ins

          Poster Maker

          Affiliate Program

          Risk Disclosure

          The risk of loss in trading financial instruments such as stocks, FX, commodities, futures, bonds, ETFs and crypto can be substantial. You may sustain a total loss of the funds that you deposit with your broker. Therefore, you should carefully consider whether such trading is suitable for you in light of your circumstances and financial resources.

          No decision to invest should be made without thoroughly conducting due diligence by yourself or consulting with your financial advisors. Our web content might not suit you since we don't know your financial conditions and investment needs. Our financial information might have latency or contain inaccuracy, so you should be fully responsible for any of your trading and investment decisions. The company will not be responsible for your capital loss.

          Without getting permission from the website, you are not allowed to copy the website's graphics, texts, or trademarks. Intellectual property rights in the content or data incorporated into this website belong to its providers and exchange merchants.

          Not Logged In

          Log in to access more features

          FastBull Membership

          Not yet

          Purchase

          Become a signal provider
          Help Center
          Customer Service
          Dark Mode
          Price Up/Down Colors

          Log In

          Sign Up

          Position
          Layout
          Fullscreen
          Default to Chart
          The chart page opens by default when you visit fastbull.com