• Trade
  • Markets
  • Copy
  • Contests
  • 24/7
  • Calendar
  • Q&A
  • Chats
Screeners
SYMBOL
LAST
BID
ASK
HIGH
LOW
NET CHG.
%CHG.
SPREAD
SPX
S&P 500 Index
6582.68
6582.68
6582.68
6601.92
6474.95
+7.36
+ 0.11%
--
DJI
Dow Jones Industrial Average
46504.66
46504.66
46504.66
46754.72
45897.24
-61.09
-0.13%
--
IXIC
NASDAQ Composite Index
21879.17
21879.17
21879.17
21906.48
21371.32
+38.23
+ 0.18%
--
USDX
US Dollar Index
99.940
99.940
100.020
99.980
99.740
+0.100
+ 0.10%
--
EURUSD
Euro / US Dollar
1.15112
1.15112
1.15230
1.15487
1.15102
-0.00272
-0.24%
--
GBPUSD
Pound Sterling / US Dollar
1.31914
1.31914
1.32119
1.32423
1.31853
-0.00345
-0.26%
--
XAUUSD
Gold / US Dollar
4675.97
4675.97
4676.41
0.00
0
0.00
0.00%
--
WTI
Light Sweet Crude Oil
103.809
103.809
103.905
0.000
0
0.000
0.00%
--

Community Accounts

Signal Accounts
--
Profit Accounts
--
Loss Accounts
--
View More

Become a signal provider

Sell trading signals to earn additional income

View More

Guide to Copy Trading

Get started with ease and confidence

View More

Signal Accounts for Members

All Signal Accounts

Best Return
  • Best Return
  • Best P/L
  • Best MDD
Past 1W
  • Past 1W
  • Past 1M
  • Past 1Y

All Contests

  • All
  • Trump Updates
  • Recommend
  • Stocks
  • Cryptocurrencies
  • Central Banks
  • Featured News
Top News Only
Share

Ukrainian Drone Commander: Ukraine Attacked An Oil Refinery In Russia’s Nizhny Novgorod Region And The Baltic Port Of Primorsk

Share

OPEC+ Representative: OPEC+ Has Agreed In Principle To Increase Production By 206,000 Barrels Per Day

Share

The Statement Indicates That The Egyptian Foreign Minister Exchanged Views And Suggestions With US President's Special Envoy Witkov And His Regional Counterparts On Easing Regional Tensions

Share

Iranian Foreign Minister: (To The Pakistani Foreign Minister) Iran Thanks Pakistan For Its Assistance And Is Determined To Use All Its Capabilities To Defend Its Security

Share

Abu Dhabi Authorities Stated That Missile Debris Fell After The Interception Operation And That They Are Currently Dealing With A Fire At The Borug Petrochemicals Plant. Plant Operations Have Been Suspended Until A Damage Assessment Is Completed; No Injuries Have Been Reported

Share

Iran Claims Multi-Agency Operation Hit U.S. Rescue Aircraft

Share

According To Iran's Tasnim News Agency, A Spokesperson For The Joint Command Of The Iranian Armed Forces Stated That The Downed US Aircraft Consisted Of A C-130 Military Transport Plane And Two Black Hawk Helicopters

Share

According To Iran's Tasnim News Agency, The Iranian Islamic Revolutionary Guard Corps Claimed That Several "flying Objects" Were Destroyed During The US Military's Operation To Rescue The Pilot

Share

Yemen's Houthi Movement Launches Missile Attack On Israel Using Missiles Equipped With Cluster Warheads

Share

Iran Claims To Have Shot Down 162 Drones Since The Start Of This Round Of Conflict

Share

According To Al Jazeera: Israel's Attack On Southern Lebanon Has Killed Three People

Share

24-hour Monitoring Of The Strait Of Hormuz: Some Vessels Are Transiting

Share

According To Fox News: Sources Say The CIA Conducted A "deception Operation" Before Carrying Out The Daring Rescue Operation In Iran

Share

Bahrain's National Oil And Gas Company Confirmed That An Incident Occurred At One Of Its Oil Storage Facilities On Sunday Following An Iranian Attack, Resulting In A Fire In The Oil Tanks. The Fire Has Been Completely Extinguished, The Situation Is Under Control, And Damage Is Currently Being Assessed. No Casualties Have Been Reported

Share

According To Iran's Nour News, The Islamic Republic Of Iran Police Stated That The U.S. Aircraft Shot Down In Isfahan Was A C-130 Transport Plane Used For Aerial Refueling

Share

Egypt Raises Electricity Prices For High-Consumption Households And Businesses

Share

The Local Governor Said An Oil Pipeline In Primorsk, A Baltic Port In Russia, Was Damaged In A Ukrainian Drone Attack

Share

According To Iran's Mizan News Agency: Iran Has Executed Two Men Accused Of Attacking Military Facilities During Protests In January

Share

At The Request Of The U.S. Government, Planet Labs Has Indefinitely Suspended The Release Of Satellite Imagery Of The Conflict In Iran

Share

Saudi Arabia's S&P Global Composite PMI Fell To 48.8 In March, Down From 56.1 In February

TIME
ACT
FCST
PREV
U.S. Weekly Initial Jobless Claims (SA)

A:--

F: --

P: --
Canada Imports (SA) (Feb)

A:--

F: --

P: --
Canada Trade Balance (SA) (Feb)

A:--

F: --

P: --
Canada Exports (SA) (Feb)

A:--

F: --

P: --
U.S. Weekly Continued Jobless Claims (SA)

A:--

F: --

P: --
U.S. Initial Jobless Claims 4-Week Avg. (SA)

A:--

F: --

P: --
U.S. Exports (Feb)

A:--

F: --

P: --

U.S. EIA Weekly Natural Gas Stocks Change

A:--

F: --

P: --

U.S. Weekly Total Rig Count

A:--

F: --

P: --

U.S. Weekly Total Oil Rig Count

A:--

F: --

P: --

U.S. Weekly Treasuries Held by Foreign Central Banks

A:--

F: --

P: --

Japan IHS Markit Composite PMI (Mar)

A:--

F: --

P: --

Japan IHS Markit Services PMI (Mar)

A:--

F: --

P: --

China, Mainland Caixin Services PMI (Mar)

A:--

F: --

P: --

China, Mainland Caixin Composite PMI (Mar)

A:--

F: --

P: --

Russia IHS Markit Services PMI (Mar)

A:--

F: --

P: --

France Industrial Output MoM (SA) (Feb)

A:--

F: --

P: --
Turkey PPI YoY (Mar)

A:--

F: --

P: --

Turkey CPI YoY (Mar)

A:--

F: --

P: --

U.S. Government Employment (Mar)

A:--

F: --

P: --

U.S. Private Nonfarm Payrolls (SA) (Mar)

A:--

F: --

P: --
U.S. Average Weekly Working Hours (SA) (Mar)

A:--

F: --

P: --

U.S. Labor Force Participation Rate (SA) (Mar)

A:--

F: --

P: --

U.S. Manufacturing Employment (SA) (Mar)

A:--

F: --

P: --
U.S. Average Hourly Wage YoY (Mar)

A:--

F: --

P: --

U.S. U6 Unemployment Rate (SA) (Mar)

A:--

F: --

P: --

U.S. Unemployment Rate (SA) (Mar)

A:--

F: --

P: --

U.S. Nonfarm Payrolls (SA) (Mar)

A:--

F: --

P: --
U.S. Average Hourly Wage MoM (SA) (Mar)

A:--

F: --

P: --

Saudi Arabia IHS Markit Composite PMI (Mar)

A:--

F: --

P: --

India IHS Markit Composite PMI (Mar)

--

F: --

P: --

India HSBC Services PMI Final (Mar)

--

F: --

P: --

Canada National Economic Confidence Index

--

F: --

P: --

Brazil IHS Markit Services PMI (Mar)

--

F: --

P: --

Brazil IHS Markit Composite PMI (Mar)

--

F: --

P: --

U.S. ISM Non-Manufacturing PMI (Mar)

--

F: --

P: --

U.S. ISM Non-Manufacturing Price Index (Mar)

--

F: --

P: --

U.S. ISM Non-Manufacturing Inventories Index (Mar)

--

F: --

P: --

U.S. ISM Non-Manufacturing Employment Index (Mar)

--

F: --

P: --

U.S. ISM Non-Manufacturing New Orders Index (Mar)

--

F: --

P: --

U.S. Conference Board Employment Trends Index (SA) (Mar)

--

F: --

P: --

China, Mainland Foreign Exchange Reserves (Mar)

--

F: --

P: --

Japan Foreign Exchange Reserves (Mar)

--

F: --

P: --

Japan 30-Year JGB Auction Yield

--

F: --

P: --

Japan Leading Indicators Prelim (Feb)

--

F: --

P: --

South Africa IHS Markit Composite PMI (SA) (Mar)

--

F: --

P: --

Italy Composite PMI (Mar)

--

F: --

P: --

Italy Services PMI (SA) (Mar)

--

F: --

P: --

Euro Zone Sentix Investor Confidence Index (Apr)

--

F: --

P: --

U.K. Official Reserves Changes (Mar)

--

F: --

P: --

U.S. Durable Goods Orders MoM (Excl. Defense) (SA) (Feb)

--

F: --

P: --

U.S. Durable Goods Orders MoM (Feb)

--

F: --

P: --

U.S. Non-Defense Capital Durable Goods Orders MoM (Excl. Aircraft) (Feb)

--

F: --

P: --

U.S. Durable Goods Orders MoM (Excl.Transport) (Feb)

--

F: --

P: --

U.S. Weekly Redbook Index YoY

--

F: --

P: --

Canada Ivey PMI (Not SA) (Mar)

--

F: --

P: --

Canada Ivey PMI (SA) (Mar)

--

F: --

P: --

U.S. EIA Natural Gas Production Forecast For The Next Year (Apr)

--

F: --

P: --

U.S. EIA Short-Term Crude Production Forecast For The Next Year (Apr)

--

F: --

P: --

U.S. EIA Short-Term Crude Production Forecast For The Year (Apr)

--

F: --

P: --

Q&A with Experts
    • All
    • Chatrooms
    • Groups
    • Friends
    horus flag
    ali
    140 crudeoil too much if this happens then stock market some 5% fall Tommorow indice forex
    @alisi pienso que petroleo se desploma mañana está muy cargado aunque el 7 es el plazo que les dió Donald para negociar todo depende de esa noticia
    horus flag
    bueno amigos me voy a trabajar, cierro la operación que tengo y luego veo si hay otro chance que tengan éxito
    Ikeh Sunday flag
    BTC cooking it
    Sanjeev Ku flag
    ali
    btc may go up 2% to 4% today
    @alireally bro.ok waiting to see btc 2 to 4 percent up
    Ikeh Sunday flag
    the king 👑 Is back . making dollar great again
    Sanjeev Ku flag
    Sanjeev Ku flag
    running trades btc
    Ikeh Sunday flag
    Ikeh Sunday flag
    Sanjeev Ku
    running trades btc
    @Sanjeev Kunot doing bad
    Ikeh Sunday flag
    am out for now . let see how it will develop
    Sanjeev Ku flag
    Ikeh Sunday
    @Sanjeev Kunot doing bad
    @Ikeh Sunday bro if comes 64k then would be upto my expectation
    3966934 flag
    explain trading
    mukesh jha flag
    mukesh jha flag
    FURURE MORE CONFUSE
    mukesh jha flag
    mukesh jha flag
    mukesh jha
    SPOT CHART ALL TIME BEST
    Nawhdir Øt flag
    Nawhdir Øt flag
    mukesh jha flag
    FORMFOREXL flag
    GUYS be cautious about the BTCUSDT price!! there's still a possibility for further move lower , toward 65692 price level and most likely violate it.
    Type here...
    Add Symbol or Code

      No matching data

      All
      Trump Updates
      Recommend
      Stocks
      Cryptocurrencies
      Central Banks
      Featured News
      • All
      • Russia-Ukraine Conflict
      • Middle East Flashpoint
      • All
      • Russia-Ukraine Conflict
      • Middle East Flashpoint
      Search
      Products

      Charts Free Forever

      Chats Q&A with Experts
      Screeners Economic Calendar Data Tools
      Membership Features
      Data Warehouse Market Trends Institutional Data Policy Rates Macro

      Market Trends

      Market Sentiment Order Book Forex Correlations

      Top Indicators

      Charts Free Forever
      Markets

      News

      24/7 Analysis Education

      Latest Views

      Latest Update

      Signals

      Copy Rankings Latest Signals Become a signal provider AI Rating
      Contests
      Brokers

      Overview Brokers Assessment Rankings Regulators News Claims
      Broker listing Forex Brokers Comparison Tool Live Spread Comparison Scam
      Q&A Complaint Scam Alert Videos Tips to Detect Scam
      More

      Business
      Events
      Careers About Us Advertising Help Center

      White Label

      Broker API

      Data API

      Web Plug-ins

      Affiliate Program

      Awards Institution Evaluation IB Seminar Salon Event Exhibition
      Vietnam Thailand Singapore Dubai
      Fans Party Investment Sharing Session
      FastBull Summit BrokersView Expo
      Recent Searches
        Top Searches
          Markets
          Analysis
          User
          24/7
          Economic Calendar
          Education
          Data
          • Names
          • Latest
          • Prev

          View All

          No data

          Scan to Download

          Faster Charts, Chat Faster!

          Download App
          English
          • English
          • Español
          • العربية
          • Bahasa Indonesia
          • Bahasa Melayu
          • Tiếng Việt
          • ภาษาไทย
          • Français
          • Italiano
          • Türkçe
          • Русский язык
          • 简中
          • 繁中
          Open Account
          Search
          Products
          Charts Free Forever
          Markets
          News
          Signals

          Copy Rankings Latest Signals Become a signal provider AI Rating
          Contests
          Brokers

          Overview Brokers Assessment Rankings Regulators News Claims
          Broker listing Forex Brokers Comparison Tool Live Spread Comparison Scam
          Q&A Complaint Scam Alert Videos Tips to Detect Scam
          More

          Business
          Events
          Careers About Us Advertising Help Center

          White Label

          Broker API

          Data API

          Web Plug-ins

          Affiliate Program

          Awards Institution Evaluation IB Seminar Salon Event Exhibition
          Vietnam Thailand Singapore Dubai
          Fans Party Investment Sharing Session
          FastBull Summit BrokersView Expo

          Pol (MATIC) Price Prediction 2025, 2026 – 2030: Will MATIC Price Surge to $1?

          Coinpedia
          1inch / Tether
          -1.56%
          Vaulta / Tether
          -2.78%
          AAVE / Tether
          -1.96%
          Fusionist / Tether
          -1.41%

          Story Highlights

          • The live price of the Polygon coin is .
          • The MATIC price could reach a maximum of $0.47181 in 2025.
          • POL price with a potential surge may reach a high of $4.94731 by 2030.

          Polygon has a mind-blowing Layer-2 scaling solution project for Ethereum, which is primarily designed to address slow speeds and the network’s high transaction fees.

          As a result, Polygon is seen as a revolutionary framework for developers and users, as it attracts by offering a more efficient Ethereum experience, which is the reason contributing to POL’s price value, too.

          Through, POL, which is its native token (formerly MATIC), is utilized for transaction fees and network governance, in the framwork of interconnected Ethereum-compatible blockchain networks.

          Its use case makes it an attractive altcoin, and even its token POL price is attracting attention. The coin is expected to show a surge in the coming sessions, but it would require a technical eye to understand.

          Therefore, if you are curious about whether the POL price can rebound to $1. Will Polygon go up? And is Polygon a good investment? We bring our Polygon Price Prediction for 2025 – 2030 to explore the POL price prediction.

          Table of contents

          • Overview
          • Polygon Price Prediction 2026 - 2030
          • Polygon Price Action 2026
          • POL Price Prediction 2027
          • Polygon Crypto Price Forecast 2028
          • MATIC Coin Price Projection 2029
          • Polygon Price Prediction 2030
          • Market Analysis
          • FAQs

          Overview

          Cryptocurrency
          Token
          Price
          Market Cap
          Trading Volume
          Circulating Supply
          All-time High $1.29 Mar 14, 2024
          All-time Low $0.1533 Apr 07, 2025

          Polygon Price Prediction 2025

          As evident on the POL/USD daily chart on COINBASE, its price has been down more than 75% since December 2024, and Q1 2025 played a significant role in pushing it deep down the well.

          However, in April of Q2 2025, bullish forces revived and took it to the 0.236 level-based resistance in mid-May. Despite the efforts, the Polygon was still very low and was among the list of altcoins that showed muted growth in Q2 compared to other altcoins.

          However, the muted growth was brief as mid-May to June bears pushed its price back to April's low, which shows that the asset strongly lacks bullish conviction in the short term.

          The POL price could pull below $0.1000 if bearish forces continue downward pressure.

          All these circumstances occurred during Donald Trump's presidential start in 2025, and by H1 so far, the market participants have witnessed multiple wars, resulting in bearish dominance.

          The recent Israel-Iran agreement was the most significant factor that pushed altcoins like POL's price in June.

          POLUSD Price

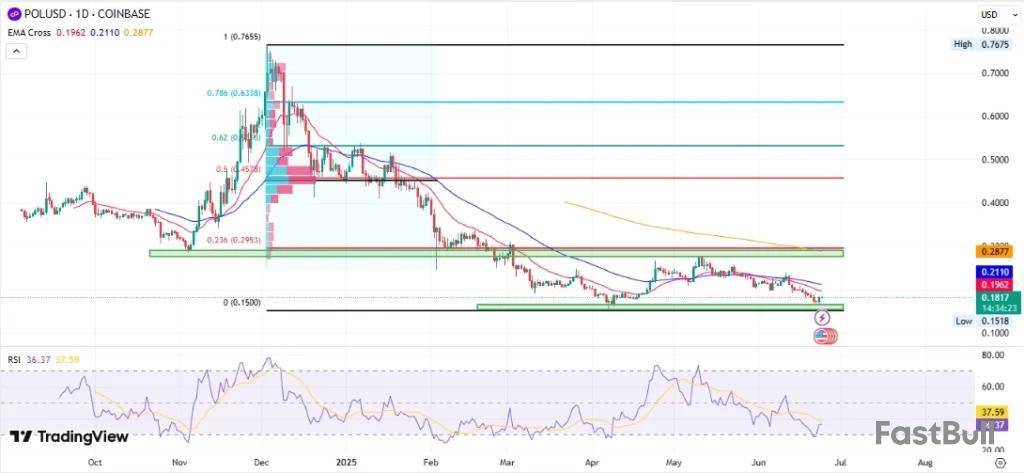
          However, on June 24th, POL saw a 7% intraday rise with a ceasefire announcement, which reignited people's expectations. Therefore, if the conditions improve, the 0.236 Fibonacci level could be retested in June or July.

          If it clears that $0.4572 level in June or July, the odds of clearing Fibo are 0.50, 0.786, and the 1.0 level could be retested by the end of 2025.

          Additionally, RSI has reached oversold territory, and with the recent intraday rise, RSI has reversed, too. It shows that the Bullish sentiment is increasing in the short term.

          Also, read our Ethereum Price Prediction 2025-2030

          Polygon Price Prediction 2026 - 2030

          Year Potential Low ($) Potential Average ($) Potential High ($)
          2026 $0.18870 $0.47179 $0.75488
          2027 $0.30194 $0.75488 $1.20782
          2028 $0.48311 $1.20782 $1.93252
          2029 $0.77297 $1.93252 $3.09205
          2030 $1.23676 $3.09205 $4.94729

          Polygon Price Action 2026

          Anticipating further expansion, MATIC’s potential high for 2026 is projected to be $0.75488, while the potential low is estimated at $0.18870, resulting in an average price of $0.47179.

          POL Price Prediction 2027

          MATIC crypto can make a potential high of $1.20782 in 2027, with a potential low of $0.30194, leading to an average price of $0.75488.

          Polygon Crypto Price Forecast 2028

          As the POL price progresses, the potential high price for 2028 is projected to be $1.93252, with a potential low of $0.48311, resulting in an average price of $1.20782.

          MATIC Coin Price Projection 2029

          Polygon coin price potential high for 2029 could be $3.09205, while a potential low of $0.77297, with an average price of $1.93252.

          Polygon Price Prediction 2030

          With an established position in the market, POL’s potential high for 2030 is projected to be $4.94729. On the flip side, a potential low of $1.23676 will result in an average price of $3.09205.

          Market Analysis

          Firm Name 2025 2026 2030
          CoinCodex $ 0.71 $ 0.50 $ 0.90
          Binance $0.24 $0.26 $0.31
          Flitpay $6.25 $4 $10.4

          CoinPedia’s MATIC Price Prediction

          Coinpedia's price prediction for Polygon is bullish, suggesting the MATIC crypto price may reach new swing highs and possibly surpass its all-time high in the near future.

          The Polygon Price Forecast 2025 predicts a swing high of $0.47181, with an average price of $0.29488.

          Year 2025
          Potential Low $0.11795
          Potential Average $0.29488
          Potential High $0.47181

          FAQs

          Is MATIC a good investment?

          Yes, it is a profitable investment, but the digital asset should be under due consideration for the long term.

          How high can Polygon MATIC price go by 2025?

          According to our MATIC price prediction, the altcoin could reach a maximum of $0.47181 by 2025. With a potential surge, the price could go as high as $4.94731 by 2030.

          Is Polygon better than Solana?

          While it is not a direct apples-to-apples comparison, as one is a layer-2 and the other is a layer-1.

          How high can Polygon MATIC transactions go?

          At its best, it can process 65,000 transactions per second.

          Why Polygon is faster than Ethereum?

          The major functionality of this altcoin is to enable the multichain Ethereum ecosystem. It provides a network that offers interoperability between previous and present infrastructure scenarios of Ethereum.

          Can polygon hit $100?

          As per our MATIC price prediction, $100 dollars target is possible over the next 18 years.

          Has MATIC changed to POL?

          Yes, MATIC has been upgraded to POL as the network token for Polygon.

          MATIC

          BINANCE

          Risk Warnings and Disclaimers
          You understand and acknowledge that there is a high degree of risk involved in trading. Following any strategies or investment methods may lead to potential losses. The content on the site is provided by our contributors and analysts for information purposes only. You are solely responsible for determining whether any trading assets, securities, strategy, or any other product is suitable for investing based on your own investment objectives and financial situation.
          Add to Favorites
          Share
          FastBull
          Copyright © 2026 FastBull Ltd

          728 RM B 7/F GEE LOK IND BLDG NO 34 HUNG TO RD KWUN TONG KLN HONG KONG

          TelegramInstagramTwitterfacebooklinkedin
          App Store Google Play Google Play
          Products
          Charts

          Chats

          Q&A with Experts
          Screeners
          Economic Calendar
          Data
          Tools
          Membership
          Features
          Function
          Markets
          Copy Trading
          Latest Signals
          Contests
          24/7
          Analysis
          Education
          Company
          Careers
          About Us
          Contact Us
          Advertising
          Help Center
          Feedback
          User Agreement
          Privacy Policy
          Personal Information Protection Statement
          Business

          White Label

          Broker API

          Data API

          Web Plug-ins

          Poster Maker

          Affiliate Program

          Risk Disclosure

          The risk of loss in trading financial instruments such as stocks, FX, commodities, futures, bonds, ETFs and crypto can be substantial. You may sustain a total loss of the funds that you deposit with your broker. Therefore, you should carefully consider whether such trading is suitable for you in light of your circumstances and financial resources.

          No decision to invest should be made without thoroughly conducting due diligence by yourself or consulting with your financial advisors. Our web content might not suit you since we don't know your financial conditions and investment needs. Our financial information might have latency or contain inaccuracy, so you should be fully responsible for any of your trading and investment decisions. The company will not be responsible for your capital loss.

          Without getting permission from the website, you are not allowed to copy the website's graphics, texts, or trademarks. Intellectual property rights in the content or data incorporated into this website belong to its providers and exchange merchants.

          Not Logged In

          Log in to access more features

          Connect Broker
          Become a signal provider
          Help Center
          Customer Service
          Dark Mode
          Price Up/Down Colors

          Log In

          Sign Up

          Position
          Layout
          Fullscreen
          Default to Chart
          The chart page opens by default when you visit fastbull.com