Markets
News
Analysis
User
24/7
Economic Calendar
Education
Data
- Names
- Latest
- Prev


Signal Accounts for Members
All Signal Accounts
All Contests
 Euro Zone IHS Markit Construction PMI (Nov)
A:--
F: --
P: --
 Italy IHS Markit Construction PMI (Nov)
A:--
F: --
P: --
 U.K. Markit/CIPS Construction PMI (Nov)
A:--
F: --
P: --
 France 10-Year OAT Auction Avg. Yield
A:--
F: --
P: --
Euro Zone Retail Sales MoM (Oct)A:--
F: --
P: --
Euro Zone Retail Sales YoY (Oct)A:--
F: --
P: --
 Brazil GDP YoY (Q3)
A:--
F: --
P: --
 U.S. Challenger Job Cuts (Nov)
A:--
F: --
P: --
U.S. Challenger Job Cuts MoM (Nov)A:--
F: --
P: --
U.S. Challenger Job Cuts YoY (Nov)A:--
F: --
P: --
U.S. Initial Jobless Claims 4-Week Avg. (SA)A:--
F: --
P: --
U.S. Weekly Initial Jobless Claims (SA)A:--
F: --
P: --
U.S. Weekly Continued Jobless Claims (SA)A:--
F: --
P: --
 Canada Ivey PMI (SA) (Nov)
A:--
F: --
P: --
Canada Ivey PMI (Not SA) (Nov)A:--
F: --
P: --
U.S. Non-Defense Capital Durable Goods Orders Revised MoM (Excl. Aircraft) (SA) (Sept)A:--
F: --
U.S. Factory Orders MoM (Excl. Transport) (Sept)A:--
F: --
P: --
U.S. Factory Orders MoM (Sept)A:--
F: --
P: --
U.S. Factory Orders MoM (Excl. Defense) (Sept)A:--
F: --
P: --
U.S. EIA Weekly Natural Gas Stocks ChangeA:--
F: --
P: --
Saudi Arabia Crude Oil ProductionA:--
F: --
P: --
U.S. Weekly Treasuries Held by Foreign Central BanksA:--
F: --
P: --
 Japan Foreign Exchange Reserves (Nov)
A:--
F: --
P: --
 India Repo Rate
A:--
F: --
P: --
India Benchmark Interest RateA:--
F: --
P: --
India Reverse Repo RateA:--
F: --
P: --
India Cash Reserve RatioA:--
F: --
P: --
Japan Leading Indicators Prelim (Oct)A:--
F: --
P: --
U.K. Halifax House Price Index YoY (SA) (Nov)A:--
F: --
P: --
U.K. Halifax House Price Index MoM (SA) (Nov)A:--
F: --
P: --
France Current Account (Not SA) (Oct)--
F: --
P: --
France Trade Balance (SA) (Oct)--
F: --
P: --
France Industrial Output MoM (SA) (Oct)--
F: --
P: --
Italy Retail Sales MoM (SA) (Oct)--
F: --
P: --
Euro Zone Employment YoY (SA) (Q3)--
F: --
P: --
Euro Zone GDP Final YoY (Q3)--
F: --
P: --
Euro Zone GDP Final QoQ (Q3)--
F: --
P: --
Euro Zone Employment Final QoQ (SA) (Q3)--
F: --
P: --
Euro Zone Employment Final (SA) (Q3)--
F: --
Brazil PPI MoM (Oct)--
F: --
P: --
 Mexico Consumer Confidence Index (Nov)
--
F: --
P: --
Canada Unemployment Rate (SA) (Nov)--
F: --
P: --
Canada Labor Force Participation Rate (SA) (Nov)--
F: --
P: --
Canada Employment (SA) (Nov)--
F: --
P: --
Canada Part-Time Employment (SA) (Nov)--
F: --
P: --
Canada Full-time Employment (SA) (Nov)--
F: --
P: --
U.S. Personal Income MoM (Sept)--
F: --
P: --
U.S. Dallas Fed PCE Price Index YoY (Sept)--
F: --
P: --
U.S. PCE Price Index YoY (SA) (Sept)--
F: --
P: --
U.S. PCE Price Index MoM (Sept)--
F: --
P: --
U.S. Personal Outlays MoM (SA) (Sept)--
F: --
P: --
U.S. Core PCE Price Index MoM (Sept)--
F: --
P: --
U.S. UMich 5-Year-Ahead Inflation Expectations Prelim YoY (Dec)--
F: --
P: --
U.S. Core PCE Price Index YoY (Sept)--
F: --
P: --
U.S. Real Personal Consumption Expenditures MoM (Sept)--
F: --
P: --
U.S. 5-10 Year-Ahead Inflation Expectations (Dec)--
F: --
P: --
U.S. UMich Current Economic Conditions Index Prelim (Dec)--
F: --
P: --
U.S. UMich Consumer Sentiment Index Prelim (Dec)--
F: --
P: --
U.S. UMich 1-Year-Ahead Inflation Expectations Prelim (Dec)--
F: --
P: --
U.S. UMich Consumer Expectations Index Prelim (Dec)--
F: --
P: --

No matching data
Latest Views
Latest Views
Trending Topics
Top Columnists
Latest Update
White Label
Data API
Web Plug-ins
Affiliate Program
View All
No data
Oil steadied after falling to five-month low, as investors weighed an expected supply glut against the fallout of escalating US-China trade tensions.
Oil steadied after falling to five-month low, as investors weighed an expected supply glut against the fallout of escalating US-China trade tensions.
West Texas Intermediate traded near $59 a barrel after sliding to the lowest since May on Tuesday, while Brent closed near $62. The International Energy Agency on Tuesday increased its forecast for an unprecedented oversupply of oil for 2026. Worldwide crude supplies will exceed demand by almost 4 million barrels a day next year, a record overhang in annual terms, the agency said.
Meanwhile, investors are bracing for the latest tit-for-tat retaliation between the world’s two biggest economies, as Beijing sanctioned the US units of a South Korean shipping giant. US Trade Representative Jamieson Greer predicted that heightened tensions with China over export controls would ease, following the latest talks between their representatives.
Oil posted losses in August and September, and WTI has shed about 18% year-to-date. The decline has been driven by growing concerns that global supply will run ahead of demand, with many Wall Street banks forecasting futures will revisit the $50s-a-barrel range.
The heads of Japan’s main opposition parties are expected to discuss Wednesday whether they can close policy gaps and pick a candidate of their own for the nation’s premiership.The leaders — Yuichiro Tamaki of the Democratic Party for the People, Yoshihiko Noda of the Constitutional Democratic Party, and Fumitake Fujita of the Japan Innovation Party (Ishin) — plan to hold their first three-way meeting since the collapse of the ruling coalition last week. The three parties have enough combined seats in the powerful lower house of parliament to outnumber the ruling Liberal Democratic Party to block its new leader Sanae Takaichi from becoming the prime minister.
Lawmakers are also expected to confirm that an extraordinary parliament session will take place on Oct. 21 so that they can vote to pick the prime minister. A candidate doesn’t need an outright majority to become prime minister. If no one receives more than 50% support, the top two candidates compete in a runoff. The lower house’s decision overrules the upper house in the event the two chambers choose a different candidate.
Tamaki’s DPP has fewer seats in the lower house than CDP or Ishin, but its rising popularity demonstrated in the past two national elections makes Tamaki the leading candidate to challenge Takaichi. During a meeting between senior officials of the three parties held on Tuesday, Tamaki’s DPP sought a change in the CDP’s stance on security issues as well as nuclear energy.The political instability is also feeding into worries over the economic outlook, already heightened by US-China trade tensions. The yen was broadly stable Wednesday morning, trading around 151.70 to the dollar, while the Topix index rose 1% in early trading.
There is a precedent for multiple opposition parties unifying behind a single candidate to become premier despite the LDP having the biggest bloc in parliament. That happened in 1993, though the resulting government proved unstable, leading to the eventual return of the LDP to power.
As the opposition parties eye cooperation, Takaichi continues to lay the groundwork for the possibility of becoming prime minister. She is considering tapping main LDP rival and Agriculture Minister Shinjiro Koizumi as defense minister, and Chief Cabinet Secretary Yoshimasa Hayashi as internal affairs minister, according to the Yomiuri newspaper.For investors, either Takaichi or Tamaki would likely mean more government spending and pressure on the Bank of Japan to slow its path toward raising interest rates. While the instability might cause short-term falls in equities, the policy direction might then lift stocks, while feeding into a weaker yen and higher super-long yields with moves potentially larger in the case of a Tamaki-led administration.
South Korea rolled out a new round of measures aimed at reining in a red-hot housing market, stepping up efforts to curb speculative buying as policymakers weigh interest-rate cuts to bolster a slowing economy.The government’s latest steps include tighter loan limits in Greater Seoul, newly designated overheated districts, a faster roll-out of higher risk weights on banks’ home loans and cutting loan-to-value ratios on mortgage properties. The package comes as home prices continue to climb despite earlier interventions that included tighter mortgage caps in Seoul and restrictions on purchases by foreign buyers.
The recent instability in housing markets is spreading on global rate-cut expectations and persistent supply-demand imbalances that are driving concerns over excess capital inflows into real estate, Minister of Land, Infrastructure and Transport Kim Yun-duk said in a briefing Wednesday.“In response, we’re going to take preemptive measures to curb instability in the housing market early and to ensure that capital is directed toward more productive sectors of the economy,” he added.
The persistent gains are making it more risky for the Bank of Korea to lower borrowing costs to stimulate growth, as easier policy could fuel financial imbalances. The central bank held rates steady in April, about a month after the government released a fresh round of measures to cool the housing market, before conducting its most recent rate cut on May 29.
Since starting its easing cycle in October last year, the BOK has cut rates four times, but paused at its last two meetings to weigh the risks from rising household debt and rising property prices in Greater Seoul. The bank next sets policy on Oct. 23.President Lee Jae Myung, who took office in June after campaigning on improving housing affordability, has struggled to curb property prices that have kept many first-time buyers out of the market.Apartment prices in Seoul rose 0.27% in the week ended Sept. 29, accelerating from a 0.19% gain the previous week, according to the latest data from the Korea Real Estate Board released in early October. The rise marked the steepest weekly advance since early July, and it extended the market’s rally to a 35th consecutive week.
As part of the latest move, Korea will set different mortgage limits for home purchases in Seoul and other regulated areas, based on property prices, according to a joint release from financial authorities. The current 600 million won ($418,442) cap on loans will remain for homes valued at up to 1.5 billion won. But for properties priced between 1.5 billion won and 2.5 billion won, the cap will be reduced to 400 million won, while homes worth more than 2.5 billion won will be limited to loans of up to 200 million won.The government will also designate all 25 districts of Seoul as regulated and speculative areas, including regions on the outskirts of Seoul, such as parts of Gyeonggi Province. The new designations will take effect from Thursday.
Newly designated “regulated zones” will immediately face stricter mortgage limits. In these areas, home buyers can only borrow up to 40% of a property’s value, down from the previous 70%. The aim is to curb borrowing and tighten access to home loans, the statement added. Even tenants with rental loans or individuals with personal loans will face restrictions on purchasing homes in these districts, the statement said.Other measures include a rule that makes banks treat home loans as riskier, meaning they must hold more capital when issuing them. The change — raising the minimum risk level for mortgages from 15% to 20% — will take effect in January 2026, three months earlier than previously planned, the government statement showed.
Rising financial stability risks have prompted more economists to forecast that the BOK will hold rates at next week’s meeting. The decision comes as the government has said it expects to post its slowest annual growth since the pandemic slump of 2020. Adding to the strain, new tariffs imposed by Donald Trump are weighing on South Korea’s export-dependent recovery.Exports slipped in September, reinforcing signs of a broader slowdown. The central bank noted that while household debt growth has moderated, housing price expectations in Seoul remain stubbornly high.
The crypto market is in "fear" mode, with the Fear and Greed Index ranging from 34 to 40. This sentiment affects BTC, ETH, and AVAX, seen in liquidity shifts and ETF flows.
Market uncertainty is prompting caution among investors, with previous periods of fear often signaling future opportunities for strategic accumulations. The Fear and Greed Index serves as a critical sentiment indicator.
The current crypto market atmosphere is influenced by fear, with the index ranging from 34 to 40 recently. This has led to cautious behavior among investors, reflected in liquidity trends and risk-off sentiment. Bitcoin, Ethereum, and Avalanche are notably affected as they experience a decrease in trading volumes and price support.
Prominent figures such as Arthur Hayes from BitMEX underscore the potential for long-term gains during such market conditions. Vitalik Buterin from Ethereum has reiterated the continued focus on scalability and security upgrades, whereas Binance’s official updates emphasize monitoring sentiment pivots before making portfolio changes.
Potential financial outcomes include fluctuating Total Value Locked (TVL) in DeFi protocols and increasingly cautious ETF flows. Stablecoin inflows have risen as investors seek stability, indicating a defensive stance amid prevailing concerns. Historical precedents suggest a possibility of post-fear market rebounds supported by institutional accumulation.
The recent crypto market crash on October 10 marks the largest liquidation event in the history of digital asset trading, with over $19 billion forcibly liquidated in a matter of minutes. This unprecedented event triggered a cascade of liquidations, causing a dramatic $65 billion decline in open interest and highlighting vulnerabilities in crypto infrastructure and market stability. As the industry grapples with the fallout, experts point to technical flaws and possible coordinated attack vectors as key contributing factors to this historic downturn.
The crash on October 10 shattered previous records for liquidation volume, with more than $19 billion wiped out in a matter of minutes, according to market data. The liquidation wave resulted in a $65 billion drop in open interest across derivatives markets, exceeding past liquidity crises such as the COVID-19 crash and the collapse of FTX.
Market analysts have identified vulnerabilities in Binance’s pricing oracles as a potential catalyst. These oracles, which determine the value of certain pegged tokens like USDE, bnSOL, and wBETH, relied on internal data — not external oracles — increasing risk during market stress. These internal valuations are central to Binance’s “Unified Accounts” feature, making users susceptible to liquidation during irregular trading conditions.
While evidence of a coordinated attack remains inconclusive, the data indicates suspicious behavior. Notably, USDE experienced substantial liquidations, accounting for about $346 million, with other tokens like wBETH and bnSOL also heavily affected. The mass withdrawal of liquidity on stablecoin pairs adds a layer of suspicion, hinting at possible manipulation or strategic market moves.
Using detailed analytics from Rena Labs, a leading AI-driven market analysis firm, researchers detected one of the most severe and complex dislocations ever observed in stablecoin trading. Despite the USDE peg being intact, liquidity evaporated rapidly. Total liquidity on Binance declined from an average of $89 million to just $2 million in under 20 minutes, with bid-ask spreads widening to 22%, and nearly complete market depth disappearing.
During the crisis, trading activity surged exponentially — nearly 16 times higher than normal — with almost 3,000 trades per minute, predominantly sell orders. This panic-driven trading, combined with stop-loss triggers and forced liquidations, accelerated the liquidity collapse.
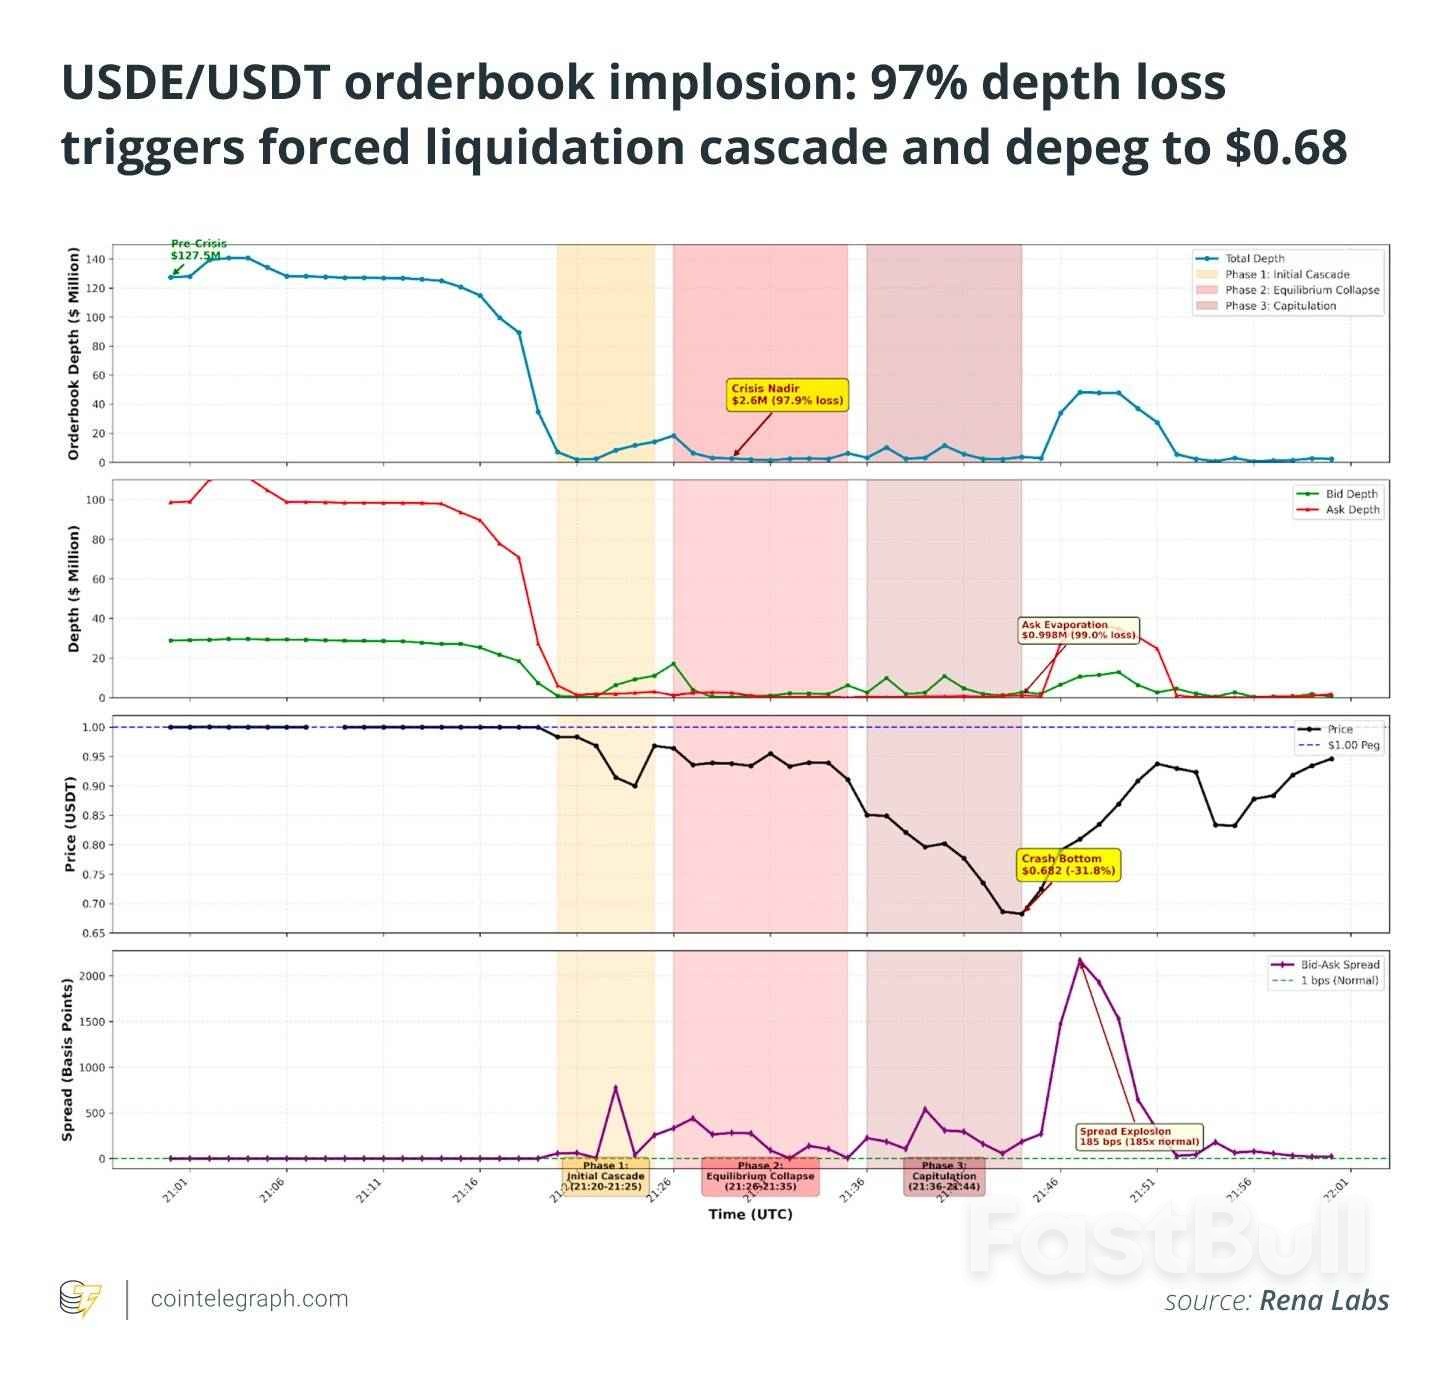
Rena’s anomaly detection system identified unusual activity hours before the liquidity crisis. At around 21:00 UTC, it recorded 28 anomalies, including spikes in volume, price deviations, and suspicious trade patterns such as spoofing — where traders manipulate markets by placing deceptive orders to influence prices.
Order book analysis revealed three large-volume order “volleys” just before the collapse, hinting at targeted manipulation when Bitcoin was already declining but before USDE liquidity vanished. These events underscore the fragility of crypto markets, where leverage and leverage-fueled liquidations can wipe out seemingly stable trades and expose systemic weaknesses, especially where market makers like Wintermute are absent.
This incident emphasizes the importance of robust risk management and reliable oracles in blockchain-based finance. As the crypto industry faces increasing scrutiny over its infrastructure, the October 10 crash serves as a stark reminder of the ongoing vulnerabilities within digital asset markets.
Federal Reserve Chairman Jerome Powell outlined the Fed's future monetary policy, indicating potential shifts in balance sheet reduction and liquidity management on October 15, 2025, in Beijing.
This announcement signals potential volatility in cryptocurrency markets as liquidity tightens, influencing Bitcoin, Ethereum, and stablecoin activities, with traders closely monitoring future monetary adjustments.
Federal Reserve Chairman Jerome Powell reviewed the Fed's balance sheet role and indicated its reduction might conclude soon. Liquidity conditions are tightening, as highlighted by monitored repo rates. Powell emphasized, "The Federal Reserve's balance sheet has played a pivotal role in stabilizing markets and supporting the recovery. As we move forward, we remain attentive to evolving liquidity conditions and will take appropriate steps as warranted by the economic outlook and risks." — FederalReserve.gov His emphasis on flexibility underscores the Fed's adaptation to economic risks rather than following preset strategies. Markets immediately responded with increased short-term volatility in cryptocurrencies like Bitcoin and Ethereum, as investors reassessed positions. Arthur Hayes, co-founder of BitMEX, commented that the Federal Reserve's potential liquidity tightening would likely preserve market volatility.
Insights from Coincu research suggest Powell's balance sheet remarks may curb crypto liquidity, given historical responses to Federal Reserve decisions. While stablecoin inflow indicates defensive posturing, further regulatory adjustments and repo rate fluctuations will dictate market trajectories.
Insights from Coincu research suggest Powell's balance sheet remarks may curb crypto liquidity, given historical responses to Federal Reserve decisions. While stablecoin inflow indicates defensive posturing, further regulatory adjustments and repo rate fluctuations will dictate market trajectories.
Today marked the first trading day of the week for many North American traders after Columbus Day for the US and the Canadian Thanksgiving — and the session opened with what felt like a long-weekend hangover.Overnight markets had reacted sharply to China’s condemnations regarding the escalating US-China trade tensions, notably hurting Oil markets even further.Despite Trump’s reassuring comments on Sunday, which helped risk assets rebound over the weekend and led to a bullish Monday session, sentiment reversed during the Asia session leading to a scary opening Bell.
Major indices gapped down, with the Nasdaq dropping 1.2% and cryptocurrencies also taking another hit after last week’s selloff.
Sentiment quickly shifted mid-morning after the rough open.
US Trade Representative Jamieson Greer downplayed some of the recent rhetoric between the two nations, triggering a rebound just 20 minutes after the open that carried momentum throughout the session.
By midday, all four major US indices had turned positive, erasing their early losses.

Despite the impressive rebound right after the open taking all indices to their weekly highs, there is are ongoing selloff waves in the Dow Jones and the S&P 500 to keep some eyes on. Nasdaq is not really reacting much for now and I am not spotting any headlines.The real bullish catalysts came around mid-day from Fed Chair Jerome Powell, whose dovish remarks at the National Association for Business Economics meeting brought further bullish momentum.
Powell’s comments raised questions about whether the Fed had early insights into the NFP data, as he emphasized that further labor market softening could justify additional easing.His tone cemented expectations for another rate cut by month-end, reinforcing the ongoing theme of things not being so bad after all despite the US-China trade scare.Still, the price action is looking more rangebound with the recent swings rather than back to fully bullish – Let’s take a closer look to the Dow Jones, Nasdaq and S&P 500.

Dow Jones 4H Chart

The Dow Jones led an impressive rebound today, lifted by decent earnings and a easier-path ahead when turning to Powell’s latest comments.
A few things to look going forward:
Dow Jones technical levels of interest
Resistance Levels
Support Levels
Nasdaq 4H Chart

The Tech-Heavy index hasn’t rebounded as strongly as its peers today on a relative change and is finding itself in a mixed technical environment.It is the second time that sellers appear at the key Momentum pivot around 24,800 showing how undecisive the price action is.Keep an eye on struggling names in tech like Nvidia: If they come back from here, Nasdaq should follow suit.If the big names keep getting offered, ther path ahead might be a bit more grim.
Nasdaq technical levels of interest
Resistance Levels
Support Levels
Similarly as the Nasdaq, sellers have appeared around the momentum pivot and the overall action might not be as bullish as it was the past few months – Keep an eye on sentiment.A pattern that emerges is the ongoing break-retest action of the main May upward channel – short term technicals are looking more neutral than anything for now.The price action will be interesting for the time to come, expect volatility.
S&P 500 Trading Levels:
Resistance Levels
Support Levels
728 RM B 7/F GEE LOK IND BLDG NO 34 HUNG TO RD KWUN TONG KLN HONG KONG


White Label
Data API
Web Plug-ins
Poster Maker
Affiliate Program
The risk of loss in trading financial instruments such as stocks, FX, commodities, futures, bonds, ETFs and crypto can be substantial. You may sustain a total loss of the funds that you deposit with your broker. Therefore, you should carefully consider whether such trading is suitable for you in light of your circumstances and financial resources.
No decision to invest should be made without thoroughly conducting due diligence by yourself or consulting with your financial advisors. Our web content might not suit you since we don't know your financial conditions and investment needs. Our financial information might have latency or contain inaccuracy, so you should be fully responsible for any of your trading and investment decisions. The company will not be responsible for your capital loss.
Without getting permission from the website, you are not allowed to copy the website's graphics, texts, or trademarks. Intellectual property rights in the content or data incorporated into this website belong to its providers and exchange merchants.
Not Logged In
Log in to access more features

FastBull Membership
Not yet
Purchase


Log In
Sign Up