

Markets
News
Analysis
User
24/7
Economic Calendar
Education
Data
- Names
- Latest
- Prev


Signal Accounts for Members
All Signal Accounts
All Contests
 France Industrial Output MoM (SA) (Oct)
A:--
F: --
France Trade Balance (SA) (Oct)A:--
F: --
 Euro Zone Employment YoY (SA) (Q3)
A:--
F: --
 Canada Part-Time Employment (SA) (Nov)
A:--
F: --
P: --
Canada Unemployment Rate (SA) (Nov)A:--
F: --
P: --
Canada Full-time Employment (SA) (Nov)A:--
F: --
P: --
Canada Labor Force Participation Rate (SA) (Nov)A:--
F: --
P: --
Canada Employment (SA) (Nov)A:--
F: --
P: --
 U.S. PCE Price Index MoM (Sept)
A:--
F: --
P: --
U.S. Personal Income MoM (Sept)A:--
F: --
P: --
U.S. Core PCE Price Index MoM (Sept)A:--
F: --
P: --
U.S. PCE Price Index YoY (SA) (Sept)A:--
F: --
P: --
U.S. Core PCE Price Index YoY (Sept)A:--
F: --
P: --
U.S. Personal Outlays MoM (SA) (Sept)A:--
F: --
U.S. 5-10 Year-Ahead Inflation Expectations (Dec)A:--
F: --
P: --
U.S. Real Personal Consumption Expenditures MoM (Sept)A:--
F: --
U.S. Weekly Total Rig CountA:--
F: --
P: --
U.S. Weekly Total Oil Rig CountA:--
F: --
P: --
U.S. Consumer Credit (SA) (Oct)A:--
F: --
 China, Mainland Foreign Exchange Reserves (Nov)
A:--
F: --
P: --
 Japan Trade Balance (Oct)
A:--
F: --
P: --
Japan Nominal GDP Revised QoQ (Q3)A:--
F: --
P: --
China, Mainland Imports YoY (CNH) (Nov)A:--
F: --
P: --
China, Mainland Exports (Nov)A:--
F: --
P: --
China, Mainland Imports (CNH) (Nov)A:--
F: --
P: --
China, Mainland Trade Balance (CNH) (Nov)A:--
F: --
P: --
China, Mainland Exports YoY (USD) (Nov)A:--
F: --
P: --
China, Mainland Imports YoY (USD) (Nov)A:--
F: --
P: --
 Germany Industrial Output MoM (SA) (Oct)
A:--
F: --
Euro Zone Sentix Investor Confidence Index (Dec)A:--
F: --
P: --
Canada National Economic Confidence Index--
F: --
P: --
 U.K. BRC Like-For-Like Retail Sales YoY (Nov)
--
F: --
P: --
U.K. BRC Overall Retail Sales YoY (Nov)--
F: --
P: --
 Australia Overnight (Borrowing) Key Rate
--
F: --
P: --
RBA Rate Statement RBA Press Conference Germany Exports MoM (SA) (Oct)--
F: --
P: --
U.S. NFIB Small Business Optimism Index (SA) (Nov)--
F: --
P: --
 Mexico 12-Month Inflation (CPI) (Nov)
--
F: --
P: --
Mexico Core CPI YoY (Nov)--
F: --
P: --
Mexico PPI YoY (Nov)--
F: --
P: --
U.S. Weekly Redbook Index YoY--
F: --
P: --
U.S. JOLTS Job Openings (SA) (Oct)--
F: --
P: --
China, Mainland M1 Money Supply YoY (Nov)--
F: --
P: --
China, Mainland M0 Money Supply YoY (Nov)--
F: --
P: --
China, Mainland M2 Money Supply YoY (Nov)--
F: --
P: --
U.S. EIA Short-Term Crude Production Forecast For The Year (Dec)--
F: --
P: --
U.S. EIA Natural Gas Production Forecast For The Next Year (Dec)--
F: --
P: --
U.S. EIA Short-Term Crude Production Forecast For The Next Year (Dec)--
F: --
P: --
EIA Monthly Short-Term Energy Outlook U.S. API Weekly Gasoline Stocks--
F: --
P: --
U.S. API Weekly Cushing Crude Oil Stocks--
F: --
P: --
U.S. API Weekly Crude Oil Stocks--
F: --
P: --
U.S. API Weekly Refined Oil Stocks--
F: --
P: --
 South Korea Unemployment Rate (SA) (Nov)
--
F: --
P: --
Japan Reuters Tankan Non-Manufacturers Index (Dec)--
F: --
P: --
Japan Reuters Tankan Manufacturers Index (Dec)--
F: --
P: --
Japan Domestic Enterprise Commodity Price Index MoM (Nov)--
F: --
P: --
Japan Domestic Enterprise Commodity Price Index YoY (Nov)--
F: --
P: --
China, Mainland PPI YoY (Nov)--
F: --
P: --

No matching data
Latest Views
Latest Views
Trending Topics
Top Columnists
Latest Update
White Label
Data API
Web Plug-ins
Affiliate Program
View All
No data
Bank of America (BofA) had expected a 150,000-plus increase, above expectations, anticipating resilience in the labor market. The bank says this could prompt the Fed to keep interest rates steady for an extended period. BofA analysts say markets are more focused on the “recession side of stagflation.”
The economic data expected to be released in the US has finally been shared:
According to LSEG data, employment growth expectations ranged from 75,000 to 190,000.
In a Reuters poll, the market expectation was 130,000, a significant drop from the 177,000 figure released in April. The unemployment rate was expected to remain stable at 4.2%.
Bank of America (BofA) had expected a 150,000-plus increase, above expectations, anticipating resilience in the labor market. The bank says this could prompt the Fed to keep interest rates steady for an extended period. BofA analysts say markets are more focused on the “recession side of stagflation.”
On the other hand, UBS Chief Economist Paul Donovan said that many forecasts were below market expectations. “Companies may have slowed hiring due to uncertainty about trade policies. However, this is unlikely to lead to an increase in layoffs. This means that rate cuts will have limited impact at the moment. However, if consumer demand weakens, rate cuts will become more critical,” Donovan said.
The dollar was headed for a weekly loss on Friday, undermined by signs of fragility in the U.S. economy and little progress on trade negotiations between Washington and its partners, ahead of a critical jobs report.
The U.S. nonfarm payrolls report expected later on will draw greater scrutiny after a slew of weaker-than-expected economic data this week underscored that President Donald Trump's tariffs were taking a toll on the economy.
Analysts say the data so far has indicated that the U.S. economy faces a period of increasing price pressures and slowing growth, which could complicate Federal Reserve monetary policy, even as Trump has been critical of the institution's cautious stance.
Job growth likely slowed considerably in May as businesses struggled with headwinds from tariff uncertainty, but probably not enough to budge a cautious Federal Reserve.
Economists polled by Reuters forecast the U.S. economy created 130,000 new jobs in May versus 177,000 in April, while average earnings are expected to have increased marginally month-on-month.
"We will be watching the wages growth data today very closely. If there is no major surprise to the upside we think that a weak report could eventually boost expectations of Fed rate cuts," said Ipek Ozkardeskaya, senior market analyst at Swissquote Bank said.
"The Fed expectations are massively dependent on the inflation trajectory and the inflation trajectory seems higher these days."
Friday's U.S. jobs data would likely be the next catalyst for currencies, at a time when investors have questioned the dollar's prized safe-haven status.
The yenslipped 0.35% to 144.12 per dollar in choppy trading, while the Swiss francdipped to 0.82.
Sterlingslipped 0.18% at around $1.35 having scaled a more than three-year peak in the previous session, and was set to rise about 0.6% for the week.
Against a basket of currencies, the dollaredged up to 98.9, and was headed for a weekly loss of 0.5%.
The eurowas taking a breather after hitting a 1-1/2-month top on Thursday following hawkish remarks from the European Central Bank. It last bought roughly $1.1423, down just 0.18% on the day.
Traders have pushed back expectations on the timing of the next rate cut, but continue to anticipate a 25-basis point reduction by year-end. (0#EURIRPR)
Deutsche Bank's Mark Wall said he still expects 50 basis points worth of ECB rate cuts, adding "it is still too early to judge the impact of the trade war, and the path of the trade war is in any case still inherently unpredictable."
Reflecting a struggling economy, data showed that German exports and industrial output fell more than expected in April.
Most currencies had surged against the dollar late on Thursday, helped by news that Trump and Chinese President Xi Jinping spoke on a call for more than an hour, before paring some of their gains.
Investors remain worried about U.S. trade negotiations and the lack of progress in hashing out deals ahead of an early July deadline.
The highly anticipated call between Trump and Xi also provided little clarity and the spotlight on it was quickly stolen by a public fallout between Trump and Elon Musk.
Elsewhere, cryptocurrency dogecoin (DOGE=KRKN), often supported by Musk, was a touch firmer after falling to a one-month low on Thursday.
Bitcoinjumped 3.4% to $103,942, rebounding from Thursday's one-month low. Ethersimilarly rose 3.8% to $2,490.57.
"Despite escalating U.S.-China tensions, including expanded tech sanctions and higher steel tariffs, bitcoin has remained resilient," said Gracie Lin, OKX's Singapore CEO.
The crypto market cap’s 2.01% slip to the $3.22 trillion mark has pushed the assets into a mixed sentiment. All the major asset prices are charted in red. Assets like Bitcoin (BTC) and Ethereum (ETH) have chosen to trade on the downside. The largest altcoin, Ethereum, has suddenly plummeted by over 5.65% and lost its recent gains.
ETH bears could likely build a negative trend line, and further downside correction brings in more losses. A bullish shift might occur only after the altcoin climbs above the $2.6K mark.
In the early hours, the bulls in command have pushed the ETH price to its daily high at the $2,640.60 range. Later, it steeply fell to the bottom level of $2,387.61 as the bears reclaimed the momentum. Ethereum is currently traded at around $2,462.74, with a market cap of $297 billion.
Notably, the daily trading volume has increased by over 66.23%, reaching $28.13 billion. As per Coinglass data, the market has witnessed a liquidation of $284.94 million worth of Ethereum.
The ETH/USDT trading pair’s Moving Average Convergence Divergence (MACD) line and signal line have crossed below the zero line. This crossover typically indicates the negative momentum in the market. It may drive the price to stay under the bearish pressure. Moreover, the Chaikin Money Flow (CMF) indicator value found at -0.14 suggests moderate selling pressure, and the money is flowing out rather than in.
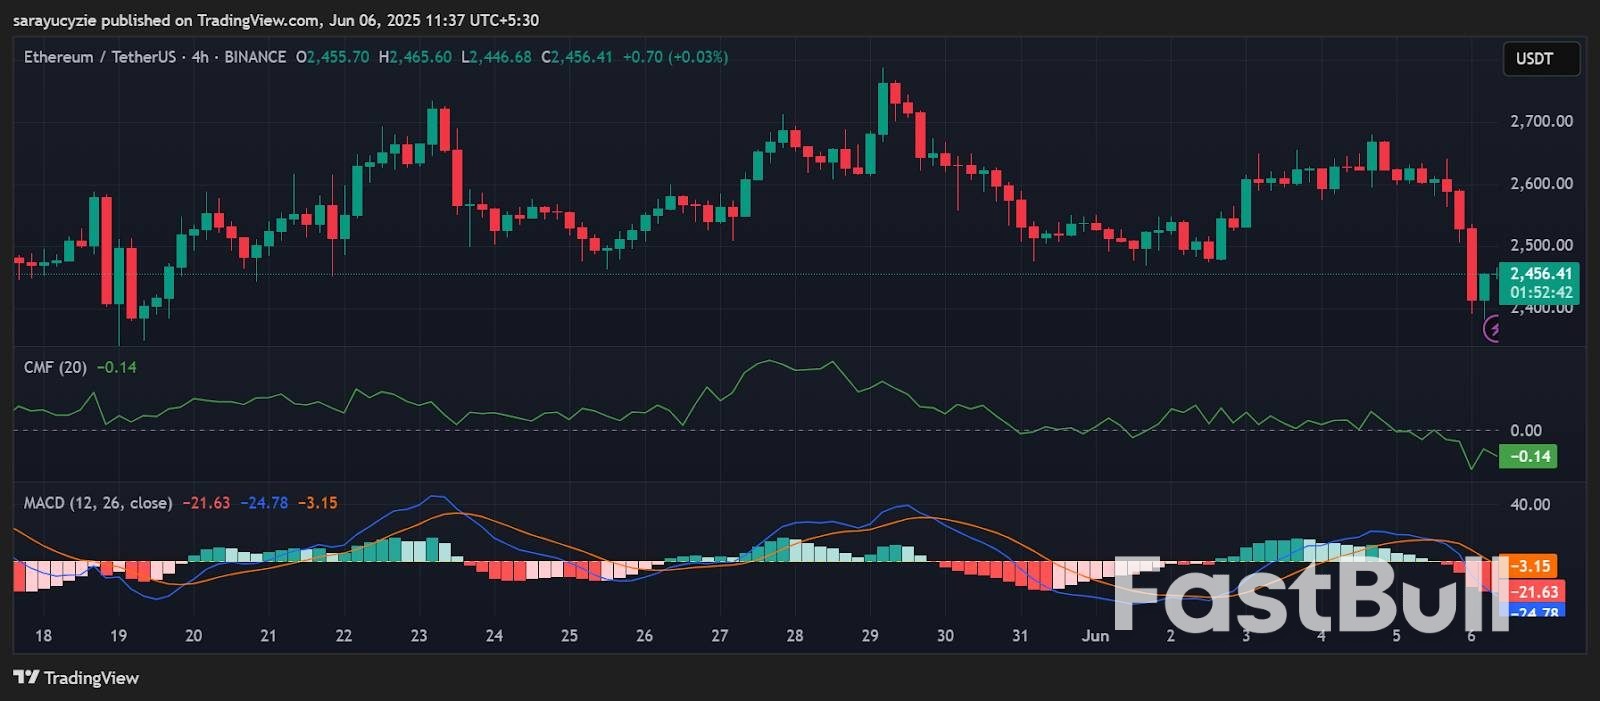 ETH chart (Source: TradingView)
If ETH’s active downtrend stays, the price could fall to the nearby support at the $2,425 range. An extended correction on the downside might likely trigger the death cross to unfold. The potential bears of Ethereum push the price to steadily plunge toward $2,407 or even lower.
On the upside, assuming the asset’s current momentum shifted gear, entering the bullish zone, ETH could test the key resistance at the level of $2,480. A potent upside correction might invite the golden cross to support the price movement, sending Ethereum to the $2.5K threshold.
In addition, ETH’s Bull Bear Power (BBP) value staying at -164.43 signals a strong bearish momentum in the market, pushing prices below. The downturn may continue until a reversal emerges. The asset’s daily relative strength index (RSI) of 36.02 points to the approaching oversold zone, with the potential of continued weakness.
The US Dollar is vulnerable as leading indicators point to a near-expectation reading in this month’s NFP report, with headline job growth potentially coming in somewhere in the 115-150K range.
When is the May NFP Report?
The May NFP report will be released on Friday, June 6, at 8:30 ET.
NFP Report Expectations
Traders and economists expect the NFP report to show that the US created 127K net new jobs, with average hourly earnings rising 0.3% m/m (3.7% y/y) and the U3 unemployment rate holding steady at 4.2%.
After years of consistent strength, there are finally early signs of cracks in the US labor market.
In addition the classic U3 unemployment rate nearing its highest level in 2.5 years, we’ve also seen a deterioration in the ADP employment report, an uptick in initial unemployment claims, and persistently high continuing claims figures, signaling that while layoffs haven’t necessarily surged, it’s increasingly difficult for unemployed workers to secure a new job.
Employment is classically a lagging indicator for the underlying performance of the economy, but if that lagging indicator starts to deteriorate this summer, it could cement a slowdown into the second half of the year.
When it comes to this month’s jobs report, expectations are for +127K jobs, with the unemployment rate to hold steady at 4.2%. One key area to watch will be the average hourly earnings measure, which is expected to come in unchanged from last month at 0.3% m/m:
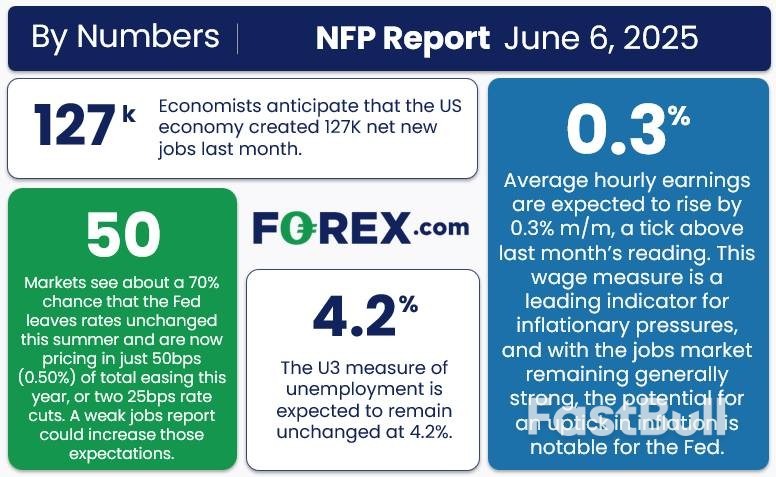
As the lower left box below suggests, traders now expect just two interest rate cuts from the Federal Reserve this year, though the central bank is likely to remain on hold through the summer barring a huge surprise.
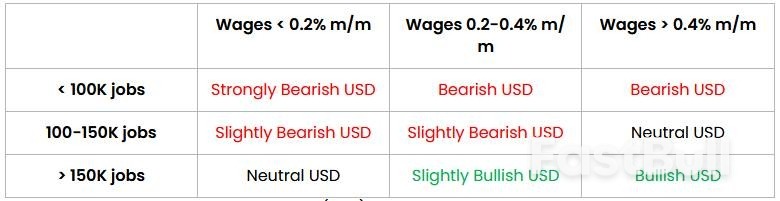
As regular readers know, we focus on four historically reliable leading indicators to help handicap each month’s NFP report:
Weighing the data and our internal models, the leading indicators point to a near-expectations reading in this month’s NFP report, with headline job growth potentially coming in somewhere in the 115-150K range, albeit with a big band of uncertainty given the current global backdrop.
Regardless, the month-to-month fluctuations in this report are notoriously difficult to predict, so we wouldn’t put too much stock into any forecasts (including ours). As always, the other aspects of the release, prominently including the closely-watched average hourly earnings figure which came in at 0.2% m/m in the most recent NFP report.
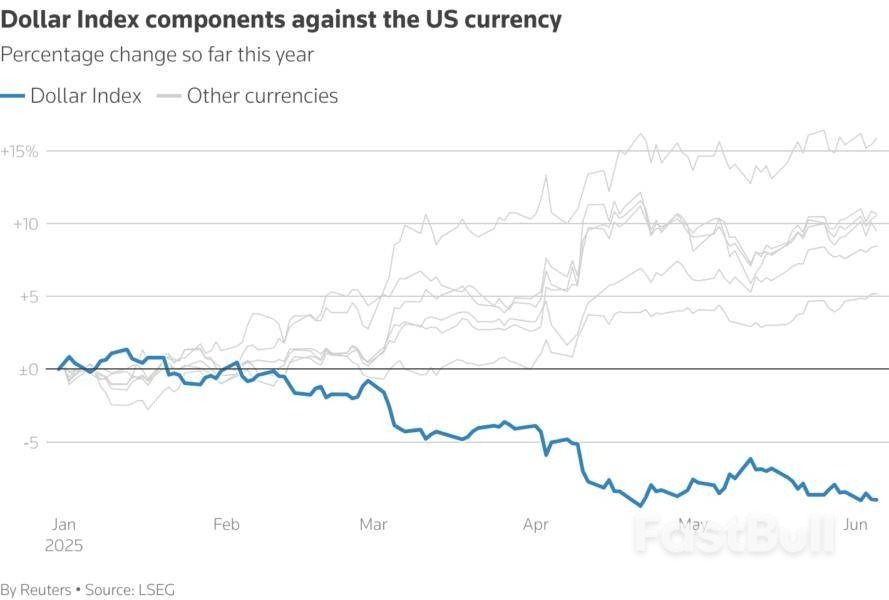
As we outline below, the US Dollar Index has seen its counter-trend bounce peter out, and the world’s reserve currency could be poised to extend its downtrend to 3+ year lows if the labor market deteriorates further.
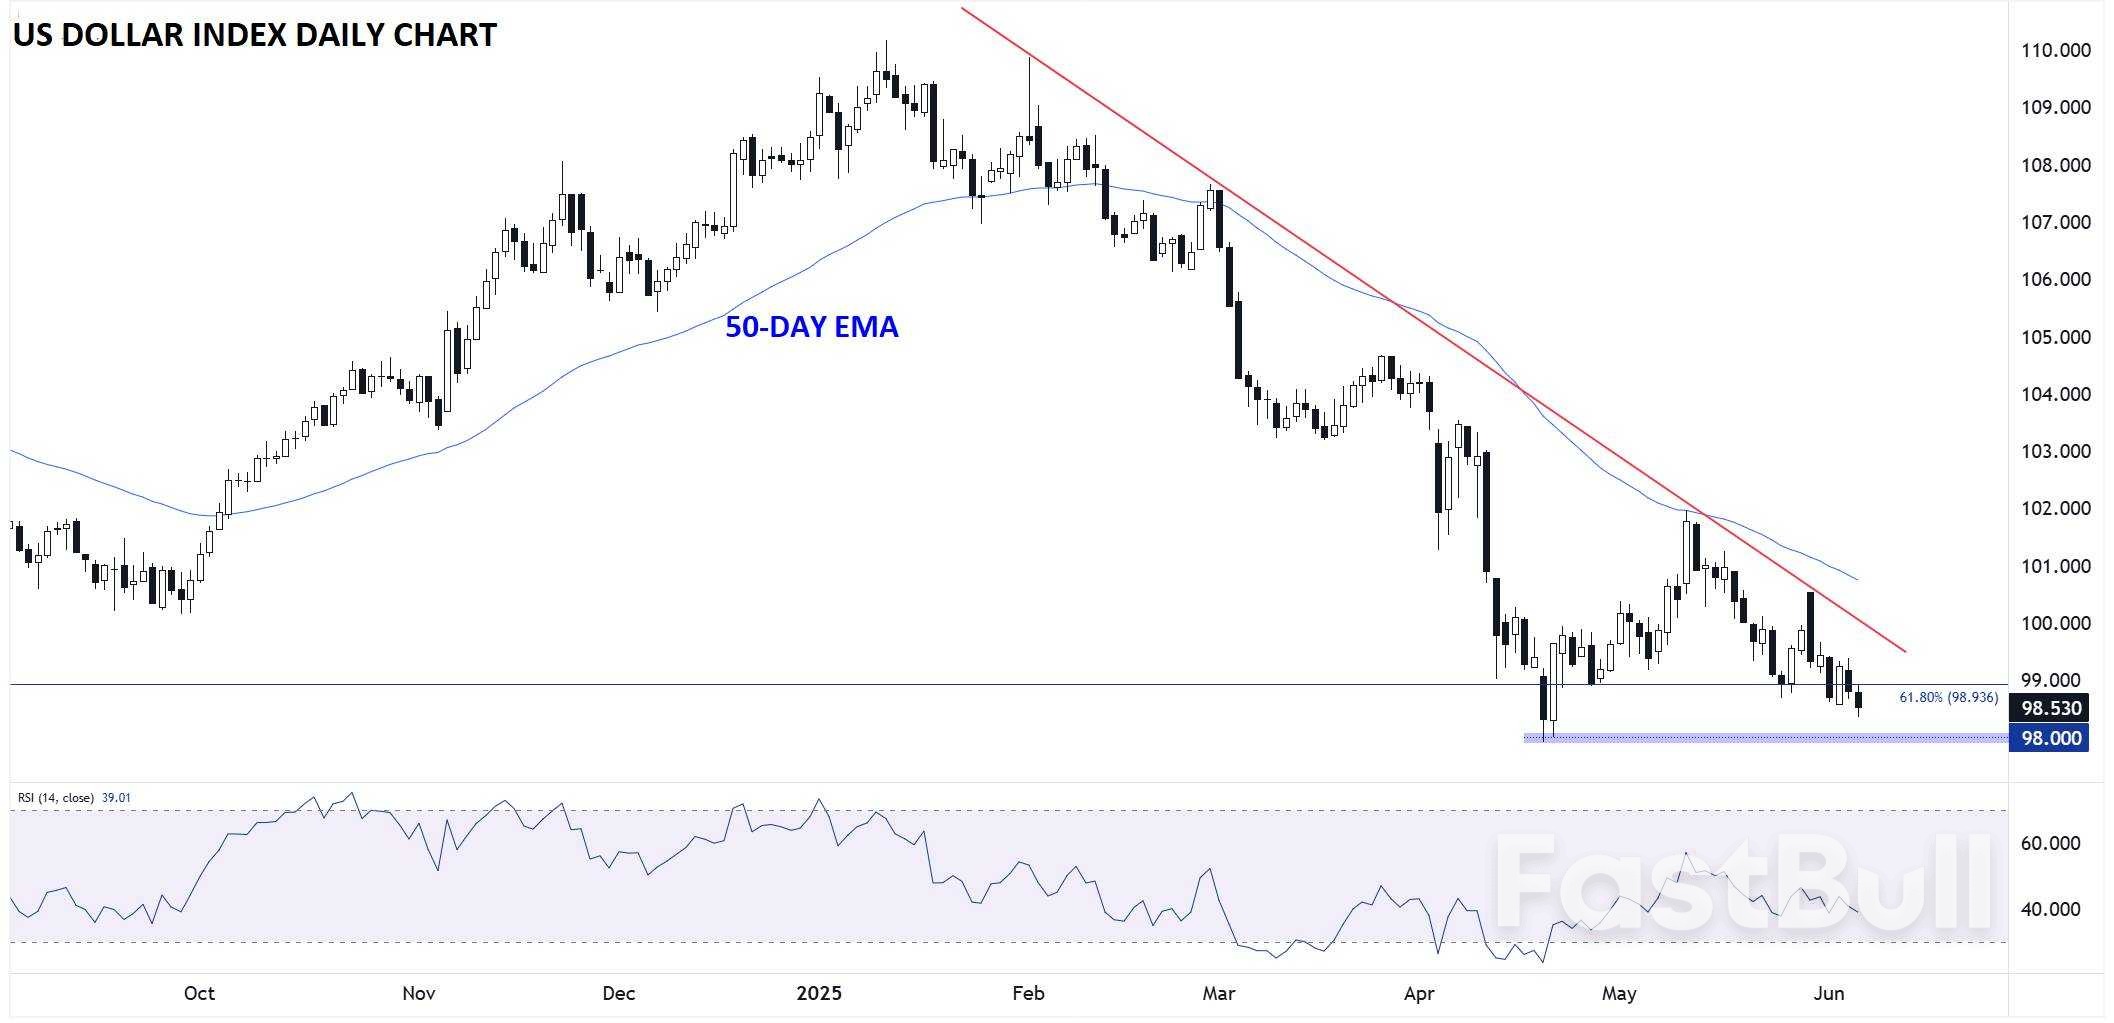
The US Dollar Index (DXY) bounced through the first half of May before rolling back above to approach 3+ year lows near 98.00 as we go to press. The counter-trend bounce alleviated the oversold condition on the 14-day RSI, potentially setting the stage for another leg lower, especially if the jobs report comes in weaker than anticipated.
While the jobs market is likely to be increasingly important in driving the Federal Reserve’s decisions as we move through the year, tariff headlines and any potential trade deals (especially with China) may be bigger market movers in the near term.
Technically speaking, the April low around 98.00 is the most important support level to watch, whereas the nearest clear level of topside resistance comes from the descending bearish trend line closer to 100.00. Even if we do see a bounce on a stronger-than-anticipated jobs report, bears may look to sell any rallies to join the ongoing downtrend at a more favorable price.
Russia will take years to replace nuclear-capable bomber planes that were hit in Ukrainian drone strikes last weekend, according to Western military aviation experts, straining a modernisation programme that is already delayed.
Satellite photos of airfields in Siberia and Russia's far north show extensive damage from the attacks, with several aircraft completely burnt out, although there are conflicting versions of the total number destroyed or damaged.
The United States assesses that up to 20 warplanes were hit - around half the number estimated by Ukrainian President Volodymyr Zelenskiy - and around 10 were destroyed, two U.S. officials told Reuters.
The Russian government on Thursday denied that any planes were destroyed and said the damage would be repaired, but Russian military bloggers have spoken of loss or serious damage to about a dozen planes, accusing commanders of negligence.
Thestrikes- prepared over 18 months in a Ukrainian intelligence operation dubbed "Spider's Web", and conducted by drones that were smuggled close to the bases in trucks - dealt a powerful symbolic blow to a country that, throughout the Ukraine war, has frequently reminded the world of its nuclear might.
In practice, experts said, they will not seriously affect Russia's nuclear strike capability which is largely comprised of ground- and submarine-based missiles.
However, the Tu-95MS Bear-H and Tu-22M3 Backfire bombers that were hit were part of a long-range aviation fleet that Russia has used throughout the war to fire conventional missiles at Ukrainian cities, defence plants, military bases, power infrastructure and other targets, said Justin Bronk, an aviation expert at the RUSI think tank in London.
The same fleet had also been carrying out periodic patrol flights into the Arctic, North Atlantic and northern Pacific as a show of strength to deter Russia's Western adversaries.
Bronk said that at the outset of its 2022 invasion of Ukraine, Russia was operating a fleet of 50-60 Bear-Hs and around 60 Backfires, alongside around 20 Tu-160M nuclear-capable Blackjack heavy bombers.
He estimated that Russia has now lost more than 10% of the combined Bear-H and Backfire fleet, taking into account last weekend's attacks and the loss of several planes earlier in the war - one shot down and the others struck while on the ground.
These losses "will put major pressure on a key Russian force that was already operating at maximum capacity," Bronk told Reuters.
Russia's defence ministry did not immediately reply to a request for comment.
Replacing the planes will be challenging. Both the Bear H and the Backfire are aircraft that were designed in the Soviet era and have been out of production for decades, said Douglas Barrie, aerospace expert at the International Institute for Strategic Studies in London, although existing planes have been upgraded over the years.
Barrie said that building new ones like-for-like was therefore very unlikely, and it was unclear whether Russia had any useable spare airframes of either type.
Western sanctions against Russia have aimed to restrict the import of components such as microprocessors that are vital to avionics systems, although Moscow has so far been comparatively successful at finding alternative sources, Barrie added.
Russia has been modernising its Blackjack bomber fleet, and Putin sent a pointed signal to the West last year by taking a 30-minute flight in one such aircraft and pronouncing it ready for service.
But production of new Blackjacks is slow - one Russian military blogger this week put it at four per year - and Western experts say progress in developing Russia's next-generation PAK DA bomber has also been moving at a crawl.
The Federation of American Scientists (FAS) said in a report last month that Russia had signed a contract with manufacturer Tupolev in 2013 to build the PAK DA, but cited Russian media reports as saying state test flights are not scheduled until next year, with initial production to begin in 2027.
While it would be logical for Russia to try to speed up its PAK DA plans, it may not have the capacity, said Hans Kristensen, director of the Nuclear Information Project at the FAS. He said in a telephone interview that Russia is facing delays with a range of other big defence projects including its new Sarmat intercontinental ballistic missile.
RUSI's Bronk was also sceptical of Moscow's chances of accelerating the timeline for the next-generation bomber.
"Russia will struggle to deliver the PAK DA programme at all in the coming five years, let alone accelerate it, due to budgetary shortfalls and materials and technology constraints on industry due to sanctions," he said.

Oil prices remained steadfastly glued to $65 a barrel, as they have been for more than three weeks, with easing trade tensions helping offset concerns about a brewing supply glut later this year.
Brent inched lower, but held on to most of its gains from Thursday and was on track for its first weekly increase since mid-May. President Donald Trump and his Chinese counterpart, Xi Jinping, agreed to further trade talks over tariffs and supplies of rare earth minerals.
The positive signals come against the backdrop of an oil market that has been increasingly rangebound over recent weeks. Prices have traded in a $4 band since the middle of May and a gauge of volatility for US crude futures is at the lowest level since early April.
Oil has been buffeted in Trump’s second term, as trade tensions between the world’s two largest economies menace demand. At the same time, the OPEC+ alliance has been adding barrels back to the market at a faster-than-expected rate, further clouding an already weak outlook for the second half of the year.
“The market looks balanced in 2Q/3Q on our estimates as oil demand rises in summer and peaks in July-August, matching supply increases from OPEC+,” HSBC analysts including Kim Fustier wrote. “Deteriorating fundamentals after summer raise downside risks to oil prices.”
728 RM B 7/F GEE LOK IND BLDG NO 34 HUNG TO RD KWUN TONG KLN HONG KONG


White Label
Data API
Web Plug-ins
Poster Maker
Affiliate Program
The risk of loss in trading financial instruments such as stocks, FX, commodities, futures, bonds, ETFs and crypto can be substantial. You may sustain a total loss of the funds that you deposit with your broker. Therefore, you should carefully consider whether such trading is suitable for you in light of your circumstances and financial resources.
No decision to invest should be made without thoroughly conducting due diligence by yourself or consulting with your financial advisors. Our web content might not suit you since we don't know your financial conditions and investment needs. Our financial information might have latency or contain inaccuracy, so you should be fully responsible for any of your trading and investment decisions. The company will not be responsible for your capital loss.
Without getting permission from the website, you are not allowed to copy the website's graphics, texts, or trademarks. Intellectual property rights in the content or data incorporated into this website belong to its providers and exchange merchants.
Not Logged In
Log in to access more features

FastBull Membership
Not yet
Purchase


Log In
Sign Up


