• Trade
  • Markets
  • Copy
  • Contests
  • News
  • 24/7
  • Calendar
  • Q&A
  • Chats
Trending
Screeners
SYMBOL
LAST
BID
ASK
HIGH
LOW
NET CHG.
%CHG.
SPREAD
SPX
S&P 500 Index
6827.42
6827.42
6827.42
6899.86
6801.80
-73.58
-1.07%
--
DJI
Dow Jones Industrial Average
48458.04
48458.04
48458.04
48886.86
48334.10
-245.98
-0.51%
--
IXIC
NASDAQ Composite Index
23195.16
23195.16
23195.16
23554.89
23094.51
-398.69
-1.69%
--
USDX
US Dollar Index
97.950
98.030
97.950
98.500
97.950
-0.370
-0.38%
--
EURUSD
Euro / US Dollar
1.17394
1.17409
1.17394
1.17496
1.17192
+0.00011
+ 0.01%
--
GBPUSD
Pound Sterling / US Dollar
1.33707
1.33732
1.33707
1.33997
1.33419
-0.00148
-0.11%
--
XAUUSD
Gold / US Dollar
4299.39
4299.39
4299.39
4353.41
4257.10
+20.10
+ 0.47%
--
WTI
Light Sweet Crude Oil
57.233
57.485
57.233
58.011
56.969
-0.408
-0.71%
--

Community Accounts

Signal Accounts
--
Profit Accounts
--
Loss Accounts
--
View More

Become a signal provider

Sell trading signals to earn additional income

View More

Guide to Copy Trading

Get started with ease and confidence

View More

Signal Accounts for Members

All Signal Accounts

Best Return
  • Best Return
  • Best P/L
  • Best MDD
Past 1W
  • Past 1W
  • Past 1M
  • Past 1Y

All Contests

  • All
  • Trump Updates
  • Recommend
  • Stocks
  • Cryptocurrencies
  • Central Banks
  • Featured News
Top News Only
Share

Norwegian Nobel Committee: Calls On The Belarusian Authorities To Release All Political Prisoners

Share

Norwegian Nobel Committee: His Freedom Is A Deeply Welcome And Long-Awaited Moment

Share

Ukraine Says It Received 114 Prisoners From Belarus

Share

USA Embassy In Lithuania: Maria Kalesnikava Is Not Going To Vilnius

Share

USA Embassy In Lithuania: Other Prisoners Are Being Sent From Belarus To Ukraine

Share

Ukraine President Zelenskiy: Five Ukrainians Released By Belarus In US-Brokered Deal

Share

USA Vilnius Embassy: USA Stands Ready For "Additional Engagement With Belarus That Advances USA Interests"

Share

USA Vilnius Embassy: Belarus, USA, Other Citizens Among The Prisoners Released Into Lithuania

Share

USA Vilnius Embassy: USA Will Continue Diplomatic Efforts To Free The Remaining Political Prisoners In Belarus

Share

USA Vilnius Embassy: Belarus Releases 123 Prisoners Following Meeting Of President Trump's Envoy Coale And Belarus President Lukashenko

Share

USA Vilnius Embassy: Masatoshi Nakanishi, Aliaksandr Syrytsa Are Among The Prisoners Released By Belarus

Share

USA Vilnius Embassy: Maria Kalesnikava And Viktor Babaryka Are Among The Prisoners Released By Belarus

Share

USA Vilnius Embassy: Nobel Peace Prize Laureate Ales Bialiatski Is Among The Prisoners Released By Belarus

Share

Belarusian Presidential Administration Telegram Channel: Lukashenko Has Pardoned 123 Prisoners As Part Of Deal With US

Share

Two Local Syrian Officials: Joint US-Syrian Military Patrol In Central Syria Came Under Fire From Unknown Assailants

Share

Israeli Military Says It Targeted 'Key Hamas Terrorist' In Gaza City

Share

Rwanda's Actions In Eastern Drc Are A Clear Violation Of Washington Accords Signed By President Trump - Secretary Of State Rubio

Share

Israeli Military Issues Evacuation Warning In Southern Lebanon Village Ahead Of Strike - Spokesperson On X

Share

Belarusian State Media Cites US Envoy Coale As Saying He Discussed Ukraine And Venezuela With Lukashenko

Share

Belarusian State Media Cites US Envoy Coale As Saying That US Removes Sanctions On Belarusian Potassium

TIME
ACT
FCST
PREV
U.K. Trade Balance Non-EU (SA) (Oct)

A:--

F: --

P: --

U.K. Trade Balance (Oct)

A:--

F: --

P: --

U.K. Services Index MoM

A:--

F: --

P: --

U.K. Construction Output MoM (SA) (Oct)

A:--

F: --

P: --

U.K. Industrial Output YoY (Oct)

A:--

F: --

P: --

U.K. Trade Balance (SA) (Oct)

A:--

F: --

P: --

U.K. Trade Balance EU (SA) (Oct)

A:--

F: --

P: --

U.K. Manufacturing Output YoY (Oct)

A:--

F: --

P: --

U.K. GDP MoM (Oct)

A:--

F: --

P: --

U.K. GDP YoY (SA) (Oct)

A:--

F: --

P: --

U.K. Industrial Output MoM (Oct)

A:--

F: --

P: --

U.K. Construction Output YoY (Oct)

A:--

F: --

P: --

France HICP Final MoM (Nov)

A:--

F: --

P: --

China, Mainland Outstanding Loans Growth YoY (Nov)

A:--

F: --

P: --

China, Mainland M2 Money Supply YoY (Nov)

A:--

F: --

P: --

China, Mainland M0 Money Supply YoY (Nov)

A:--

F: --

P: --

China, Mainland M1 Money Supply YoY (Nov)

A:--

F: --

P: --

India CPI YoY (Nov)

A:--

F: --

P: --

India Deposit Gowth YoY

A:--

F: --

P: --

Brazil Services Growth YoY (Oct)

A:--

F: --

P: --

Mexico Industrial Output YoY (Oct)

A:--

F: --

P: --

Russia Trade Balance (Oct)

A:--

F: --

P: --

Philadelphia Fed President Henry Paulson delivers a speech
Canada Building Permits MoM (SA) (Oct)

A:--

F: --

P: --

Canada Wholesale Sales YoY (Oct)

A:--

F: --

P: --

Canada Wholesale Inventory MoM (Oct)

A:--

F: --

P: --

Canada Wholesale Inventory YoY (Oct)

A:--

F: --

P: --

Canada Wholesale Sales MoM (SA) (Oct)

A:--

F: --

P: --

Germany Current Account (Not SA) (Oct)

A:--

F: --

P: --

U.S. Weekly Total Rig Count

A:--

F: --

P: --

U.S. Weekly Total Oil Rig Count

A:--

F: --

P: --

Japan Tankan Large Non-Manufacturing Diffusion Index (Q4)

--

F: --

P: --

Japan Tankan Small Manufacturing Outlook Index (Q4)

--

F: --

P: --

Japan Tankan Large Non-Manufacturing Outlook Index (Q4)

--

F: --

P: --

Japan Tankan Large Manufacturing Outlook Index (Q4)

--

F: --

P: --

Japan Tankan Small Manufacturing Diffusion Index (Q4)

--

F: --

P: --

Japan Tankan Large Manufacturing Diffusion Index (Q4)

--

F: --

P: --

Japan Tankan Large-Enterprise Capital Expenditure YoY (Q4)

--

F: --

P: --

U.K. Rightmove House Price Index YoY (Dec)

--

F: --

P: --

China, Mainland Industrial Output YoY (YTD) (Nov)

--

F: --

P: --

China, Mainland Urban Area Unemployment Rate (Nov)

--

F: --

P: --

Saudi Arabia CPI YoY (Nov)

--

F: --

P: --

Euro Zone Industrial Output YoY (Oct)

--

F: --

P: --

Euro Zone Industrial Output MoM (Oct)

--

F: --

P: --

Canada Existing Home Sales MoM (Nov)

--

F: --

P: --

Euro Zone Total Reserve Assets (Nov)

--

F: --

P: --

U.K. Inflation Rate Expectations

--

F: --

P: --

Canada National Economic Confidence Index

--

F: --

P: --

Canada New Housing Starts (Nov)

--

F: --

P: --

U.S. NY Fed Manufacturing Employment Index (Dec)

--

F: --

P: --

U.S. NY Fed Manufacturing Index (Dec)

--

F: --

P: --

Canada Core CPI YoY (Nov)

--

F: --

P: --

Canada Manufacturing Unfilled Orders MoM (Oct)

--

F: --

P: --

Canada Manufacturing New Orders MoM (Oct)

--

F: --

P: --

Canada Core CPI MoM (Nov)

--

F: --

P: --

Canada Manufacturing Inventory MoM (Oct)

--

F: --

P: --

Canada CPI YoY (Nov)

--

F: --

P: --

Canada CPI MoM (Nov)

--

F: --

P: --

Canada CPI YoY (SA) (Nov)

--

F: --

P: --

Canada Core CPI MoM (SA) (Nov)

--

F: --

P: --

Q&A with Experts
    • All
    • Chatrooms
    • Groups
    • Friends
    Connecting
    .
    .
    .
    Type here...
    Add Symbol or Code

      No matching data

      All
      Trump Updates
      Recommend
      Stocks
      Cryptocurrencies
      Central Banks
      Featured News
      • All
      • Russia-Ukraine Conflict
      • Middle East Flashpoint
      • All
      • Russia-Ukraine Conflict
      • Middle East Flashpoint
      Search
      Products

      Charts Free Forever

      Chats Q&A with Experts
      Screeners Economic Calendar Data Tools
      Membership Features
      Data Warehouse Market Trends Institutional Data Policy Rates Macro

      Market Trends

      Market Sentiment Order Book Forex Correlations

      Top Indicators

      Charts Free Forever
      Markets

      News

      News Analysis 24/7 Columns Education
      From Institutions From Analysts
      Topics Columnists

      Latest Views

      Latest Views

      Trending Topics

      Top Columnists

      Latest Update

      Signals

      Copy Rankings Latest Signals Become a signal provider AI Rating
      Contests
      Brokers

      Overview Brokers Assessment Rankings Regulators News Claims
      Broker listing Forex Brokers Comparison Tool Live Spread Comparison Scam
      Q&A Complaint Scam Alert Videos Tips to Detect Scam
      More

      Business
      Events
      Careers About Us Advertising Help Center

      White Label

      Data API

      Web Plug-ins

      Affiliate Program

      Awards Institution Evaluation IB Seminar Salon Event Exhibition
      Vietnam Thailand Singapore Dubai
      Fans Party Investment Sharing Session
      FastBull Summit BrokersView Expo
      Recent Searches
        Top Searches
          Markets
          News
          Analysis
          User
          24/7
          Economic Calendar
          Education
          Data
          • Names
          • Latest
          • Prev

          View All

          No data

          Scan to Download

          Faster Charts, Chat Faster!

          Download App
          English
          • English
          • Español
          • العربية
          • Bahasa Indonesia
          • Bahasa Melayu
          • Tiếng Việt
          • ภาษาไทย
          • Français
          • Italiano
          • Türkçe
          • Русский язык
          • 简中
          • 繁中
          Open Account
          Search
          Products
          Charts Free Forever
          Markets
          News
          Signals

          Copy Rankings Latest Signals Become a signal provider AI Rating
          Contests
          Brokers

          Overview Brokers Assessment Rankings Regulators News Claims
          Broker listing Forex Brokers Comparison Tool Live Spread Comparison Scam
          Q&A Complaint Scam Alert Videos Tips to Detect Scam
          More

          Business
          Events
          Careers About Us Advertising Help Center

          White Label

          Data API

          Web Plug-ins

          Affiliate Program

          Awards Institution Evaluation IB Seminar Salon Event Exhibition
          Vietnam Thailand Singapore Dubai
          Fans Party Investment Sharing Session
          FastBull Summit BrokersView Expo

          Japan Risks Higher Tariffs If It Shuns Trump’s Investment Picks

          James Whitman

          Economic

          Summary:

          Japan risks having to pay higher tariffs if it doesn’t fund US President Donald Trump’s investment recommendations, according to a document fleshing out a $550 billion funding initiative agreed by the two nations in July.

          Japan risks having to pay higher tariffs if it doesn’t fund US President Donald Trump’s investment recommendations, according to a document fleshing out a $550 billion funding initiative agreed by the two nations in July.

          Trump will pick investment projects based on recommendations from an investment committee led by US Commerce Secretary Howard Lutnick, according to an Understanding of Memorandum of the investment mechanism signed by Lutnick and his Japanese counterpart Ryosei Akazawa in Washington on Thursday.

          The investment committee will incorporate input from Japan via a separate panel, with investments to be made up to Jan. 19, 2029, the memorandum said, a time frame that coincides with Trump’s presidential term.

          “The idea is to build supply chains within the United States,” Akazawa said in Washington on Thursday evening. “Therefore, it is only natural that the US side’s intentions, and more specifically, President Trump’s intentions, are strongly reflected.”

          The memorandum provides more details of how Japan will be obligated to supply funds for Trump’s investment choices than has so far been indicated by Japanese officials. Akazawa said there was no change from July in the details agreed.

          The investment fund forms part of a trade deal agreed with the US that limits universal duties on Japanese goods and sectoral tariffs on the auto sector to 15%. The Trump administration has included similar funding arrangements in other trade deals too, including the US agreement with South Korea.

          While the US-Japan deal was struck on July 22, the auto tariffs had remained at 27.5% while existing duties were still being charged on top of the new tariffs imposed this year. Trump signed an executive order Thursday to lower the duties to 15% and stop the stacking up of tariffs, a move that delivers embattled Japanese Prime Minister Shigeru Ishiba a limited success as he tries to hold on to power in Tokyo amid calls for him to resign.

          The memorandum states that the US does not intend to raise tariffs provided Japan faithfully implements it and doesn’t fail to provide funding. The US president would determine the tariff rate should that option be taken in the case of Japan choosing not to fund a project.

          Japan will need to make funds denominated in dollars available within 45 days of an investment project being presented for review, the memorandum states. Separate Special Purpose Vehicles will be set up for each investment.

          “Each Investment SPV will be managed and governed by the United States or its designees in the capacity of a general partner,” the memorandum stated.

          Akazawa reiterated Thursday that Japan will contribute to the funding initiative partly using loan guarantees. A senior Japanese government official who briefed the press in Washington also said Akazawa’s previous explanation of how the investment fund would work remains the same.

          “In short, we will provide investments, loans and loan guarantees for up to $550 billion. That remains the same,” he said.

          Akazawa has largely played down the size of actual investments that Japan is likely to make via the new setup, which will involve the government-backed Japan Bank For International Cooperation and Nippon Export and Investment Insurance.

          Of the total, investment will comprise 1% or 2% and the US and Japan will split the profits of that investment at a ratio of 90-10, he said in July following the deal’s announcement. The Japan side has cited JBIC and NEXI as the government-backed organizations that will be leading financing for the projects.

          Source: Bloomberg

          To stay updated on all economic events of today, please check out our Economic calendar
          Risk Warnings and Disclaimers
          You understand and acknowledge that there is a high degree of risk involved in trading. Following any strategies or investment methods may lead to potential losses. The content on the site is provided by our contributors and analysts for information purposes only. You are solely responsible for determining whether any trading assets, securities, strategy, or any other product is suitable for investing based on your own investment objectives and financial situation.
          Add to Favorites
          Share

          Rising Markets Confront Uncertainty Ahead of US Payrolls Report

          Gerik

          Economic

          Equities Rise Despite Weak Labor Signals

          Markets closed higher on Thursday even as labor data pointed to further signs of economic weakness. The S&P 500 notched its 21st record high of the year, supported by gains across the Nasdaq Composite and Dow Jones Industrial Average. In Europe, the Stoxx 600 advanced 0.6%, with media and telecom shares leading the move.
          This optimism comes against a backdrop of disappointing employment figures. The ADP report showed private payrolls rising by just 54,000 in August, well below the 75,000 expected and down sharply from July’s revised 106,000. Weekly jobless claims also increased to 237,000, an 8,000 rise from the previous week. These indicators suggest that the labor market is softening, a development that investors interpret as strengthening the case for monetary easing by the Federal Reserve. The relationship here is causal: weaker labor data lowers the barrier for rate cuts, which in turn supports equity valuations.

          Corporate Earnings Send Mixed Signals

          Company-specific results added nuance to market sentiment. Broadcom’s stock jumped in extended trading after securing $10 billion in new custom chip orders and posting stronger-than-expected quarterly earnings. This highlights a direct link between booming demand for AI-related products and tech sector resilience.
          In contrast, Lululemon’s shares plunged after the retailer issued a significantly weaker full-year outlook, citing $240 million in expected losses from tariffs. While second-quarter earnings exceeded estimates, revenue slightly missed, underscoring how external pressures can outweigh operational gains. This case demonstrates a causal connection between tariff policy and corporate profitability, showing how geopolitical factors directly erode earnings projections.

          Political Uncertainty Adds Pressure

          Political developments continue to complicate the market landscape. President Donald Trump renewed his attempt to fire FTC commissioner Rebecca Slaughter, escalating his efforts to consolidate influence over federal agencies. Though not directly tied to immediate market performance, such moves correlate with heightened institutional uncertainty that can influence investor risk appetite.
          The nonfarm payrolls report due Friday is expected to show 75,000 job additions in August, only slightly above July’s 73,000. If actual figures fall below expectations, recession concerns could resurface, potentially derailing the current rally. Conversely, an outcome that aligns with forecasts might maintain the status quo, leaving markets buoyed by the prospect of imminent rate cuts.
          The analogy of an “oncoming freight train” captures the tension: markets may continue their ride upward if the data simply confirms a mild slowdown, but a sharp miss could jolt sentiment and trigger a wave of risk aversion. The relationship here is causal and immediate the labor report will directly influence both Fed policy expectations and investor positioning.
          The juxtaposition of record-breaking equity gains with deteriorating labor market indicators reveals the fragile balance underpinning investor sentiment. Weak jobs data has thus far fueled optimism for monetary easing, but Friday’s payrolls report represents a critical inflection point. Whether markets sustain their momentum or shift abruptly into defensive mode will depend on whether the data signals a manageable slowdown or a deeper economic contraction in progress.

          Source: CNBC

          To stay updated on all economic events of today, please check out our Economic calendar
          Risk Warnings and Disclaimers
          You understand and acknowledge that there is a high degree of risk involved in trading. Following any strategies or investment methods may lead to potential losses. The content on the site is provided by our contributors and analysts for information purposes only. You are solely responsible for determining whether any trading assets, securities, strategy, or any other product is suitable for investing based on your own investment objectives and financial situation.
          Add to Favorites
          Share

          Asia Week Ahead: Key Data On China, Japan, South Korea And Taiwan

          ING

          Economic

          Forex

          Political

          China: Trade likely to be stable, while inflation dips again

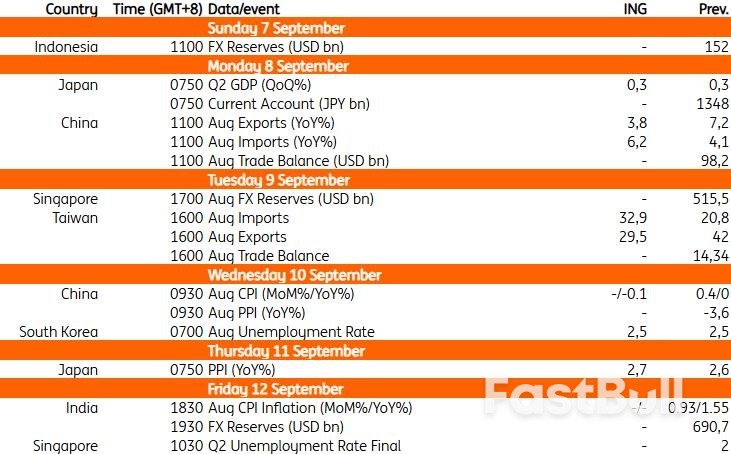
          On Monday, we don’t expect major surprises from China’s August trade data in light of the extension of the US-China trade war truce, which kept tariffs at the status quo. Export growth could slow to around 3.8% year on year, while imports could continue to pick up to around 6.2% YoY, thanks to base effects from 2024.August inflation data, to be released on Wednesday, could show price pressures dipped back into negative territory at around -0.1% YoY after coming in at zero in July.

          Taiwan: Exports expected to slow, while imports accelerate

          When Taiwan releases its August trade data on Tuesday, we will be on the lookout for any early signs of a pullback after the tariff hikes from 10% to 20% during the month. After Taiwan's government characterized the 20% rate as temporary, it’s possible that prospective importers held off in hopes that the tariff could soon be lowered. This may be more evident in subsequent months than in August. We look for export growth to slow to 29.5% YoY, while import growth continues to accelerate to 32.9% YoY.

          South Korea: Employment expected to remain stable

          South Korea’s unemployment rate is expected to stay at 2.5% for a second consecutive month. Unusually severe weather conditions may have reduced employment in agriculture and construction, while leisure-related services may see an increase in jobs. Aided by government support for small businesses, the unemployment rate may stay at the current low level for a considerable time.

          Japan: Pipeline price pressures may drive up the PPI

          Japan’s second-quarter GDP likely remained near the flash estimate of 0.3% quarter-on-quarter growth. Meanwhile, the August producer price index is projected to rise to 2.7% YoY, indicating continued pipeline price pressures.

          Key events in Asia next week

          Source: ING

          To stay updated on all economic events of today, please check out our Economic calendar
          Risk Warnings and Disclaimers
          You understand and acknowledge that there is a high degree of risk involved in trading. Following any strategies or investment methods may lead to potential losses. The content on the site is provided by our contributors and analysts for information purposes only. You are solely responsible for determining whether any trading assets, securities, strategy, or any other product is suitable for investing based on your own investment objectives and financial situation.
          Add to Favorites
          Share

          Japan's Ishiba Could Face Leadership Challenge On Monday

          James Whitman

          Political

          Key points:

          ● Ruling party to vote Monday on holding leadership race
          ● Markets see strong chance of race, costing Ishiba his job
          ● Leadership change could bring looser fiscal policy
          ● Political uncertainty complicates BOJ's rate-hike timing

          Lawmakers of Japan's ruling party will vote on Monday whether to hold an extraordinary leadership election that could oust embattled premier Shigeru Ishiba and have a significant impact on the world's fourth largest economy.

          Concern over political uncertainty has led to a sell-off in the yen and Japanese government bonds (JGB) this week with the yield on the 30-year yield hitting a record high on Wednesday.

          While the policy paralysis around such a vote could add pain for an economy hit by U.S. tariffs, markets are focusing more on the chance of Ishiba's replacement by an advocate of looser fiscal and monetary policy such as Sanae Takaichi, who has criticised the Bank of Japan's interest rate hikes.

          "The dominant market bet is for the LDP to hold a leadership race and for Ishiba, known as a fiscal hawk, to lose his job," said Katsutoshi Inadome, senior strategist at Sumitomo Mitsui Trust Asset Management.

          "We'll likely see further selling in Japanese government bonds as whoever succeeds Ishiba probably will be more open to loosening fiscal policy than him."

          Ishiba has refused calls from within his Liberal Democratic Party (LDP) to step down and take responsibility for its July loss in an upper house election.

          Staying in power, however, has become increasingly hard for him. Having lost a majority in both houses of parliament, his ruling coalition needs opposition support to pass legislation.

          Wary of being attached to the unpopular premier, opposition parties have refused to cooperate. Even some of Ishiba's cabinet members are now calling for the choice of a new party leader.

          Party rules require at least half the LDP members to request holding the race, which could follow this month or in October.

          Such a leadership race could delay parliament's passage of an expected supplementary budget aimed at cushioning the blow to households from rising living costs.

          Eurasia Group gave odds of 60% that Ishiba would not survive.

          "Ishiba's poor performance as party leader in lower and upper house elections and events in recent days, including former prime minister Aso Taro announcing his support for the special election, have turned the tide against Ishiba," said David Boling, director of Japan and Asian Trade at Eurasia.

          That puts the focus his potential successor.

          While the LDP lacks a majority in parliament, its leader would still be the favourite to become next prime minister, due to a fragmented opposition.

          The choice could affect not just the scale of fiscal stimulus, but the timing of the BOJ's next interest rate hike, analysts say.

          Front-runners include 44-year-old Shinjiro Koizumi, a charismatic agriculture minister popular with the public, but whose views on economic policy are unknown.

          Takaichi, who represents the party's right wing, is also seen by some analysts as a strong candidate to become Japan's first female prime minister. She lost the September leadership race to Ishiba in a run-off vote.

          While several other candidates are seen in the fray, Takaichi stands out for her vocal opposition to BOJ rate hikes and calls to ramp up spending to underpin a fragile economy.

          After ending a decade-long, massive stimulus programme last year, the BOJ raised interest rates to 0.5% in January on the view that Japan was on the cusp of sustainably meeting its inflation target of 2%.

          Most economists polled by Reuters expect the central bank to raise rates again this year, with some betting on a hike in October.

          "Under Takaichi, fiscal discipline will be out the window," Inadome said. "Markets still remember the time she made it to the run-up in September, and triggered huge selling in JGBs."

          Source: Reuters

          Risk Warnings and Disclaimers
          You understand and acknowledge that there is a high degree of risk involved in trading. Following any strategies or investment methods may lead to potential losses. The content on the site is provided by our contributors and analysts for information purposes only. You are solely responsible for determining whether any trading assets, securities, strategy, or any other product is suitable for investing based on your own investment objectives and financial situation.
          Add to Favorites
          Share

          India’s Solar Industry Gains Momentum as US Tariffs Reshape Global Market Dynamics

          Gerik

          Economic

          Domestic Demand and Policy Support Drive Expansion

          India's solar manufacturing sector is experiencing accelerated growth as the country pursues two strategic goals: reducing dependence on Chinese imports and capturing global market share, particularly amid rising geopolitical trade tensions. At the heart of this effort is the ReNew manufacturing facility in Jaipur, capable of producing 4 gigawatts of solar modules annually enough to power roughly 2.5 million homes. This output illustrates the sector’s growing industrial capacity and its critical role in India’s broader clean energy transition.
          Government support, including tax breaks, domestic procurement mandates, and import restrictions on foreign-made components, has created a highly favorable environment for local producers. These policy levers have led to a significant increase in capacity: over the fiscal year ending March 2025, solar module manufacturing more than doubled to 74 gigawatts, while solar cell production tripled to 25 gigawatts.
          The correlation between strong domestic policy signals and industry growth is evident, showing how deliberate state intervention can steer investment and production in a strategic sector.

          US Tariffs Create Headwinds but Domestic Market Absorbs the Shock

          The recent imposition of a 50% tariff by the Trump administration on Indian solar goods presents a challenge for exporters. Historically, the US accounted for roughly one-third of Indian solar panel exports. However, the domestic market’s capacity to absorb production has helped offset potential losses from declining US demand.
          Energy analyst Charith Konda notes that India is not as dependent on exports as other solar manufacturing countries, emphasizing the causal role of strong domestic demand in buffering against external shocks. The solar boom in India is fueled not only by environmental imperatives but also by economic logic solar energy is now half the cost of building new coal plants, making it the cheapest source of new power in the country.
          Vinay Keesara of Vega Solar highlighted a structural pivot post-pandemic, with his business transitioning from 90% export-oriented to 90% domestically focused, further underscoring how internal demand has restructured business models. This shift reflects an internal market dynamic resilient enough to absorb shocks from trade restrictions.

          India’s Manufacturing Infrastructure Still Faces Limitations

          Despite recent progress, India’s solar industry continues to rely on imported raw materials, especially from China. Data shows that India imported $1.3 billion in solar cells and modules from China in the first quarter of 2025, though this figure is down by more than one-third compared to the previous year. The country's current dependency is not on finished goods alone but extends to critical upstream inputs such as polysilicon and other rare minerals, where domestic mining and processing capabilities remain underdeveloped.
          However, analyst Neshwin Rodrigues anticipates that by 2030, India may only need to import polysilicon, while other components could be locally produced. This projection depends on the successful execution of government programs targeting critical mineral production and supply chain expansion.
          The relationship here is partly causal and partly developmental while India’s policy frameworks and domestic demand have directly driven capacity growth, further progress hinges on the gradual resolution of infrastructure gaps and supply chain bottlenecks.

          Clean Energy Goals Anchor Long-Term Industry Vision

          India has positioned its solar sector within a larger clean energy transformation. With nearly 170 gigawatts of renewable energy projects underway, most of them solar, and an ambitious goal of 500 gigawatts by 2030, the long-term market outlook is firmly anchored in government-backed sustainability targets.
          This large-scale policy commitment incentivizes domestic manufacturers to invest in long-term capabilities despite current challenges. Sanjay Verghese of ReNew notes that policy support is still a critical pillar of the sector’s expansion, and maintaining that support will be essential for the industry to reach full maturity.

          Strategic Realignment Underway in Global Solar Supply Chains

          India’s solar industry is entering a transformative phase. While US tariffs and continued dependency on Chinese raw materials present immediate challenges, the combination of domestic market strength, favorable policy, and long-term climate goals is enabling the country to reorient its solar strategy.
          Rather than viewing trade restrictions as purely detrimental, Indian firms are using the disruption as an opportunity to deepen domestic integration and reduce external reliance. If infrastructure bottlenecks can be resolved and critical mineral processing is scaled up, India may emerge not only as a regional solar powerhouse but as a legitimate competitor to China in global clean energy manufacturing.

          Source: AP

          To stay updated on all economic events of today, please check out our Economic calendar
          Risk Warnings and Disclaimers
          You understand and acknowledge that there is a high degree of risk involved in trading. Following any strategies or investment methods may lead to potential losses. The content on the site is provided by our contributors and analysts for information purposes only. You are solely responsible for determining whether any trading assets, securities, strategy, or any other product is suitable for investing based on your own investment objectives and financial situation.
          Add to Favorites
          Share

          IC Markets Asia Fundamental Forecast | 05 September 2025

          IC Markets

          Commodity

          Forex

          Economic

          What happened in the U.S session?

          The overnight US session was dominated by weak labor market data that solidified expectations for a 25 basis point Fed rate cut on September 17, with markets now pricing in a 96-98% probability. The combination of disappointing ADP employment figures, rising jobless claims, and declining job openings created a dovish environment that benefited rate-sensitive assets like gold and growth stocks, while pressuring the US dollar and oil prices. Tech giants Alphabet and Apple were the session’s biggest winners due to favorable regulatory developments, while Treasury yields declined across the curve as investors positioned for monetary easing.

          What does it mean for the Asia sessions?

          Friday’s trading will be dominated by US employment data, which could solidify or derail Fed rate cut expectations for September 17. Asian traders should particularly watch for any surprises in the NFP numbers, as this could trigger significant moves in USD pairs and global risk sentiment. The combination of potential Fed easing, Chinese market intervention concerns, and ongoing trade uncertainties creates a complex but potentially volatile environment for Asian markets. Oil’s continued decline and gold’s strength reflect the current risk-off sentiment, while emerging market currencies appear positioned to benefit from dollar weakness if the Fed proceeds with cuts as expected.

          The Dollar Index (DXY)

          The US dollar enters Friday’s crucial employment data release from a position of significant technical and fundamental weakness. With Fed rate cuts appearing increasingly certain and political pressures mounting, the dollar faces its most challenging period in years. The September 5th jobs report will likely determine whether the current weakness accelerates or if seasonal patterns provide temporary relief for the beleaguered greenback.Central Bank Notes:

          ● The Board of Governors of the Federal Reserve System voted unanimously to maintain the Federal Funds Rate in a target range of 4.25% to 4.50% at its meeting on July 29–30, 2025, keeping policy unchanged for the fifth consecutive meeting.
          ● The Committee reiterated its objective of achieving maximum employment and inflation at the rate of 2% over the longer run. While uncertainty around the economic outlook has diminished since earlier in the year, the Committee notes that challenges remain and continued vigilance is warranted.
          ● Policymakers remain highly attentive to risks on both sides of their dual mandate. The unemployment rate remains low, near 4.2%–4.5%, and labor market conditions are described as solid. However, inflation remains somewhat elevated, with the PCE price index at 2.6% and a core inflation forecast of 3.1% for year-end 2025, up from earlier projections; tariff-related pressures are cited as a contributing factor.
          ● The Committee acknowledged that recent economic activity has expanded at a solid pace, with second-quarter annualized growth estimates near 2.4%. However, GDP growth for 2025 has been revised downward to 1.4% (from 1.7% projected in March), reflecting expectations of a slowdown in the coming quarters.
          ● In the revised Summary of Economic Projections, the unemployment rate is expected to average 4.5% in 2025, and headline PCE inflation is forecast at 3.0% for the year, with core PCE at 3.1%. Policymakers continue to anticipate that inflation will moderate gradually, with ongoing risks from tariffs and global conditions.
          ● The Committee reaffirmed its data-dependent and risk-aware approach to future policy decisions. Officials stated they are prepared to adjust the stance of monetary policy as appropriate if risks emerge that could impede progress toward the Fed’s goals.
          ● As previously outlined, the Committee continues the measured run-off of its securities holdings. The pace of balance sheet reduction, which slowed since April (monthly redemption cap on Treasury securities reduced from $25B to $5B, while holding agency MBS cap steady at $35B), was left unchanged this month to support orderly market functioning and financial conditions.
          ● The next meeting is scheduled for 16 to 17 September 2025.

          Next 24 Hours Bias

          Medium Bullish

          Gold (XAU)

          Gold enters Friday, September 5, 2025, in a powerful position, supported by multiple bullish catalysts, including Fed easing expectations, political uncertainty around central bank independence, robust institutional demand, and technical momentum. The day’s NFP release will determine whether gold can break to new all-time highs or experience a temporary consolidation. With Goldman Sachs forecasting potential moves to $4,000-$5,000 and technical indicators remaining bullish, the precious metal appears well-positioned for continued gains despite already significant year-to-date performance of over 40%.Next 24 Hours Bias

          Strong Bullish

          The Australian Dollar (AUD)

          The Australian Dollar enters September 5, 2025, supported by strong fundamentals including robust GDP growth, record trade surpluses, and improving China relations. However, the currency faces near-term headwinds from rising domestic inflation that has effectively ruled out a September RBA rate cut, technical resistance levels, and mixed commodity price performance. The key drivers to watch include upcoming US employment data, Fed policy decisions, Chinese economic indicators, and Australia’s next inflation readings.Central Bank Notes:

          ● The RBA held its cash rate steady at 3.85% at the August meeting on 11–12 August 2025, maintaining its stance after keeping rates unchanged in July. The decision was widely expected, reflecting confidence that inflation is settling sustainably within the target.
          ● Inflation continues to moderate, though headline outcomes for the September quarter are not yet available. Timely indicators suggest price pressures in housing-related services and insurance remain elevated, even as tradables inflation stays subdued.
          ● The RBA’s preferred measure, trimmed mean inflation, is estimated to track close to 2.8 — 2.9%, signaling continued progress toward the midpoint of the 2–3% target range. Headline CPI is likely near 2.3%, subject to volatility in energy and food prices.
          ● Global conditions remain a source of uncertainty. The market reaction to ongoing U.S.–EU trade frictions has tempered slightly, but volatility persists across equity and commodity markets. These developments continue to feed into Australia’s trade outlook and business sentiment.
          ● Domestic demand showed further signs of recovery. Household consumption strengthened modestly over the winter months, helped by improving real incomes and a stabilizing housing market. However, business investment intentions remain mixed, with service industries stronger than manufacturing and construction.
          ● Labour market conditions remain relatively tight, but indicators point to reduced momentum compared with the first half of 2025. Job vacancies have eased, and while employment growth continues, underutilization edged slightly higher for the first time this year.
          ● Wage growth has moderated further, consistent with easing labour demand, though unit labour costs remain above average due to weak productivity performance. The RBA continues to flag productivity as a medium-term risk to cost dynamics.
          ● Forward-looking indicators suggest consumption growth may be softer than previously assumed, with households cautious despite modest income gains. Elevated rents and high borrowing costs continue to weigh on discretionary spending.
          ● The Board reasserted the risk that household spending may underperform forecasts, potentially dampening business conditions and leading to weaker labour demand if confidence fails to strengthen.
          ● The overall stance of monetary policy remains mildly restrictive, consistent with inflation outcomes near target and ongoing progress toward balance in the economy. The Board judged it prudent to leave rates unchanged, while emphasizing that adjustments remain contingent on incoming data.
          ● The Reserve Bank reaffirmed its commitment to price stability and full employment, noting its readiness to adjust settings if conditions diverge materially from baseline projections.
          ● The next meeting is on 8 to 9 September 2025.Next 24 Hours Bias
          Medium Bullish

          The Kiwi Dollar (NZD)

          The New Zealand Dollar (NZD) continues to face downward pressure on Friday, September 5, 2025, trading around 0.5835-0.5840 against the US Dollar. The Kiwi has weakened 0.74% from the previous session and is down 6.19% over the past 12 months. Despite some recent positive momentum earlier in the week, the NZD remains under pressure from dovish RBNZ policy expectations and broader market uncertainty ahead of key US employment data.Central Bank Notes:

          ● The Monetary Policy Committee (MPC) agreed to cut the Official Cash Rate (OCR) by 25 basis points to 3.00% on 20 August 2025, marking a three-year low and continuing the easing cycle after July’s pause. The vote was split 4-2, with two members advocating a 50-basis-point cut, highlighting diverging views within the Committee.
          ● Policymakers indicated that significant uncertainty and a stalling economic recovery prompted this move, leaving the door open for further rate cuts later in the year, with a possible trough around 2.5% by December.
          ● Annual consumer price index inflation rose to 2.7% in the June quarter and is expected to reach 3% for the September quarter—at the upper end of the MPC’s 1 to 3% target band—but medium-term expectations remain anchored near the 2% midpoint..
          ● Despite the near-term uptick, headline inflation is projected to return toward 2% by mid-2026, as tradables inflation pressures ease and significant spare capacity continues to dampen domestic price momentum.
          ● Domestic financial conditions are broadly aligning with MPC expectations, as lower wholesale rates have translated into reduced borrowing costs for households. However, declining consumption and investment demand, higher unemployment, and subdued wage growth reflect ongoing economic slack.
          ● GDP growth stalled in the second quarter of 2025, contrasting with earlier projections. High-frequency indicators point to continued weakness driven by rising prices for essentials, weakening household savings, and constrained business lending.
          ● The MPC cautioned that ongoing global tariff uncertainties and policy shifts, especially recent changes in US trade regulations, could amplify market volatility and present both upside and downside risks to New Zealand’s recovery.
          ● Subject to medium-term inflation pressures continuing to ease as projected, the MPC signaled scope for further OCR cuts, possibly down to 2.5% by year-end, consistent with the latest Monetary Policy Statement outlook.

          ● The next meeting is on 22 October 2025.

          Next 24 Hours Bias

          Weak Bearish

          The Japanese Yen (JPY)

          The Japanese Yen faces a perfect storm of challenges heading into Friday, September 5, 2025. Political uncertainty surrounding PM Ishiba’s leadership, combined with the BoJ’s cautious monetary policy stance and persistent real wage declines, continues to undermine the currency. While inflation remains above the 2% target, the central bank appears reluctant to accelerate rate hikes amid global economic uncertainties and domestic political instability.Central Bank Notes:

          ● The Policy Board of the Bank of Japan decided on 31 July, by a unanimous vote, to set the following guidelines for money market operations for the inter-meeting period:
          ● The Bank will encourage the uncollateralized overnight call rate to remain at around 0.5%.
          ● The BOJ will maintain its gradual reduction of monthly outright purchases of Japanese Government Bonds (JGBs). The scheduled amount of long-term government bond purchases will, in principle, continue to decrease by about ¥400 billion each quarter from January to March 2026, and by about ¥200 billion each quarter from April to June 2026 onward, targeting a purchase level near ¥2 trillion in January to March 2027.
          ● Japan’s economy is experiencing a moderate recovery overall, though some sectors remain sluggish. Overseas economies are generally growing moderately, but recent trade policies in major economies have introduced pockets of weakness. Exports and industrial production in Japan are essentially flat, with any uptick largely driven by front-loaded demand ahead of U.S. tariff increases.
          ● On the price front, the year-on-year rate of change in consumer prices (excluding fresh food) remains in the mid-3% range. This reflects continued wage pass-through, previous import cost surges, and further increases in food prices, particularly rice. Expectations for future inflation have begun to rise moderately.
          ● The effects of the earlier import price and food cost increases are expected to fade during the outlook period. There may be a temporary stagnation in core inflation as overall growth momentum softens.
          ● Looking forward, the economy is likely to see a slower growth pace in the near term as overseas economies feel the pinch of ongoing global trade policies, putting downward pressure on Japanese corporate profits. Accommodative financial conditions are expected to buffer these headwinds somewhat. In the medium term, as global growth recovers, Japan’s growth rate is also expected to improve.
          ● With renewed economic expansion, intensifying labor shortages, and a steady rise in medium- to long-term expected inflation rates, core inflation is projected to gradually pick up. By the latter half of the BOJ’s projection period, inflation is forecast to move in line with the 2% price stability target.
          ● There are multiple risks to the outlook, with especially elevated uncertainty regarding the future path of global trade policies and overseas price trends. The BOJ will continue to closely monitor their impact on financial and foreign exchange markets, as well as on Japan’s economy and inflation.
          ● The next meeting is scheduled for 17 to 18 September 2025.

          Next 24 Hours BiasWeak Bearish

          Oil

          The oil market enters a critical phase as OPEC+ faces the choice between defending prices through production restraint or prioritizing market share through increased output. With the EIA projecting significant inventory builds averaging more than 2 million barrels per day in Q4 2025 and Q1 2026, the group’s September 7 decision will likely determine the market’s trajectory through year-end.

          Next 24 Hours Bias

          Medium Bearish

          Source: IC Markets

          To stay updated on all economic events of today, please check out our Economic calendar
          Risk Warnings and Disclaimers
          You understand and acknowledge that there is a high degree of risk involved in trading. Following any strategies or investment methods may lead to potential losses. The content on the site is provided by our contributors and analysts for information purposes only. You are solely responsible for determining whether any trading assets, securities, strategy, or any other product is suitable for investing based on your own investment objectives and financial situation.
          Add to Favorites
          Share

          Oil Prices Slip for Third Day as Markets Brace for OPEC+ Supply Decision

          Gerik

          Economic

          Commodity

          Oil Market Weakens Ahead of Potential OPEC+ Production Shift

          Oil prices declined for the third consecutive session on Friday, reflecting growing market anxiety over a potential output increase from the OPEC+ alliance. Brent crude futures slipped by 23 cents to $66.77 a barrel, while West Texas Intermediate (WTI) dropped 19 cents to $63.29 in early Asian trading.
          The sustained downward movement is closely tied to speculation surrounding the upcoming OPEC+ meeting scheduled for Sunday. According to sources cited by Reuters, eight core OPEC members, including heavyweight producer Russia, are considering a plan to raise output in October. This potential supply increase would effectively reverse part of the group's existing production curbs more than a year earlier than originally planned.
          The causal relationship between supply expectations and price pressure is direct: if the world's dominant oil bloc responsible for nearly half of global production eases its output cuts prematurely, it would inject a significant surplus into an already fragile market, putting a ceiling on short-term price recovery.

          US Inventory Build Defies Expectations, Amplifies Downward Pressure

          Additional downward momentum came from an unexpected US crude inventory build. Government data showed that domestic stockpiles rose by 2.4 million barrels last week, surprising analysts who had forecast a 2-million-barrel draw. The build, attributed to refineries entering seasonal maintenance cycles, diverged sharply from industry expectations and the American Petroleum Institute's report of a smaller 600,000-barrel increase.
          This surprise inventory growth suggests softer domestic demand or lower refinery throughput, reinforcing market concerns over oversupply. The mismatch between forecasts and actual inventory figures also undermines bullish sentiment, particularly in a market already on edge due to global supply discussions.
          The inventory data establishes a correlational dynamic with price behavior while not necessarily triggering the decline alone, it contributed to broader selling pressure in combination with geopolitical and institutional signals.

          Geopolitical Signals Add to Volatility

          Geopolitical tensions remain a secondary but significant factor in oil market volatility. On Thursday, US President Donald Trump reportedly urged European leaders to cease purchases of Russian oil. This political stance, while unlikely to translate into immediate action, adds to the uncertainty surrounding global energy flows and OPEC+ cohesion.
          Although not yet causally linked to physical supply disruptions, such rhetoric adds another layer of complexity to OPEC+ decision-making and investor expectations. If European nations respond with actual import curtailments, it could eventually influence global supply-demand balances and price trajectories.

          Market Awaits Clarity Amid Complex Supply Narrative

          The current decline in oil prices reflects a multi-layered convergence of supply expectations, inventory surprises, and geopolitical posturing. As the OPEC+ meeting approaches, market participants are recalibrating their positions, mindful that even a modest increase in output could significantly shift the market's equilibrium.
          Should the alliance move forward with easing production cuts in October, the impact would be both immediate and structural, signaling a premature unwind of price-supportive policy. In the absence of demand-side strength, such a move could extend or accelerate the recent downtrend in oil prices. Conversely, if the group delays action, markets may find temporary support, but the outlook remains tethered to delicate balances between supply discipline and political influence.

          Source: Reuters

          To stay updated on all economic events of today, please check out our Economic calendar
          Risk Warnings and Disclaimers
          You understand and acknowledge that there is a high degree of risk involved in trading. Following any strategies or investment methods may lead to potential losses. The content on the site is provided by our contributors and analysts for information purposes only. You are solely responsible for determining whether any trading assets, securities, strategy, or any other product is suitable for investing based on your own investment objectives and financial situation.
          Add to Favorites
          Share
          FastBull
          Copyright © 2025 FastBull Ltd

          728 RM B 7/F GEE LOK IND BLDG NO 34 HUNG TO RD KWUN TONG KLN HONG KONG

          TelegramInstagramTwitterfacebooklinkedin
          App Store Google Play Google Play
          Products
          Charts

          Chats

          Q&A with Experts
          Screeners
          Economic Calendar
          Data
          Tools
          Membership
          Features
          Function
          Markets
          Copy Trading
          Latest Signals
          Contests
          News
          Analysis
          24/7
          Columns
          Education
          Company
          Careers
          About Us
          Contact Us
          Advertising
          Help Center
          Feedback
          User Agreement
          Privacy Policy
          Business

          White Label

          Data API

          Web Plug-ins

          Poster Maker

          Affiliate Program

          Risk Disclosure

          The risk of loss in trading financial instruments such as stocks, FX, commodities, futures, bonds, ETFs and crypto can be substantial. You may sustain a total loss of the funds that you deposit with your broker. Therefore, you should carefully consider whether such trading is suitable for you in light of your circumstances and financial resources.

          No decision to invest should be made without thoroughly conducting due diligence by yourself or consulting with your financial advisors. Our web content might not suit you since we don't know your financial conditions and investment needs. Our financial information might have latency or contain inaccuracy, so you should be fully responsible for any of your trading and investment decisions. The company will not be responsible for your capital loss.

          Without getting permission from the website, you are not allowed to copy the website's graphics, texts, or trademarks. Intellectual property rights in the content or data incorporated into this website belong to its providers and exchange merchants.

          Not Logged In

          Log in to access more features

          FastBull Membership

          Not yet

          Purchase

          Become a signal provider
          Help Center
          Customer Service
          Dark Mode
          Price Up/Down Colors

          Log In

          Sign Up

          Position
          Layout
          Fullscreen
          Default to Chart
          The chart page opens by default when you visit fastbull.com