• Trade
  • Markets
  • Copy
  • Contests
  • News
  • 24/7
  • Calendar
  • Q&A
  • Chats
Trending
Screeners
SYMBOL
LAST
BID
ASK
HIGH
LOW
NET CHG.
%CHG.
SPREAD
SPX
S&P 500 Index
6827.42
6827.42
6827.42
6899.86
6801.80
-73.58
-1.07%
--
DJI
Dow Jones Industrial Average
48458.04
48458.04
48458.04
48886.86
48334.10
-245.98
-0.51%
--
IXIC
NASDAQ Composite Index
23195.16
23195.16
23195.16
23554.89
23094.51
-398.69
-1.69%
--
USDX
US Dollar Index
97.950
98.030
97.950
98.500
97.950
-0.370
-0.38%
--
EURUSD
Euro / US Dollar
1.17394
1.17409
1.17394
1.17496
1.17192
+0.00011
+ 0.01%
--
GBPUSD
Pound Sterling / US Dollar
1.33707
1.33732
1.33707
1.33997
1.33419
-0.00148
-0.11%
--
XAUUSD
Gold / US Dollar
4299.39
4299.39
4299.39
4353.41
4257.10
+20.10
+ 0.47%
--
WTI
Light Sweet Crude Oil
57.233
57.485
57.233
58.011
56.969
-0.408
-0.71%
--

Community Accounts

Signal Accounts
--
Profit Accounts
--
Loss Accounts
--
View More

Become a signal provider

Sell trading signals to earn additional income

View More

Guide to Copy Trading

Get started with ease and confidence

View More

Signal Accounts for Members

All Signal Accounts

Best Return
  • Best Return
  • Best P/L
  • Best MDD
Past 1W
  • Past 1W
  • Past 1M
  • Past 1Y

All Contests

  • All
  • Trump Updates
  • Recommend
  • Stocks
  • Cryptocurrencies
  • Central Banks
  • Featured News
Top News Only
Share

China's Central Financial And Economic Affairs Commission Deputy Director: Will Expand Export And Increase Import In 2026

Share

Thai Leader Anutin: Landmine Blast That Killed Thai Soldiers 'Not A Roadside Accident'

Share

Thai Leader Anutin: Thailand To Continue Military Action Until 'We Feel No More Harm'

Share

Cambodian Prime Minister Hun Manet Says He Had Phone Calls With Trump And Malaysian Leader Anwar About Ceasefire

Share

Cambodia's Hun Manet Says USA, Malaysia Should Verify 'Which Side Fired First' In Latest Conflict

Share

Cambodia's Hun Manet: Cambodia Maintains Its Stance In Seeking Peaceful Resolution Of Disputes

Share

Nasdaq Companies: Allergan, Ferrovia, Insmed, Monolithic Power Systems, Seagate Technology, And Western Digital Will Be Added To The NASDAQ 100 Index. Biogen, CdW, GlobalFoundries, Lululemon, ON Semiconductor, And Tradedesk Will Be Removed From The NASDAQ 100 Index

Share

Witkoff Headed To Berlin This Weekend To Meet With Zelenskiy, European Leaders -Wsj Reporter On X

Share

Russia Attacks Two Ukrainian Ports, Damaging Three Turkish-Owned Vessels

Share

[Historic Flooding Occurs In At Least Four Rivers In Washington State Due To Days Of Torrential Rains] Multiple Areas In Washington State Have Been Hit By Severe Flooding Due To Days Of Torrential Rains, With At Least Four Rivers Experiencing Historic Flooding. Reporters Learned On The 12th That The Floods Caused By The Torrential Rains In Washington State Have Destroyed Homes And Closed Several Highways. Experts Warn That Even More Severe Flooding May Occur In The Future. A State Of Emergency Has Been Declared In Washington State

Share

Trump Says Proposed Free Economic Zone In Donbas Would Work

Share

Trump: I Think My Voice Should Be Heard

Share

Trump Says Will Be Choosing New Fed Chair In Near Future

Share

Trump Says Proposed Free Economic Zone In Donbas Complex But Would Work

Share

Trump Says Land Strikes In Venezuela Will Start Happening

Share

US President Trump: Thailand And Cambodia Are In A Good Situation

Share

State Media: North Korean Leader Kim Hails Troops Returning From Russia Mission

Share

The 10-year Treasury Yield Rose About 5 Basis Points During The "Fed Rate Cut Week," And The 2/10-year Yield Spread Widened By About 9 Basis Points. On Friday (December 12), In Late New York Trading, The Yield On The Benchmark 10-year US Treasury Note Rose 2.75 Basis Points To 4.1841%, A Cumulative Increase Of 4.90 Basis Points For The Week, Trading Within A Range Of 4.1002%-4.2074%. It Rose Steadily From Monday To Wednesday (before The Fed Announced Its Rate Cut And Treasury Bill Purchase Program), Subsequently Exhibiting A V-shaped Recovery. The 2-year Treasury Yield Fell 1.82 Basis Points To 3.5222%, A Cumulative Decrease Of 3.81 Basis Points For The Week, Trading Within A Range Of 3.6253%-3.4989%

Share

Trump: Lots Of Progress Being Made On Russia-Ukraine

Share

NOPA November US Soybean Crush Estimated At 220.285 Million Bushels

TIME
ACT
FCST
PREV
U.K. Trade Balance Non-EU (SA) (Oct)

A:--

F: --

P: --

U.K. Trade Balance (Oct)

A:--

F: --

P: --

U.K. Services Index MoM

A:--

F: --

P: --

U.K. Construction Output MoM (SA) (Oct)

A:--

F: --

P: --

U.K. Industrial Output YoY (Oct)

A:--

F: --

P: --

U.K. Trade Balance (SA) (Oct)

A:--

F: --

P: --

U.K. Trade Balance EU (SA) (Oct)

A:--

F: --

P: --

U.K. Manufacturing Output YoY (Oct)

A:--

F: --

P: --

U.K. GDP MoM (Oct)

A:--

F: --

P: --

U.K. GDP YoY (SA) (Oct)

A:--

F: --

P: --

U.K. Industrial Output MoM (Oct)

A:--

F: --

P: --

U.K. Construction Output YoY (Oct)

A:--

F: --

P: --

France HICP Final MoM (Nov)

A:--

F: --

P: --

China, Mainland Outstanding Loans Growth YoY (Nov)

A:--

F: --

P: --

China, Mainland M2 Money Supply YoY (Nov)

A:--

F: --

P: --

China, Mainland M0 Money Supply YoY (Nov)

A:--

F: --

P: --

China, Mainland M1 Money Supply YoY (Nov)

A:--

F: --

P: --

India CPI YoY (Nov)

A:--

F: --

P: --

India Deposit Gowth YoY

A:--

F: --

P: --

Brazil Services Growth YoY (Oct)

A:--

F: --

P: --

Mexico Industrial Output YoY (Oct)

A:--

F: --

P: --

Russia Trade Balance (Oct)

A:--

F: --

P: --

Philadelphia Fed President Henry Paulson delivers a speech
Canada Building Permits MoM (SA) (Oct)

A:--

F: --

P: --

Canada Wholesale Sales YoY (Oct)

A:--

F: --

P: --

Canada Wholesale Inventory MoM (Oct)

A:--

F: --

P: --

Canada Wholesale Inventory YoY (Oct)

A:--

F: --

P: --

Canada Wholesale Sales MoM (SA) (Oct)

A:--

F: --

P: --

Germany Current Account (Not SA) (Oct)

A:--

F: --

P: --

U.S. Weekly Total Rig Count

A:--

F: --

P: --

U.S. Weekly Total Oil Rig Count

A:--

F: --

P: --

Japan Tankan Large Non-Manufacturing Diffusion Index (Q4)

--

F: --

P: --

Japan Tankan Small Manufacturing Outlook Index (Q4)

--

F: --

P: --

Japan Tankan Large Non-Manufacturing Outlook Index (Q4)

--

F: --

P: --

Japan Tankan Large Manufacturing Outlook Index (Q4)

--

F: --

P: --

Japan Tankan Small Manufacturing Diffusion Index (Q4)

--

F: --

P: --

Japan Tankan Large Manufacturing Diffusion Index (Q4)

--

F: --

P: --

Japan Tankan Large-Enterprise Capital Expenditure YoY (Q4)

--

F: --

P: --

U.K. Rightmove House Price Index YoY (Dec)

--

F: --

P: --

China, Mainland Industrial Output YoY (YTD) (Nov)

--

F: --

P: --

China, Mainland Urban Area Unemployment Rate (Nov)

--

F: --

P: --

Saudi Arabia CPI YoY (Nov)

--

F: --

P: --

Euro Zone Industrial Output YoY (Oct)

--

F: --

P: --

Euro Zone Industrial Output MoM (Oct)

--

F: --

P: --

Canada Existing Home Sales MoM (Nov)

--

F: --

P: --

Euro Zone Total Reserve Assets (Nov)

--

F: --

P: --

U.K. Inflation Rate Expectations

--

F: --

P: --

Canada National Economic Confidence Index

--

F: --

P: --

Canada New Housing Starts (Nov)

--

F: --

P: --

U.S. NY Fed Manufacturing Employment Index (Dec)

--

F: --

P: --

U.S. NY Fed Manufacturing Index (Dec)

--

F: --

P: --

Canada Core CPI YoY (Nov)

--

F: --

P: --

Canada Manufacturing Unfilled Orders MoM (Oct)

--

F: --

P: --

Canada Manufacturing New Orders MoM (Oct)

--

F: --

P: --

Canada Core CPI MoM (Nov)

--

F: --

P: --

Canada Manufacturing Inventory MoM (Oct)

--

F: --

P: --

Canada CPI YoY (Nov)

--

F: --

P: --

Canada CPI MoM (Nov)

--

F: --

P: --

Canada CPI YoY (SA) (Nov)

--

F: --

P: --

Canada Core CPI MoM (SA) (Nov)

--

F: --

P: --

Q&A with Experts
    • All
    • Chatrooms
    • Groups
    • Friends
    Connecting
    .
    .
    .
    Type here...
    Add Symbol or Code

      No matching data

      All
      Trump Updates
      Recommend
      Stocks
      Cryptocurrencies
      Central Banks
      Featured News
      • All
      • Russia-Ukraine Conflict
      • Middle East Flashpoint
      • All
      • Russia-Ukraine Conflict
      • Middle East Flashpoint
      Search
      Products

      Charts Free Forever

      Chats Q&A with Experts
      Screeners Economic Calendar Data Tools
      Membership Features
      Data Warehouse Market Trends Institutional Data Policy Rates Macro

      Market Trends

      Market Sentiment Order Book Forex Correlations

      Top Indicators

      Charts Free Forever
      Markets

      News

      News Analysis 24/7 Columns Education
      From Institutions From Analysts
      Topics Columnists

      Latest Views

      Latest Views

      Trending Topics

      Top Columnists

      Latest Update

      Signals

      Copy Rankings Latest Signals Become a signal provider AI Rating
      Contests
      Brokers

      Overview Brokers Assessment Rankings Regulators News Claims
      Broker listing Forex Brokers Comparison Tool Live Spread Comparison Scam
      Q&A Complaint Scam Alert Videos Tips to Detect Scam
      More

      Business
      Events
      Careers About Us Advertising Help Center

      White Label

      Data API

      Web Plug-ins

      Affiliate Program

      Awards Institution Evaluation IB Seminar Salon Event Exhibition
      Vietnam Thailand Singapore Dubai
      Fans Party Investment Sharing Session
      FastBull Summit BrokersView Expo
      Recent Searches
        Top Searches
          Markets
          News
          Analysis
          User
          24/7
          Economic Calendar
          Education
          Data
          • Names
          • Latest
          • Prev

          View All

          No data

          Scan to Download

          Faster Charts, Chat Faster!

          Download App
          English
          • English
          • Español
          • العربية
          • Bahasa Indonesia
          • Bahasa Melayu
          • Tiếng Việt
          • ภาษาไทย
          • Français
          • Italiano
          • Türkçe
          • Русский язык
          • 简中
          • 繁中
          Open Account
          Search
          Products
          Charts Free Forever
          Markets
          News
          Signals

          Copy Rankings Latest Signals Become a signal provider AI Rating
          Contests
          Brokers

          Overview Brokers Assessment Rankings Regulators News Claims
          Broker listing Forex Brokers Comparison Tool Live Spread Comparison Scam
          Q&A Complaint Scam Alert Videos Tips to Detect Scam
          More

          Business
          Events
          Careers About Us Advertising Help Center

          White Label

          Data API

          Web Plug-ins

          Affiliate Program

          Awards Institution Evaluation IB Seminar Salon Event Exhibition
          Vietnam Thailand Singapore Dubai
          Fans Party Investment Sharing Session
          FastBull Summit BrokersView Expo

          Houthis Again Target Tel Aviv, As Israelis Plead for More US Raids on Yemen

          Michelle

          Political

          Summary:

          Official says Houthis aggression "can no longer remain solely an Israeli problem"...

          The Houthis have clearly been ramping up their attacks on Israeli interests and assets out of Yemen, and on Thursday another ballistic missile strike on Tel Aviv was attempted.

          Israel's military said it intercepted a missile launched from Yemen, shortly after conducting airstrikes on Houthi targets. The Iran-aligned group later confirmed responsibility for the launch, calling it a "qualitative military operation" involving a ballistic missile.

          Prior missile intercept over Tel Aviv in June, via AFP

          As a result, multiple alert sirens were active across Israel during the dawn hours. All of this comes after the Houthis attacked and sank two commercial vessels bound for Israel, in complex operations which they boasted of and captured on film.

          Israel is now reportedly formally asking the United States to renew its military strikes on the Iran-backed group, according to Kan public broadcaster..

          Israel told the US that the attacks on shipping "can no longer remain solely an Israeli problem," and called for "more intense combined attacks against Houthi regime targets — not just [Israeli] air force fighter jet strikes, but also a renewal of American attacks and the formation of a coalition including additional countries."

          "A broad coalition is needed to convey to the Houthi regime that it is in danger," an anonymous Israeli defense official told Kan.

          At the moment, the Houthis are still actively targeting Tel Aviv international airport, along with any vessel in the Red Sea bound for Israel. Ben Gurion airport has been directly hit at least once during the conflict.

          President Trump had in May declared a US ceasefire with the Houthis, to the chagrin of Israel, which stepped up its own aerial attacks on Yemen.

          Trump, perhaps realizing the futility of the US bombing raids - amid Houthi resolve - essentially declared 'victory' and departed the war theatre. Many war analysts believe that the Houthis cannot ultimately be defeated short of a full, comprehensive ground operation.

          Source: Zero Hedge

          Risk Warnings and Disclaimers
          You understand and acknowledge that there is a high degree of risk involved in trading. Following any strategies or investment methods may lead to potential losses. The content on the site is provided by our contributors and analysts for information purposes only. You are solely responsible for determining whether any trading assets, securities, strategy, or any other product is suitable for investing based on your own investment objectives and financial situation.
          Add to Favorites
          Share

          Bitcoin Price Breaks $118,000, Those Awaiting A Pullback All Miss Out

          Glendon

          Cryptocurrency

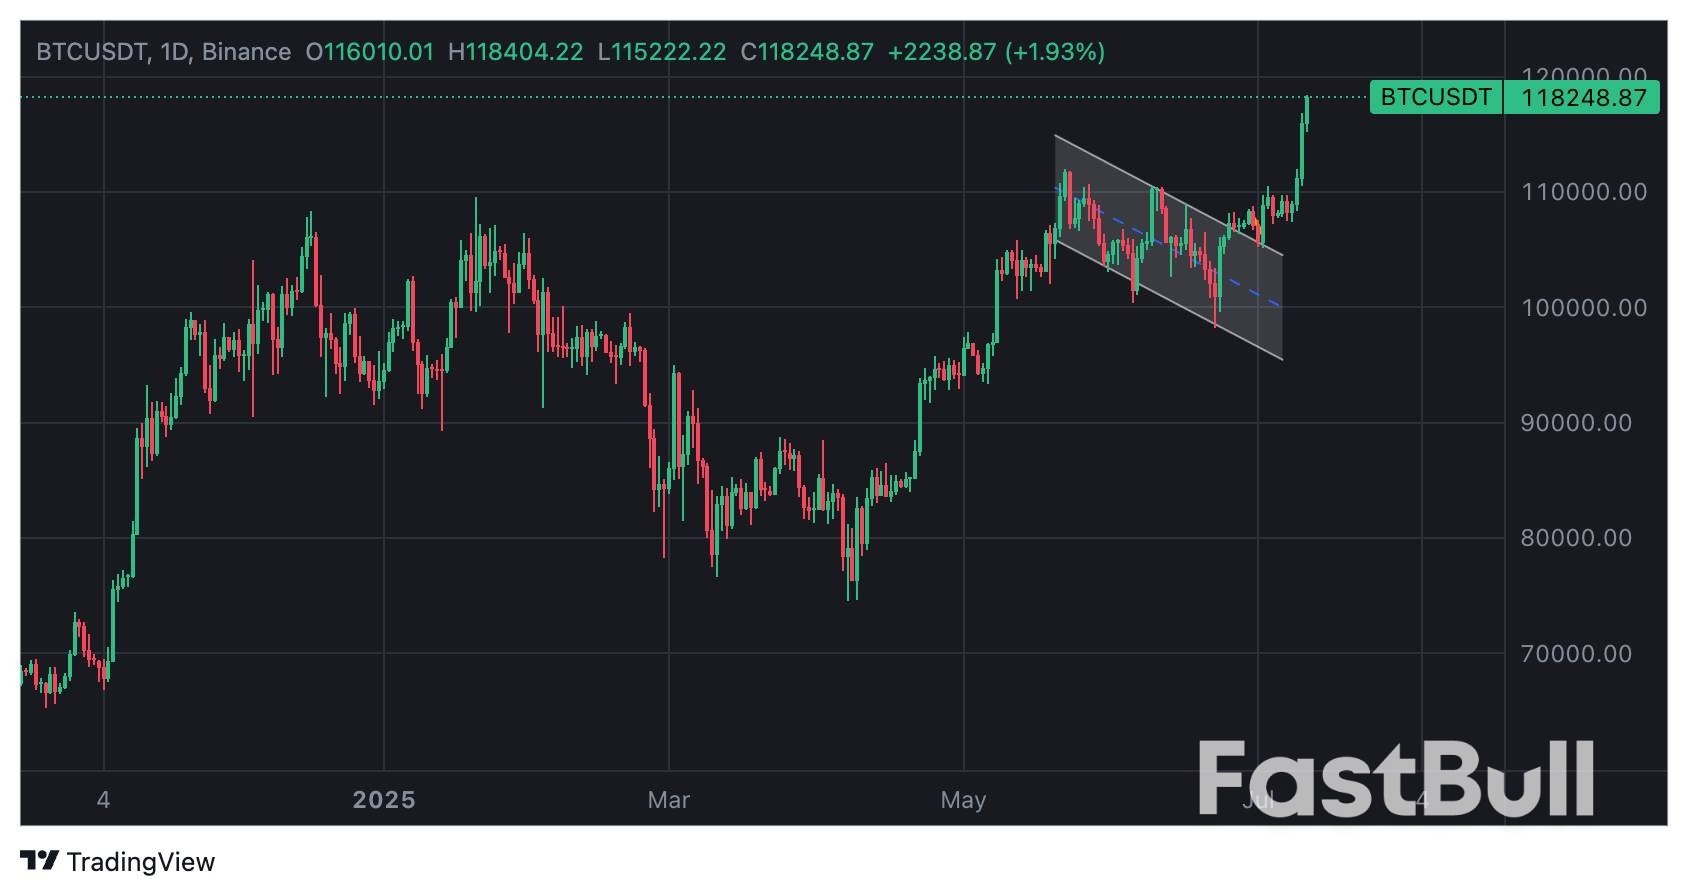
          On July 11, 2025, Bitcoin (BTC) surged past $118,000, marking a historic high. According to CoinMarketCap real-time data, Bitcoin rose 6.56% in the past 24 hours, 7.5% over the week, and an impressive 152% year-to-date.

          Market sentiment is blazing hot, with investors on social media cheering: “BTC broke $118,000, the Asian session is still soaring, those waiting for a pullback are missing out!”

          However, the rapid ascent caught pullback-awaiting investors off guard, as no meaningful correction materialized—and FOMO took hold across the board.

          INSTITUTIONAL FUND INFLOW: ETF FUELS PRICE ROCKET

          The biggest short-term driver behind Bitcoin’s break above $118,000 is institutional capital inflows.

          In particular, spot Bitcoin ETFs have served as the “rocket fuel” for this rally. According to Bloomberg, as of July 11, global Bitcoin ETFs saw record weekly net inflows, with BlackRock’s iShares Bitcoin Trust (IBIT) alone netting $448 million on July 10.

          A market participant on social media noted: “Institutional buying is unstoppable—IBIT accumulation is directly pushing BTC to new highs, retail simply can’t keep up!”

          Through massive ETF purchases, institutions have sharply reduced Bitcoin’s available supply on exchanges. Glassnode data shows that on July 11, BTC holdings on major crypto exchanges declined to 1.8 million BTC, the lowest level in three years.

          The resulting supply-demand imbalance has directly propelled price gains. At the same time, ETF-driven FOMO has gripped retail investors.

          Fearful of missing out on further gains, many abandoned their wait-and-see strategies and rushed in, amplifying upward momentum.

          Social sentiment captures this echo: “ETF inflows are like a flood—BTC just won’t stop!” This synergy between institutions and retail stands at the heart of Bitcoin surpassing $118,000.

          MARKET MOMENTUM & TRADING FRENZY: ASIAN SESSION FUELS SURGE

          Bitcoin’s rise is underpinned by strong market momentum. On the night of July 10, BTC broke the key $114,000 level, and during the Asian trading session on July 11, it pushed past $118,000.

          Glassnode shows on‑chain transaction volume spiked 35% at the breakout—reaching a monthly peak—indicating unprecedented market participation.

          One social media trader stated: “Volume exploded when BTC crossed $114,000—this is a full-on bull signal, no pullback in sight.”

          Asia’s trading surge injected massive energy. Crypto exchanges in Hong Kong and Singapore hit monthly highs in night trading, with Binance and OKX seeing BTC volume spike 45% during the early hours of July 11.

          Especially between 2 AM and 4 AM HKT, activity surged and leveraged trading climbed. Investors commented online: “Asian session buys have gone crazy—BTC directly blasted past $118,000!”

          This fervent activity not only cemented the upward move, but also squeezed out pullback opportunities.

          MARKET SENTIMENT: FOMO SWEEPS, CHASING HIGH BECOMES MAINSTREAM

          Social media has become the sentiment barometer of investor frenzy. After Bitcoin topped $118,000, hashtags like #Bitcoin and #BTCnewhigh exploded, with discussions generating over 60 million views.

          As one investor wrote: “BTC hit $118,000—retail still waiting for a $110k pullback? You don’t wait in a bull market, get on board now!” Such comments resonated widely, prompting even more investors to abandon wait-and-see postures and join the rally.

          WHY DID THOSE AWAITING A PULLBACK MISS OUT?

          In this bull cycle, pullback windows have become extraordinarily brief—or non-existent. At the end of June, BTC dipped from $110,000 to $105,000, only to recover within 48 hours.

          The July 11 breakout came without any discernible pullback—the price shot from $116,000 straight through $118,000, leaving those waiting for it in the dust.

          One social media user complained: “Every time I wait for a pullback, the market just pumps instead—it feels like it’s mocking me.”

          Several factors lie behind this phenomenon. First, institutional buying heavily suppresses pullback potential. ETFs and large institutions buying into dips quickly absorb selling pressure.

          For example, when BTC briefly fell to $115,000 during trading on July 10, buying demand lifted it back above $116,500 in under two hours. Second, global crypto market liquidity is higher and order book depth deeper, meaning retail selling rarely moves the needle.

          As one investor put it: “Institutions were waiting at $115k—retail hoping for $110k? No chance!” So those expecting 10–20% deep pullbacks were repeatedly disappointed, missing optimal entry points.

          Compared to 2017 or 2021’s bull cycles, the 2025 Bitcoin market is fundamentally different. Previously, retail-driven speculation led to swings of 20–30%, creating entry windows. Now, with institutional dominance, everything has changed.

          Companies like MicroStrategy have continued to buy: as of July 11, their holdings exceed 250,000 BTC, while exchange BTC supply sits at a three‑year low of 1.8 million BTC. This shortage has made prices highly responsive to buys and resilient to sells.

          One trader commented: “Institutions setup at $110k—retail waiting for $100k? Forget it!” Institutional depth not only lifts the market floor, but compresses the pullback timeline.

          For instance, after BTC broke $112,000 on July 9, a correction was expected—but institutions quickly drove it to $118,000, blindsiding patient traders. Under this new market regime, “waiting for pullback” is obsolete strategy—and missing out is inevitable.

          LESSONS FROM MISSING OUT: REBUILDING STRATEGY IN A BULL MARKET

          DROP THE “PERFECT LOW” FIXATION

          Historical BTC bull runs repeatedly show that chasing “the perfect dip” often means missing the rally entirely. Instead, adopt a staggered buying approach.

          For example, gradually build positions around $105,000, balancing risk and participation. Disciplined entry trumps blind waiting for perfection.

          EMOTIONAL CONTROL & TRADING DISCIPLINE

          Online discussions capture the regret of those left behind: “Every time a pullback seems possible, prices fly and my mindset collapses.”

          Many retail traders give in to FOMO or regret, lacking clear plans. The takeaway: investors need structured strategies—like target-based approaches or dollar-cost averaging—to stay on course.

          Emotional control is equally crucial. When BTC topped $118,000, social media buzz surged—and with it, panic and FOMO. Those who stayed calm, focused on on-chain data and fundamentals, were better equipped to make rational decisions.

          As one analyst advised: “Don’t let hype on social media cloud your judgment—set your plan, that’s how you win in a bull market.”

          DERIVATIVES TOOLS: FLEXIBLE OPTIONS FOR BULL MARKET DYNAMICS

          For those hesitant to chase high prices, derivatives offer viable alternatives. Short-term call options—e.g., July expiration at $120,000—let you play the upside with fixed risk. One market participant said: “Don’t want to chase high?

          Buy a call option—low cost, high potential upside.” Similarly, futures hedging can lock in profits or protect against dips.

          Derivatives offer exposure with lower capital and reduced fear of missing out. For instance, on July 11, BTC options volume on Binance surged 60%, highlighting traders’ eagerness to deploy derivatives in this rally.

          But caution is key—derivatives require sophistication, and high leverage can lead to liquidations. As shared online: “Options let me profit and sleep easy during the bull run.”

          CONCLUSION

          On July 11, 2025, Bitcoin rocketed past $118,000, fueled by institutional capital, market momentum, supply scarcity, and rampant FOMO.

          Investors hoping for a pullback were left behind—pulled down by narrow correction windows, new market dynamics, and emotion-based trading. Social media captures the mood: “BTC won’t wait—you board now or get left behind.”

          The lesson is clear: in bull markets, waiting for the perfect dip can mean missing the rally. Investors must rethink their approach—embrace staggered entry, reinforce discipline, and make smart use of tools like derivatives.

          Source: CryptoSlate

          Risk Warnings and Disclaimers
          You understand and acknowledge that there is a high degree of risk involved in trading. Following any strategies or investment methods may lead to potential losses. The content on the site is provided by our contributors and analysts for information purposes only. You are solely responsible for determining whether any trading assets, securities, strategy, or any other product is suitable for investing based on your own investment objectives and financial situation.
          Add to Favorites
          Share

          ECB's Schnabel Sets Bar 'very High' for Rate Cut As Economy Holds Up

          Michelle

          Economic

          Forex

          The hurdle for another interest rate cut by the European Central Bank is "very high" as the euro zone economy is holding up better than expected despite uncertainty over trade, ECB board member Isabel Schnabel said in an interview published on Friday.

          Having halved its policy rate in just a year, the ECB has signalled it will now stay put and see how the economy copes with a simmering global trade war stoked by U.S. President Donald Trump.

          Schnabel expressed a clear preference for keeping rates steady as inflation was moored at ECB's 2% target, the euro zone economy was proving resilient and more government spending in Germany was brightening the outlook.

          "Inflation is projected to be at 2% and inflation expectations are well anchored," Schnabel told financial newswire Econostream. "In view of this, our interest rates are also in a good place, and the bar for another rate cut is very high."

          The ECB cut its policy rate to 2% last month - a level that Schnabel said was "becoming accommodative". The ECB's official range for the neutral rate, which is neither accommodative nor restrictive, is 1.75% to 2.25%.

          She said she would only back a cut if she saw "signs of a material deviation of inflation" from 2% and spoke against "fine-tuning" the rate in response to data such as swings in oil prices.

          The ECB's chief economist Philip Lane also said recently that the central bank would react to "material" changes in the euro zone's inflation outlook and ignore "tiny" ones.

          Striking a different tone to some of her colleagues, Schnabel played down recent strength in the euro's exchange rate, saying its "pass-through" to inflation would be limited and it reflected an improved economic outlook.

          "It seems that the uncertainty is weighing less on economic activity than we thought, and on top of that, we’re expecting a large fiscal impulse that will further support the economy," she said. "So overall, the risks to the growth outlook in the euro area are now more balanced."

          She argued tariffs would prove inflationary over the medium term because of higher costs and less efficient supply chains, "which are not included in our standard projection models".

          Source: Reuters

          To stay updated on all economic events of today, please check out our Economic calendar
          Risk Warnings and Disclaimers
          You understand and acknowledge that there is a high degree of risk involved in trading. Following any strategies or investment methods may lead to potential losses. The content on the site is provided by our contributors and analysts for information purposes only. You are solely responsible for determining whether any trading assets, securities, strategy, or any other product is suitable for investing based on your own investment objectives and financial situation.
          Add to Favorites
          Share

          Goldman Expects BOJ to Slowly Unwind $252 Billion ETF Holdings via Market Sales

          Gerik

          Economic

          BOJ Expected to Pursue Cautious ETF Exit Strategy Through Gradual Market Sales

          Goldman Sachs analysts forecast that the Bank of Japan (BOJ) will opt for a measured, long-term plan to reduce its 37-trillion-yen ETF holdings valued at approximately 70 trillion yen on the market through small-scale sales in the open market, rather than pursuing more disruptive alternatives like transferring assets to public or government-controlled entities.
          The BOJ has remained vague about the timeline and mechanism of offloading the ETFs it amassed during 13 years of aggressive asset purchases as part of its ultra-loose monetary policy. While ETF buying officially halted in 2024, the central bank continues to face mounting pressure over the exit strategy for what now amounts to $252 billion in book value assets, with market value nearly double that amount.

          Key Objectives: No Losses, Minimal Market Distortion, Price Stability

          Goldman’s report, authored in part by Akira Otani, a former BOJ official and financial markets department head, emphasizes that any exit plan must meet three critical conditions outlined by the BOJ: avoid realizing losses, minimize market volatility, and maintain appropriate selling prices. According to Goldman, a gradual divestment strategy in the open market is the only practical method that aligns with all three objectives.
          While some experts have suggested more aggressive or centralized options such as transferring the ETFs to government-backed institutions or redistributing them to the public Goldman views such alternatives as either politically complex or potentially destabilizing for markets.

          Proposed Timeline: Fiscal 2026–2027 Onward

          The report proposes that the BOJ could begin its divestment around fiscal 2026 or 2027, at an annual pace of approximately 600 billion to 1 trillion yen in book value. This slow, steady rhythm would reduce risks of flooding the equity market and provide time for investors to absorb the sales.
          BOJ Governor Kazuo Ueda has maintained a cautious stance, stating that the bank needs further time to study the most appropriate strategy. The prolonged silence suggests that internal debate is ongoing and that any hasty action could undermine financial stability, especially given the BOJ’s influential presence in Japan’s equity markets.

          Market Implications: Delicate Balance Between Exit and Stability

          If the BOJ proceeds with Goldman’s forecasted strategy, Japanese equities could avoid short-term shocks, though the overhang of future ETF sales may weigh on sentiment. Conversely, a transparent and pre-communicated schedule could ease investor concerns and reduce volatility, much like the Fed's balance sheet runoff strategy in the U.S.
          The BOJ’s handling of this delicate unwind will be a litmus test for post-QE central bank normalization, especially for institutions with large-scale equity exposures. As global central banks retreat from pandemic-era stimulus measures, Japan’s unique challenge will be executing a market-sensitive exit without igniting instability.
          In short, while the BOJ’s ETF exit remains on the horizon, the favored path forward appears to be one of patience, gradualism, and precision a reflection of Japan’s signature central banking style.

          Source: Reuters

          To stay updated on all economic events of today, please check out our Economic calendar
          Risk Warnings and Disclaimers
          You understand and acknowledge that there is a high degree of risk involved in trading. Following any strategies or investment methods may lead to potential losses. The content on the site is provided by our contributors and analysts for information purposes only. You are solely responsible for determining whether any trading assets, securities, strategy, or any other product is suitable for investing based on your own investment objectives and financial situation.
          Add to Favorites
          Share

          USD/JPY Climbs As Yen Struggles Amid Trade Tensions

          Blue River

          Economic

          Forex

          On Friday, the USD/JPY pair advanced to 146.93, marking a three-week high as the US dollar continued to strengthen against a backdrop of escalating global trade tensions.

          Recent developments in US trade policy have further unsettled markets. US President Donald Trump announced additional tariffs, including a 35% levy on Canadian imports, alongside plans for sweeping 15-20% duties on most other trading partners.

          Of particular concern are US-Japan relations, following Trump’s imposition of a 25% tariff on Japanese goods this week, set to take effect on 1 August. The move has intensified bilateral strains, with Japanese Prime Minister Shigeru Ishiba warning of the need to reduce Japan’s reliance on the US in defence, food security, and energy.

          Ishiba described the ongoing negotiations as a “battle for national interests”. At the same time, a leading Japanese think tank projected that the tariffs could shave 0.8% off Japan’s GDP in 2025, with a cumulative decline of 1.9% by 2029.

          Technical Analysis: USD/JPY
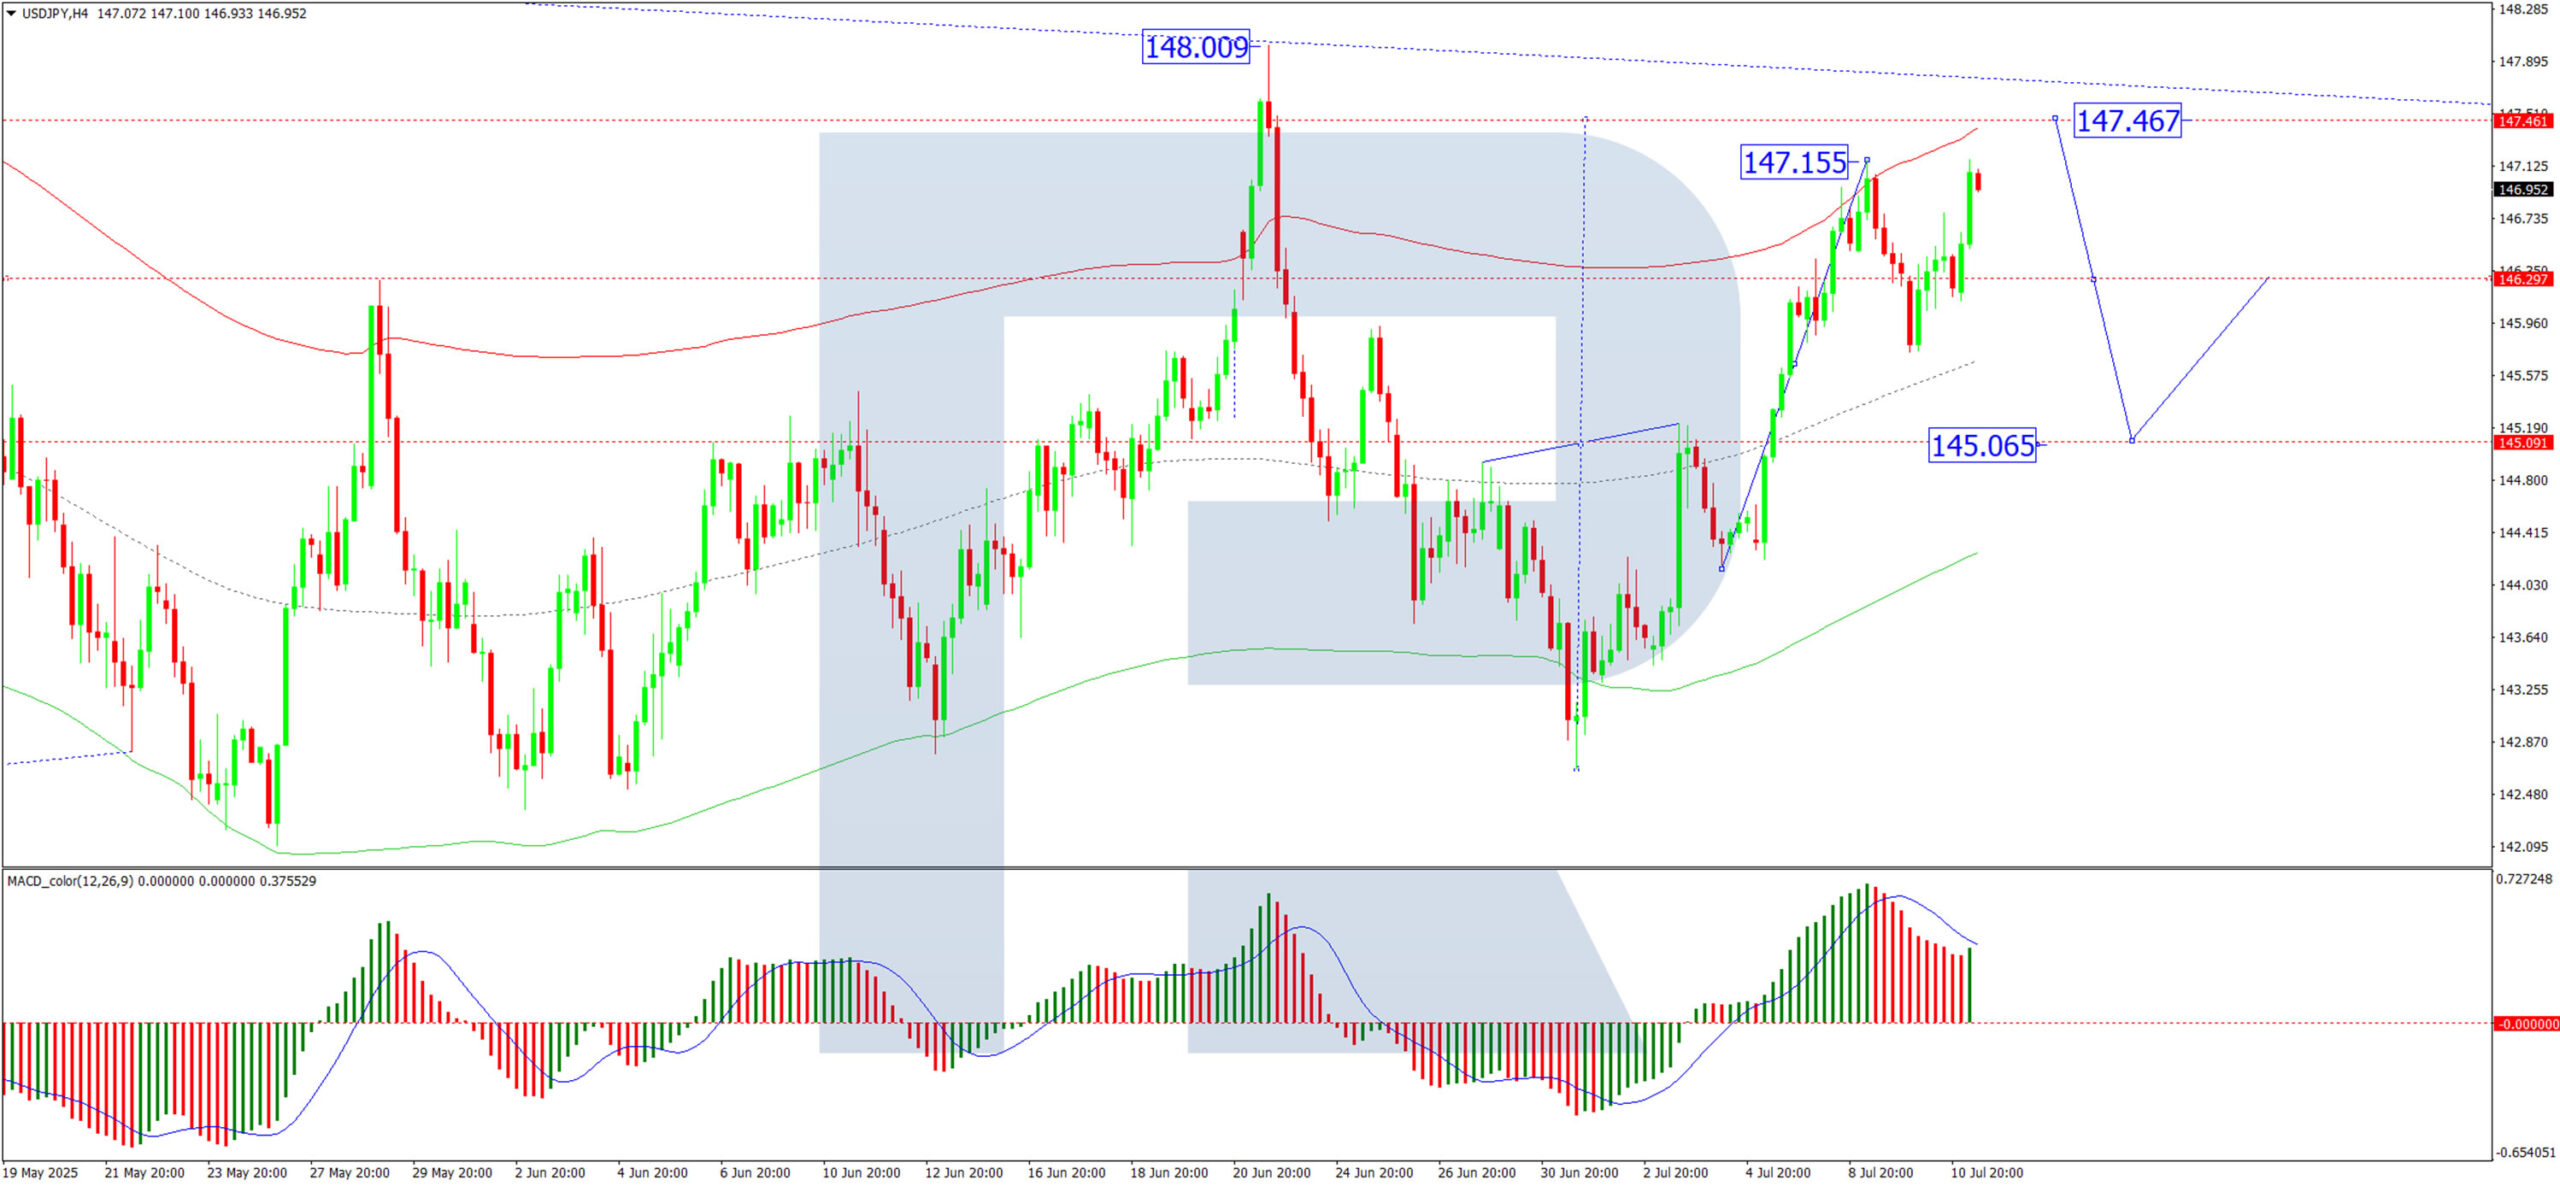
          H4 Chart:

          The USD/JPY has established a consolidation range around 145.65, now extending to 147.17. A short-term pullback to 145.65 (testing from above) is anticipated, followed by a potential upward wave targeting 147.47 at minimum. This outlook is supported by the MACD indicator, with its signal line firmly above zero and trending upward.
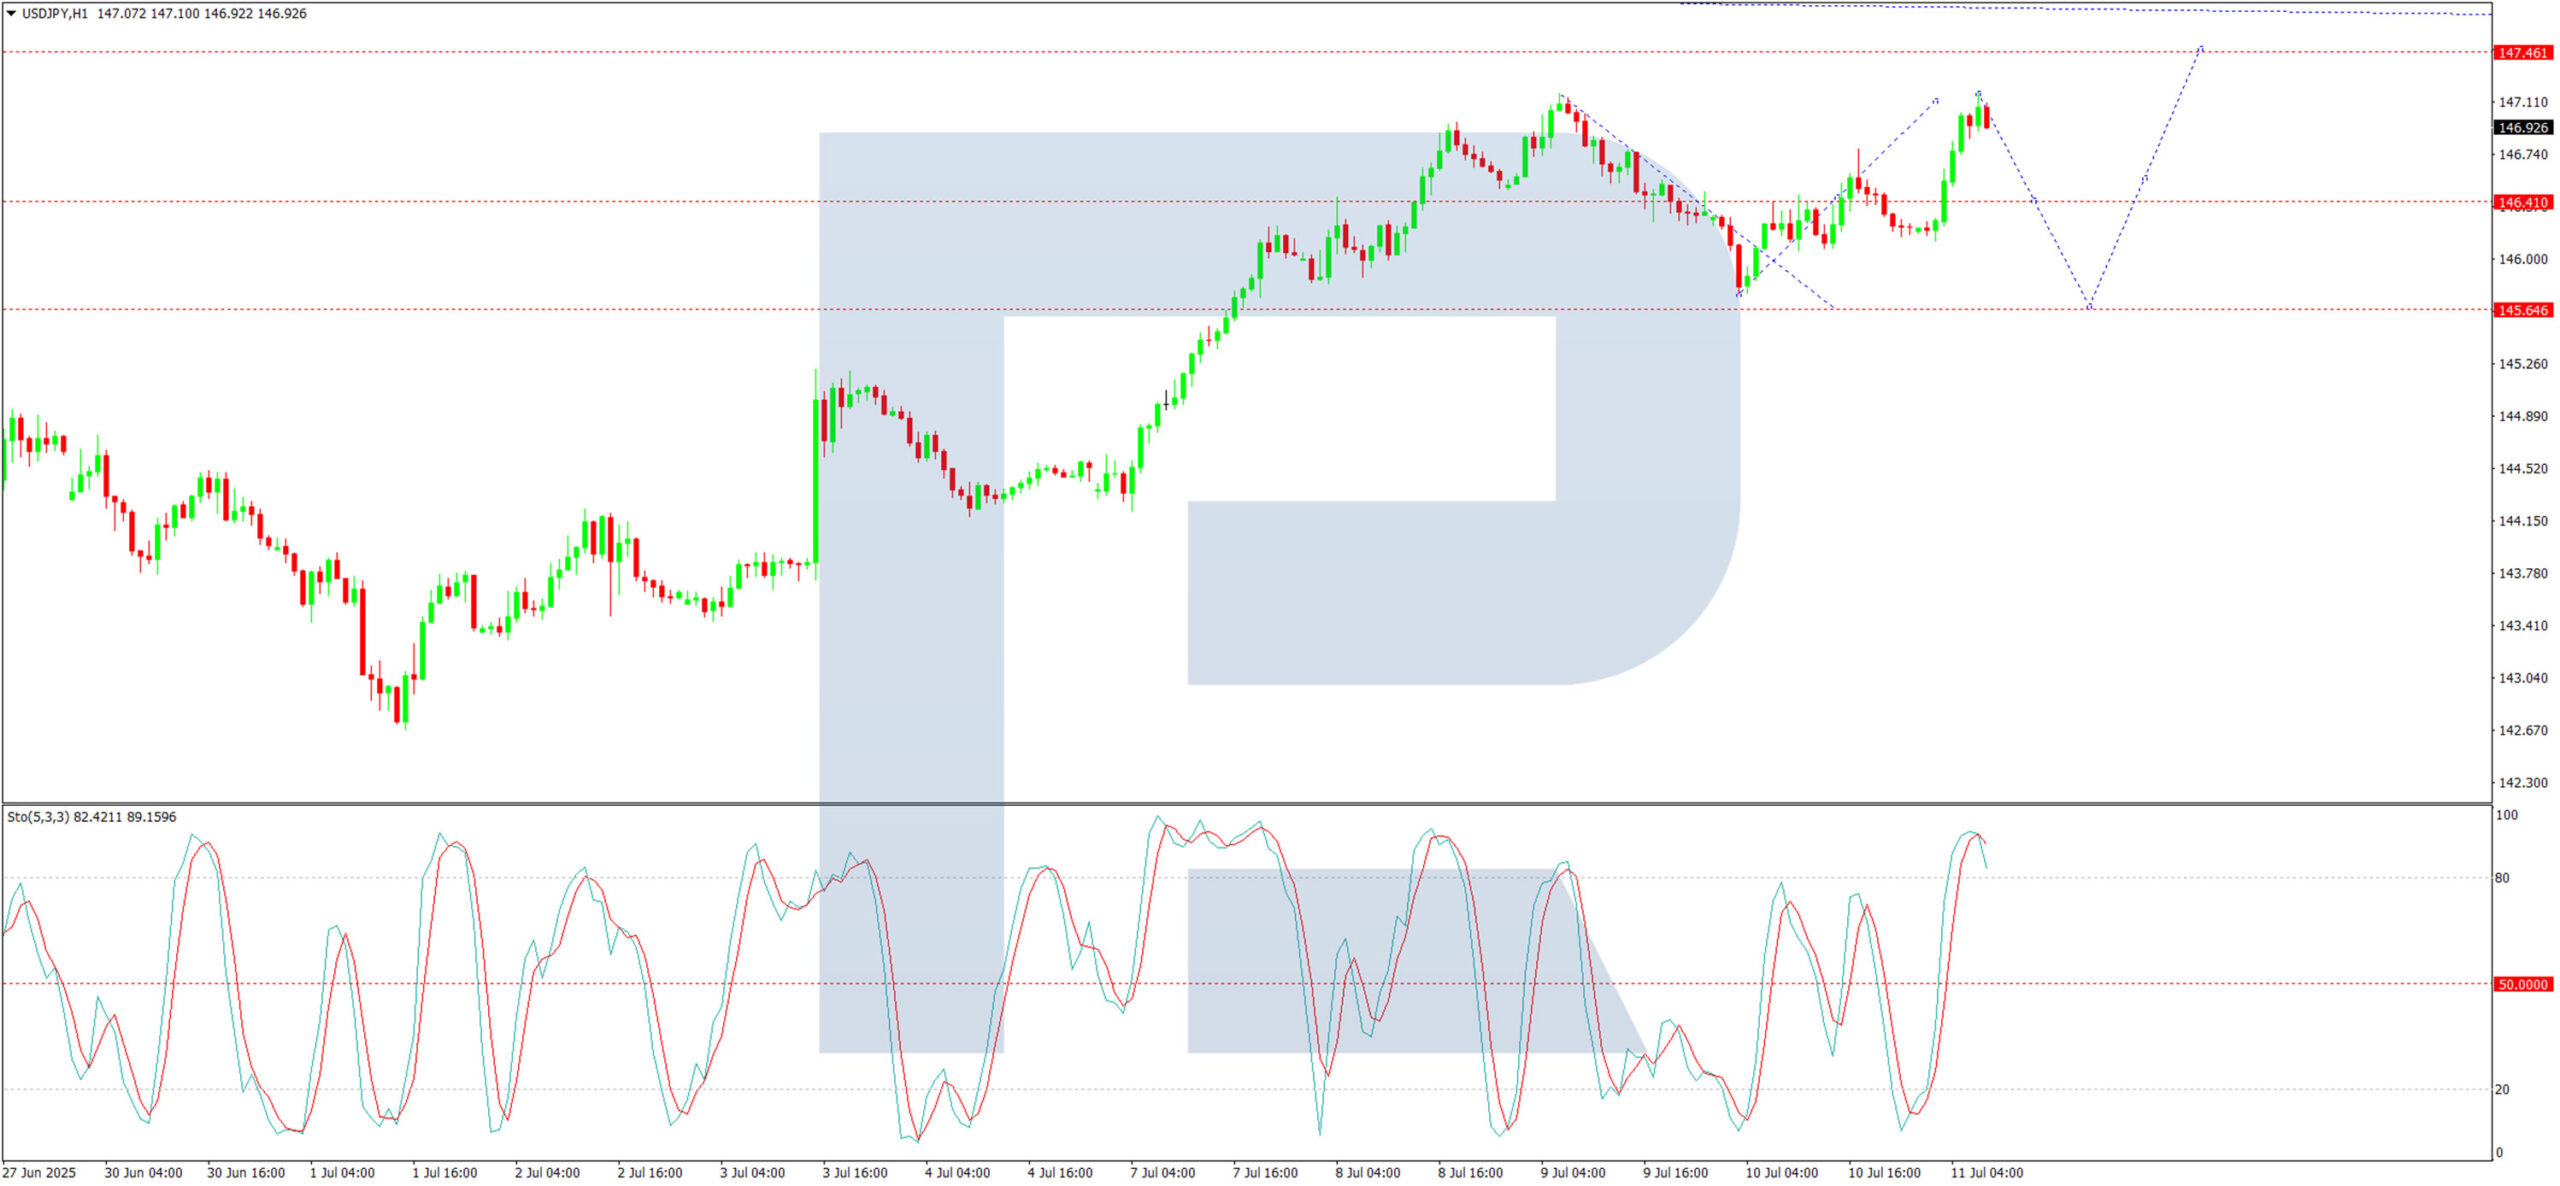
          H1 Chart:

          A consolidation phase near 146.41 preceded an upward breakout, completing a wave structure at 147.17. A downward correction towards 145.65 is now in view, corroborated by the Stochastic oscillator, where the signal line sits at 80 and points sharply downward.

          Conclusion

          The yen’s weakness persists amid dollar strength and trade uncertainties, with technical indicators suggesting near-term volatility. Traders should monitor 145.65 as a key support level, while further upside towards 147.47 remains plausible.

          Source: ACTIONFOREX

          To stay updated on all economic events of today, please check out our Economic calendar
          Risk Warnings and Disclaimers
          You understand and acknowledge that there is a high degree of risk involved in trading. Following any strategies or investment methods may lead to potential losses. The content on the site is provided by our contributors and analysts for information purposes only. You are solely responsible for determining whether any trading assets, securities, strategy, or any other product is suitable for investing based on your own investment objectives and financial situation.
          Add to Favorites
          Share

          IEA Boosts 2025 Oil Supply Forecast After Latest Opec+ Hike

          Daniel Carter

          Commodity

          Economic

          The International Energy Agency on Friday raised its forecast for supply growth this year after Opec+'s latest decision to pump more oil, while it trimmed its outlook for demand, saying that in recent months, oil use has slowed down significantly.
          The IEA expects global supply to rise by 2.1 million barrels per day this year, up 300,000 bpd from the previous forecast, the agency, which advises industrialised countries, said in a monthly report.
          Opec+ is adding more crude to the market after the group decided to unwind its most recent layer of output cuts in April and accelerate the hikes from May, June, July and August.
          Even so, the IEA said that rising refinery processing rates to meet summer travel and power-generation demand were tightening the market.
          "Price indicators also point to a tighter physical oil market than suggested by the hefty surplus in our balances," the agency said.

          Source: Theedgemarkets

          To stay updated on all economic events of today, please check out our Economic calendar
          Risk Warnings and Disclaimers
          You understand and acknowledge that there is a high degree of risk involved in trading. Following any strategies or investment methods may lead to potential losses. The content on the site is provided by our contributors and analysts for information purposes only. You are solely responsible for determining whether any trading assets, securities, strategy, or any other product is suitable for investing based on your own investment objectives and financial situation.
          Add to Favorites
          Share

          Gold Steadies Above $3,330 as Traders Weigh Tariff Risks and Fed Rate Path

          Gerik

          Economic

          Commodity

          Gold Holds Ground Amid Trump Tariff Threats and Fed Policy Uncertainty

          The gold market maintained its upward momentum into Friday, as traders absorbed two key forces: escalating trade tensions initiated by President Donald Trump and an increasingly divided U.S. Federal Reserve over the timing of potential interest rate cuts. The metal traded at $3,334.27 an ounce by 8:15 a.m. London time, extending gains from Wednesday and Thursday but still recovering from an earlier weekly drop.
          The rise in gold’s value reflects its traditional role as a safe-haven asset during periods of global uncertainty. President Trump this week proposed sweeping new tariffs targeting countries such as Canada and Brazil, and notably slapped a substantial tariff on copper imports set to take effect August 1. These policy shifts sparked fresh investor concerns about the fragility of global trade and industrial demand, driving money back into gold.

          Interest Rate Outlook Remains Divided as Fed Officials Signal Uncertainty

          On the monetary policy front, the Federal Reserve has so far maintained steady interest rates in 2025, but internal disagreements have started to surface. Mary Daly, President of the San Francisco Fed, reiterated her view that two rate cuts are still possible this year, citing confidence that the inflationary effects of tariffs might be milder than markets fear.
          Lower interest rates tend to favor non-yielding assets like gold by reducing the opportunity cost of holding them. This prospect, combined with Trump's aggressive stance on trade, has led to continued speculation that the Fed may have to ease policy in response to a cooling global economy or deteriorating sentiment.

          Gold’s Rally Fueled by Multiple Drivers

          The latest uptick in gold comes after a sharp rally earlier this year, when prices breached $3,500 an ounce in April, fueled by central-bank purchases, geopolitical instability, and dovish expectations from global monetary authorities. So far in 2025, gold has gained over 25%, making it one of the best-performing assets in a volatile macroeconomic environment.
          Traders now eye both macroeconomic data releases and any signals from upcoming Fed meetings to refine their expectations. At the same time, the Trump administration's unpredictable trade policies continue to act as a source of volatility, strengthening gold's appeal as a risk hedge.

          Broader Precious Metals Market Mixed

          In other metals markets, silver prices edged higher, benefiting from both industrial and haven demand, while platinum and palladium slipped, reflecting lingering concerns over global auto production and industrial consumption. The Bloomberg Dollar Spot Index, a key gauge of dollar strength, rose 0.2%, capping further upside for dollar-denominated commodities like gold.
          Gold's continued resilience underscores a fragile risk sentiment across global markets. As long as Trump's tariff strategy injects uncertainty into trade flows and the Federal Reserve remains ambiguous about its policy path, gold is likely to maintain a strong floor, with traders watching closely for signs of renewed upside toward April’s highs.

          Source: Bloomberg

          To stay updated on all economic events of today, please check out our Economic calendar
          Risk Warnings and Disclaimers
          You understand and acknowledge that there is a high degree of risk involved in trading. Following any strategies or investment methods may lead to potential losses. The content on the site is provided by our contributors and analysts for information purposes only. You are solely responsible for determining whether any trading assets, securities, strategy, or any other product is suitable for investing based on your own investment objectives and financial situation.
          Add to Favorites
          Share
          FastBull
          Copyright © 2025 FastBull Ltd

          728 RM B 7/F GEE LOK IND BLDG NO 34 HUNG TO RD KWUN TONG KLN HONG KONG

          TelegramInstagramTwitterfacebooklinkedin
          App Store Google Play Google Play
          Products
          Charts

          Chats

          Q&A with Experts
          Screeners
          Economic Calendar
          Data
          Tools
          Membership
          Features
          Function
          Markets
          Copy Trading
          Latest Signals
          Contests
          News
          Analysis
          24/7
          Columns
          Education
          Company
          Careers
          About Us
          Contact Us
          Advertising
          Help Center
          Feedback
          User Agreement
          Privacy Policy
          Business

          White Label

          Data API

          Web Plug-ins

          Poster Maker

          Affiliate Program

          Risk Disclosure

          The risk of loss in trading financial instruments such as stocks, FX, commodities, futures, bonds, ETFs and crypto can be substantial. You may sustain a total loss of the funds that you deposit with your broker. Therefore, you should carefully consider whether such trading is suitable for you in light of your circumstances and financial resources.

          No decision to invest should be made without thoroughly conducting due diligence by yourself or consulting with your financial advisors. Our web content might not suit you since we don't know your financial conditions and investment needs. Our financial information might have latency or contain inaccuracy, so you should be fully responsible for any of your trading and investment decisions. The company will not be responsible for your capital loss.

          Without getting permission from the website, you are not allowed to copy the website's graphics, texts, or trademarks. Intellectual property rights in the content or data incorporated into this website belong to its providers and exchange merchants.

          Not Logged In

          Log in to access more features

          FastBull Membership

          Not yet

          Purchase

          Become a signal provider
          Help Center
          Customer Service
          Dark Mode
          Price Up/Down Colors

          Log In

          Sign Up

          Position
          Layout
          Fullscreen
          Default to Chart
          The chart page opens by default when you visit fastbull.com