• Trade
  • Markets
  • Copy
  • Contests
  • 24/7
  • Calendar
  • Q&A
  • Chats
Screeners
SYMBOL
LAST
BID
ASK
HIGH
LOW
NET CHG.
%CHG.
SPREAD
SOURCE
SPX
S&P 500 Index
7554.28
7554.28
7554.28
7577.92
7516.75
+122.83
+ 1.65%
--
--
DJI
Dow Jones Industrial Average
51671.02
51671.02
51671.02
51945.89
51647.50
+468.77
+ 0.92%
--
--
IXIC
NASDAQ Composite Index
26683.93
26683.93
26683.93
26687.56
26438.77
+795.10
+ 3.07%
--
--
USDX
US Dollar Index
99.430
99.430
99.510
99.440
99.330
+0.120
+ 0.12%
--
--
EURUSD
Euro / US Dollar
1.15846
1.15846
1.15853
1.15948
1.15825
-0.00042
-0.04%
--
--
GBPUSD
Pound Sterling / US Dollar
1.33998
1.33998
1.34009
1.34177
1.33969
-0.00107
-0.08%
--
--
XAUUSD
Gold / US Dollar
4310.87
4310.87
4311.32
4325.78
4305.88
+2.52
+ 0.06%
--
--
WTI
Light Sweet Crude Oil
79.564
79.564
79.599
80.135
79.464
-0.274
-0.34%
--
--

Community Accounts

Signal Accounts
--
Profit Accounts
--
Loss Accounts
--
View More

Become a signal provider

Sell trading signals to earn additional income

View More

Guide to Copy Trading

Get started with ease and confidence

View More

Signal Accounts for Members

All Signal Accounts

Best Return
  • Best Return
  • Best P/L
  • Best MDD
Past 1W
  • Past 1W
  • Past 1M
  • Past 1Y

All Contests

  • All
  • Recommend
  • Stocks
  • Cryptocurrencies
  • Central Banks
  • Trump Updates
  • Featured News
Top News Only
Share

According To The National Bureau Of Statistics, Cement Production In May Was 149.91 Million Tons, Down 8.1% Year-on-Year. From January To May, Cumulative Cement Production Was 590.91 Million Tons, Down 8.6% Year-on-Year

Share

According To The National Bureau Of Statistics, Primary Aluminum (electrolytic Aluminum) Production In May Was 3.89 Million Tons, Up 1.7% Year-on-Year. From January To May, The Cumulative Production Of Primary Aluminum (electrolytic Aluminum) Was 19.22 Million Tons, Up 3.5% Year-on-Year

Share

The Main Polypropylene (PP) Contract Fell Below 8,000 Yuan/ton, Down 4.36% On The Day

Share

National Bureau Of Statistics: Imports And Exports Posted Robust Growth, And The Trade Structure Continued To Improve

Share

The Main Methanol Futures Contract Fell 6.00% Intraday, Currently Trading At 2676.00 Yuan/ton

Share

National Bureau Of Statistics: Natural Gas Production Declined Slightly. In May, Natural Gas Output From Industrial Enterprises Above Designated Size Totaled 21.7 Billion Cubic Meters, Down 2.2% Year On Year, Compared With A 1.9% Increase In April; The Average Daily Output Was 700 Million Cubic Meters. From January To May, Natural Gas Production By These Enterprises Reached 111.7 Billion Cubic Meters, Up 1.7% Year On Year

Share

National Bureau Of Statistics: Crude Oil Production Posted Steady Growth. In May, Crude Oil Output From Industrial Enterprises Above Designated Size Reached 18.57 Million Tonnes, Up 0.5% Year On Year; The Growth Rate Slowed By 0.7 Percentage Points Compared With April, With An Average Daily Output Of 599,000 Tonnes. From January To May, Crude Oil Production By These Enterprises Totaled 91.31 Million Tonnes, A Year-on-Year Increase Of 1.1%

Share

National Bureau Of Statistics: Raw Coal Production Remained At A High Level. In May, The Output Of Raw Coal From Industrial Enterprises Above Designated Size Was 400 Million Tons, A Year-on-Year Decrease Of 1.7%; The Average Daily Output Was 12.81 Million Tons. From January To May, The Output Of Raw Coal From Industrial Enterprises Above Designated Size Was 1.98 Billion Tons, A Year-on-Year Decrease Of 0.3%

Share

National Bureau Of Statistics: From January To May, The Total Retail Sales Of Consumer Goods And Services Increased By 2.8% Year On Year

Share

National Bureau Of Statistics: From January To May, Nationwide Online Retail Sales Of Goods And Services Totaled RMB 8.3177 Trillion, Up 5.9% Year On Year. Among Them, Online Retail Sales Of Goods Reached RMB 5.2718 Trillion, An Increase Of 5.0%; Within This Category, Sales Of Food, Apparel, And Daily-use Products Rose By 15.5%, 7.2%, And 1.6%, Respectively. Online Retail Sales Of Services Amounted To RMB 3.0459 Trillion, Up 7.6%

Share

National Bureau Of Statistics: Industrial Investment Grew 0.1% Year-on-Year From January To May

Share

National Bureau Of Statistics: The National Services Production Index Rose By 4.4% Year-on-Year In May

Share

National Bureau Of Statistics: In May, New-energy Vehicle Production Reached 1.489 Million Units, Up 17.8% Year On Year

Share

National Bureau Of Statistics: From January To May, The Sales Area Of Newly Built Commercial Housing Totaled 313.2 Million Square Meters, Down 10.8% Year On Year

Share

In May, China's Urban Fixed-asset Investment Fell 1.91% Month-on-month, Compared With A Previous Reading Of -2.36%

Share

National Bureau Of Statistics: In May, The Output Of 3D Printing Equipment, Lithium-ion Batteries, And Industrial Robots Increased Year On Year By 54.4%, 40.0%, And 27.9%, Respectively

Share

In May, China's Industrial Value-added Growth For Enterprises Above Designated Size Rose 0.4% Month-on-month, Compared With The Previous Reading Of 0.05%

Share

China's Total Retail Sales Of Consumer Goods Rose By -0.38% Month-over-month In May, Compared To A Previous Reading Of -0.48%

Share

According To The National Bureau Of Statistics, In May, The Production Of Raw Coal By Industrial Enterprises Above A Designated Size Remained At A High Level, Crude Oil Production Grew Steadily, Natural Gas Production Declined Slightly, And The Growth Rate Of Electricity Production Accelerated

Share

According To The National Bureau Of Statistics, From January To May, National Real Estate Development Investment Totaled 3.0356 Trillion Yuan, A Year-on-Year Decrease Of 16.2%; Among Which, Residential Investment Totaled 2.3426 Trillion Yuan, A Decrease Of 15.6%

TIME
ACT
FCST
PREV
IMPACT
U.S. Weekly Total Rig Count

A:--

F: --

P: --

WTI
  • WTI
  • XAUUSD
  • XAGUSD
  • USDX
U.S. Weekly Total Oil Rig Count

A:--

F: --

P: --

WTI
  • WTI
  • XAUUSD
  • XAGUSD
  • USDX
U.K. Rightmove House Price Index YoY (Jun)

A:--

F: --

P: --

GBPUSD
  • GBPUSD
  • XAUUSD
  • XAGUSD
  • WTI
  • USDX
ECB President Lagarde Speaks
Euro Zone Industrial Output YoY (Apr)

A:--

F: --

P: --
EURUSD
  • EURUSD
  • XAUUSD
  • XAGUSD
  • WTI
  • USDX
Euro Zone Trade Balance (Not SA) (Apr)

A:--

F: --

P: --
EURUSD
  • EURUSD
  • XAUUSD
  • XAGUSD
  • WTI
  • USDX
Euro Zone Trade Balance (SA) (Apr)

A:--

F: --

P: --
EURUSD
  • EURUSD
  • XAUUSD
  • XAGUSD
  • WTI
  • USDX
Euro Zone Industrial Output MoM (Apr)

A:--

F: --

P: --
EURUSD
  • EURUSD
  • XAUUSD
  • XAGUSD
  • WTI
  • USDX
Euro Zone Total Reserve Assets (May)

A:--

F: --

P: --

EURUSD
  • EURUSD
  • XAUUSD
  • XAGUSD
  • WTI
  • USDX
Canada National Economic Confidence Index

A:--

F: --

P: --

USDCAD
  • USDCAD
  • XAUUSD
  • XAGUSD
  • WTI
  • USDX
Canada New Housing Starts (May)

A:--

F: --

P: --
USDCAD
  • USDCAD
  • XAUUSD
  • XAGUSD
  • WTI
  • USDX
Canada Manufacturing New Orders MoM (Apr)

A:--

F: --

P: --

USDCAD
  • USDCAD
  • XAUUSD
  • XAGUSD
  • WTI
  • USDX
Canada Manufacturing Unfilled Orders MoM (Apr)

A:--

F: --

P: --

USDCAD
  • USDCAD
  • XAUUSD
  • XAGUSD
  • WTI
  • USDX
U.S. NY Fed Manufacturing Employment Index (Jun)

A:--

F: --

P: --

USDX
  • USDX
  • XAUUSD
  • XAGUSD
  • WTI
U.S. NY Fed Manufacturing New Orders Index (Jun)

A:--

F: --

P: --

USDX
  • USDX
  • XAUUSD
  • XAGUSD
  • WTI
U.S. NY Fed Manufacturing Prices Received Index (Jun)

A:--

F: --

P: --

USDX
  • USDX
  • XAUUSD
  • XAGUSD
  • WTI
Canada Wholesale Inventory MoM (Apr)

A:--

F: --

P: --

USDCAD
  • USDCAD
  • XAUUSD
  • XAGUSD
  • WTI
  • USDX
Canada Wholesale Sales YoY (Apr)

A:--

F: --

P: --

USDCAD
  • USDCAD
  • XAUUSD
  • XAGUSD
  • WTI
  • USDX
Canada Manufacturing Inventory MoM (Apr)

A:--

F: --

P: --

USDCAD
  • USDCAD
  • XAUUSD
  • XAGUSD
  • WTI
  • USDX
Canada Wholesale Inventory YoY (Apr)

A:--

F: --

P: --

USDCAD
  • USDCAD
  • XAUUSD
  • XAGUSD
  • WTI
  • USDX
Canada Wholesale Sales MoM (SA) (Apr)

A:--

F: --

P: --
USDCAD
  • USDCAD
  • XAUUSD
  • XAGUSD
  • WTI
  • USDX
U.S. NY Fed Manufacturing Index (Jun)

A:--

F: --

P: --

USDX
  • USDX
  • XAUUSD
  • XAGUSD
  • WTI
U.S. Industrial Output MoM (SA) (May)

A:--

F: --

P: --
USDX
  • USDX
  • XAUUSD
  • XAGUSD
  • WTI
U.S. Capacity Utilization MoM (SA) (May)

A:--

F: --

P: --

WTI
  • WTI
  • XAUUSD
  • XAGUSD
  • USDX
U.S. Manufacturing Output MoM (SA) (May)

A:--

F: --

P: --
USDX
  • USDX
  • XAUUSD
  • XAGUSD
  • WTI
U.S. Industrial Output YoY (May)

A:--

F: --

P: --

USDX
  • USDX
  • XAUUSD
  • XAGUSD
  • WTI
U.S. Manufacturing Capacity Utilization (May)

A:--

F: --

P: --

USDX
  • USDX
  • XAUUSD
  • XAGUSD
  • WTI
U.S. NAHB Housing Market Index (Jun)

A:--

F: --

P: --

USDX
  • USDX
  • XAUUSD
  • XAGUSD
  • WTI
Saudi Arabia CPI YoY (May)

A:--

F: --

P: --

China, Mainland Urban Area Unemployment Rate (May)

A:--

F: --

P: --

XAUUSD
  • XAUUSD
  • XAGUSD
  • WTI
  • USDX
China, Mainland Industrial Output YoY (YTD) (May)

A:--

F: --

P: --

XAUUSD
  • XAUUSD
  • XAGUSD
  • WTI
  • USDX
Japan Benchmark Interest Rate

--

F: --

P: --

BOJ Monetary Policy Statement
Australia Overnight (Borrowing) Key Rate

--

F: --

P: --

RBA Rate Statement
BOJ Press Conference
Turkey Retail Sales YoY (Apr)

--

F: --

P: --

Euro Zone Gross Wages YoY (Q1)

--

F: --

P: --

Euro Zone ZEW Current Conditions Index (Jun)

--

F: --

P: --

Germany ZEW Economic Sentiment Index (Jun)

--

F: --

P: --

Canada Existing Home Sales MoM (May)

--

F: --

P: --

Euro Zone Labor Cost YoY (Q1)

--

F: --

P: --

Euro Zone ZEW Economic Sentiment Index (Jun)

--

F: --

P: --

Germany ZEW Current Conditions Index (Jun)

--

F: --

P: --

Brazil Retail Sales MoM (Apr)

--

F: --

P: --

U.S. Import Price Index YoY (May)

--

F: --

P: --

U.S. Building Permits MoM (SA) (May)

--

F: --

P: --

U.S. New Housing Starts Annualized MoM (SA) (May)

--

F: --

P: --

U.S. Export Price Index MoM (May)

--

F: --

P: --

U.S. Export Price Index YoY (May)

--

F: --

P: --

U.S. Import Price Index MoM (May)

--

F: --

P: --

U.S. Total Building Permits (SA) (May)

--

F: --

P: --

U.S. Annual New Housing Starts (SA) (May)

--

F: --

P: --

U.S. Weekly Redbook Index YoY

--

F: --

P: --

ECB Chief Economist Lane Speaks
U.S. API Weekly Refined Oil Stocks

--

F: --

P: --

U.S. API Weekly Gasoline Stocks

--

F: --

P: --

U.S. API Weekly Cushing Crude Oil Stocks

--

F: --

P: --

U.S. API Weekly Crude Oil Stocks

--

F: --

P: --

Japan Reuters Tankan Manufacturers Index (Jun)

--

F: --

P: --

Q&A with Experts
    • All
    • Chatrooms
    • Groups
    • Friends
    Tom Moffitt flag
    风神1号
    00:15
    @风神1号On fire mate
    Tom Moffitt flag
    You are a legend.
    KPRLPMLM46 flag
    Tom Moffitt
    @KPRLPMLM46 What are the levels for the lower liquidity sweep.?
    @Tom Moffitt 4,280
    Tom Moffitt flag
    KPRLPMLM46
    @Tom Moffitt 4,280
    @KPRLPMLM46 I was on the same page but the last 15 min candles kept me thinking why is it going up from there.
    风神1号 flag
    昨晚 黄金 的收益也不错最高到了4369
    风神1号 flag
    77 flag
    风神1号
    昨晚 黄金 的收益也不错最高到了4369
    @风神1号 我保损在60
    风神1号 flag
    对啊做这个交易赚钱了必须保損 下来我们还是赚钱了
    77 flag
    是的,保损看目标,怎样都是好的结果
    4769526 flag
    Strong bearish today gold
    Man Chez flag
    @风神1号what of today?
    𝐊𝐚𝐩𝐨𝐱 𝐟𝐱 𝐯𝐥𝐩 flag
    𝐊𝐚𝐩𝐨𝐱 𝐟𝐱 𝐯𝐥𝐩 flag
    𝐊𝐚𝐩𝐨𝐱 𝐟𝐱 𝐯𝐥𝐩 flag
    Gold on fire
    Man Chez flag
    @𝐊𝐚𝐩𝐨𝐱 𝐟𝐱 𝐯𝐥𝐩 your tp?
    𝐊𝐚𝐩𝐨𝐱 𝐟𝐱 𝐯𝐥𝐩 flag
    4280
    "𝐊𝐚𝐩𝐨𝐱 𝐟𝐱 𝐯𝐥𝐩" recalled a message
    jino james flag
    jino james flag
    nice one
    Man Chez flag
    @jino james your s.l and tp?
    Type here...
    Add Symbol or Code

      No matching data

      All
      Recommend
      Stocks
      Cryptocurrencies
      Central Banks
      Trump Updates
      Featured News
      • All
      • Russia-Ukraine Conflict
      • Middle East Flashpoint
      • All
      • Russia-Ukraine Conflict
      • Middle East Flashpoint
      Search
      Products

      Charts Free Forever

      Chats Q&A with Experts
      Screeners Economic Calendar Data Tools
      Membership Features
      Data Warehouse Market Trends Institutional Data Policy Rates Macro

      Market Trends

      Market Sentiment Order Book Forex Correlations

      Top Indicators

      Charts Free Forever
      Markets

      News

      24/7 Analysis Education

      Latest Views

      Latest Update

      Signals

      Copy Rankings Latest Signals Become a signal provider AI Rating
      Contests
      Brokers

      Overview Brokers Assessment Rankings Regulators News Claims
      Broker listing Forex Brokers Comparison Tool Live Spread Comparison Scam
      Q&A Complaint Scam Alert Videos Tips to Detect Scam
      More

      Business
      Events
      Careers About Us Advertising Help Center

      White Label

      Broker API

      Data API

      Web Plug-ins

      Affiliate Program

      Awards Institution Evaluation IB Seminar Salon Event Exhibition
      Vietnam Thailand Singapore Dubai
      Fans Party Investment Sharing Session
      FastBull Summit BrokersView Expo
      Recent Searches
        Top Searches
          Markets
          Analysis
          User
          24/7
          Economic Calendar
          Education
          Data
          • Names
          • Latest
          • Prev

          View All

          No data

          Scan to Download

          Faster Charts, Chat Faster!

          Download
          English
          • English
          • Español
          • العربية
          • Bahasa Indonesia
          • Bahasa Melayu
          • Tiếng Việt
          • ภาษาไทย
          • Français
          • Italiano
          • Türkçe
          • Русский язык
          • 简中
          • 繁中
          Open Account
          Search
          Products
          Charts Free Forever
          Markets
          News
          Signals

          Copy Rankings Latest Signals Become a signal provider AI Rating
          Contests
          Brokers

          Overview Brokers Assessment Rankings Regulators News Claims
          Broker listing Forex Brokers Comparison Tool Live Spread Comparison Scam
          Q&A Complaint Scam Alert Videos Tips to Detect Scam
          More

          Business
          Events
          Careers About Us Advertising Help Center

          White Label

          Broker API

          Data API

          Web Plug-ins

          Affiliate Program

          Awards Institution Evaluation IB Seminar Salon Event Exhibition
          Vietnam Thailand Singapore Dubai
          Fans Party Investment Sharing Session
          FastBull Summit BrokersView Expo

          High Leverage Meaning in Trading: Risks vs. Rewards Explained

          zhan chen
          Summary:

          The high leverage meaning is clear: it is a double-edged sword. Discover how this powerful trading tool transforms market volatility into profit—or ruin.

          Understanding the high leverage meaning is crucial for anyone entering modern financial markets. It allows traders to control large positions with minimal upfront capital. This article breaks down the mechanics, regulatory limits, rewards, and significant risks of leveraged trading, equipping active investors with the knowledge to navigate margin effectively without blowing up their accounts.

          High Leverage Meaning in Trading: Risks vs. Rewards Explained

          What Does High Leverage Actually Mean in Trading?

          To understand how margin works, it helps to separate trading concepts from corporate finance. While the operating leverage formula measures a company's fixed costs against variable costs, and the financial leverage meaning generally relates to corporate debt structures, the leverage meaning in trading refers exclusively to purchasing power provided by a broker. It functions as a short-term credit line allowing you to execute larger trades.

          When you open an account, your broker assigns a financial leverage ratio, such as 30:1 or 50:1. This multiplier dictates exactly how much market exposure you can take relative to your cash deposit.

          How Leverage Lets You Control More Than You Deposit

          Leverage works by using your actual cash balance as a "margin" or security deposit. If you want to buy $100,000 worth of the EUR/USD currency pair, you do not need $100,000 in cash.

          If your broker provides a 50:1 leverage ratio, you only need to put up 2% of the total position size. In this scenario, a $2,000 deposit acts as the collateral required to control the entire $100,000 position. The broker essentially covers the remaining $98,000 while the trade is active.

          What "High" Leverage Looks Like Under Modern Regulations (30:1, 50:1, 100:1)

          Historically, retail brokers offered excessive leverage ratios, sometimes reaching 500:1 or 1000:1. Due to catastrophic retail losses, top-tier global regulators have since intervened to cap these multipliers.

          Today, what is considered "high" depends entirely on your jurisdiction:

          Regulator / JurisdictionMajor Forex PairsMinor Pairs & GoldCryptocurrencies
          ESMA (Europe) & FCA (UK)30:120:12:1
          CFTC (United States)50:120:1N/A
          Offshore (e.g., Vanuatu)Up to 500:1+Up to 500:1+Varies

          The European Securities and Markets Authority (ESMA) and the UK's Financial Conduct Authority (FCA) limit major forex leverage to 30:1. Meanwhile, the Commodity Futures Trading Commission (CFTC) allows up to 50:1 for major pairs in the United States.

          What Can You Realistically Gain From High Leverage?

          How Small Price Moves Turn Into Large Profits

          In highly liquid markets like foreign exchange, daily price fluctuations are minuscule, often moving by fractions of a cent. Without leverage, a 0.5% move in a currency pair would yield an insignificant return on a small cash deposit.

          Leverage amplifies these microscopic price movements into meaningful nominal profits. If you control a $100,000 position with a $2,000 deposit, that same 0.5% market move generates a $500 profit. Relative to your initial $2,000 margin, that represents a 25% return on invested capital in a single trade.

          Why High Leverage Attracts Traders With Limited Capital

          High leverage democratizes market access for retail investors who lack six-figure cash balances. It allows smaller participants to execute institutional-style strategies without tying up all their liquidity.

          By using margin, a trader with a $5,000 account can diversify across multiple positions—such as currencies, commodities, and indices—simultaneously. It improves capital efficiency, meaning your cash is not entirely locked into one single asset to see a worthwhile return.

          What Are the Real Risks of Trading With High Leverage?

          How Losses Scale Just as Fast as Gains

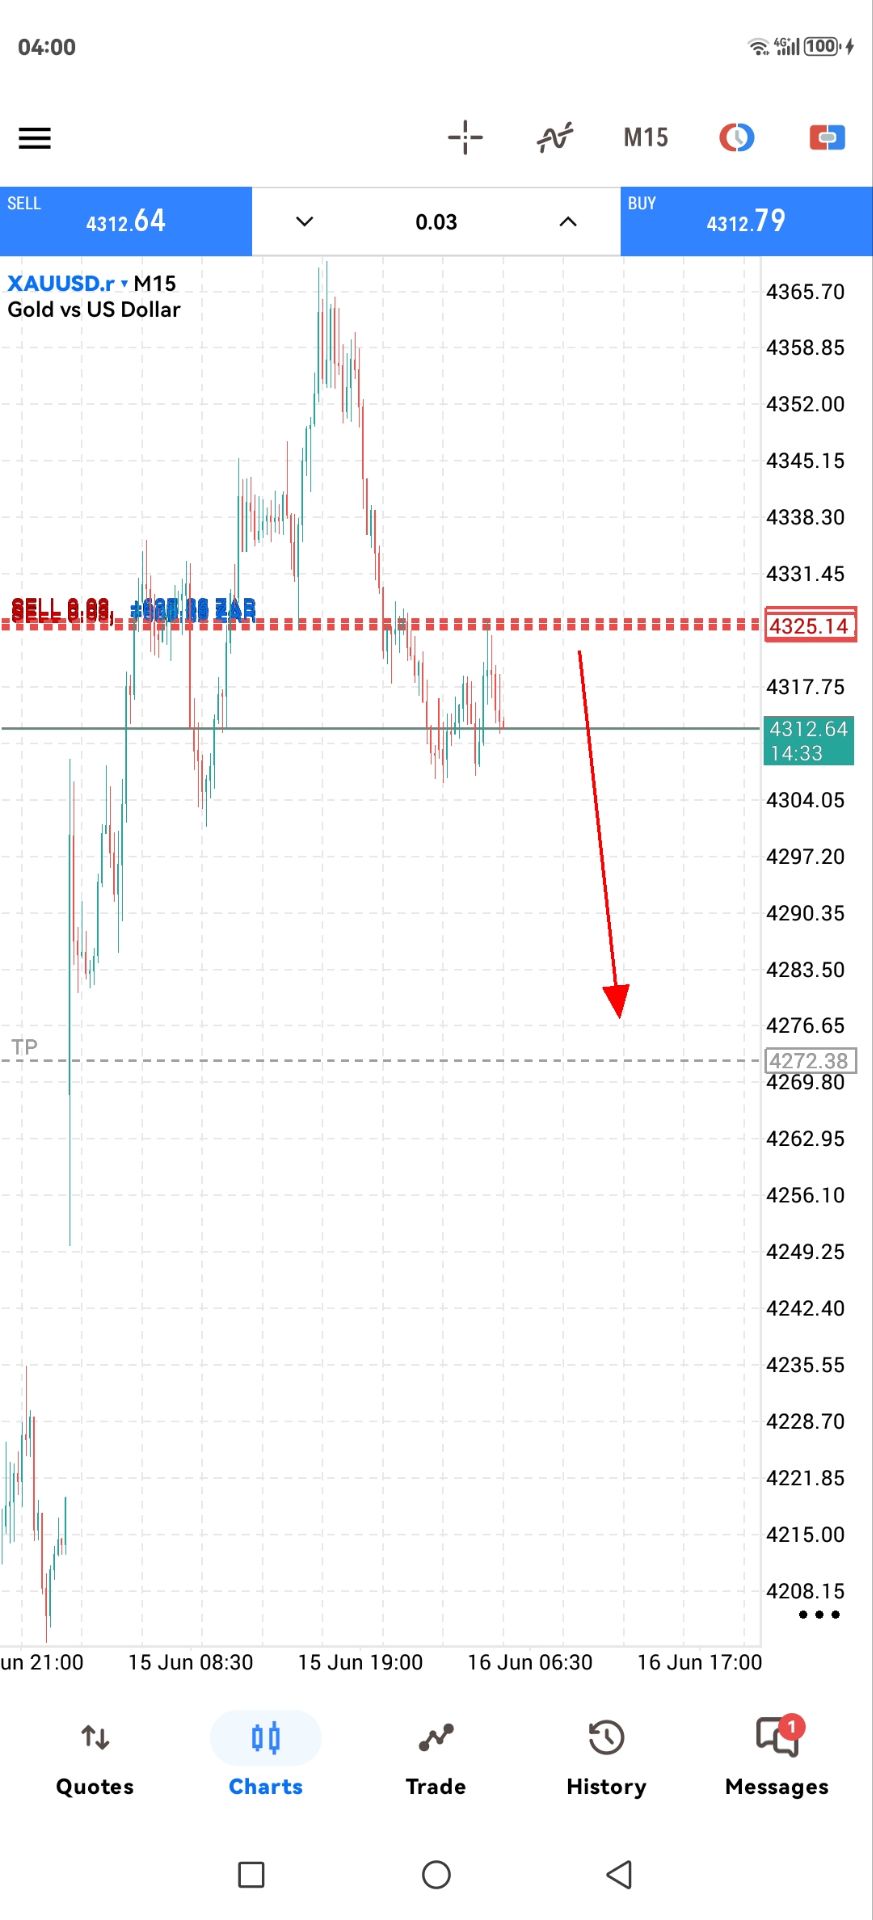
          The most dangerous aspect of leverage is its downside symmetry. While it multiplies your profits, it amplifies your losses at the exact same rate.

          If you use 50:1 leverage to control a $100,000 position with $2,000, a mere 2% adverse market movement results in a $2,000 loss. In an instant, that small market fluctuation wipes out 100% of your invested margin.

          What a Margin Call Means and When It Happens

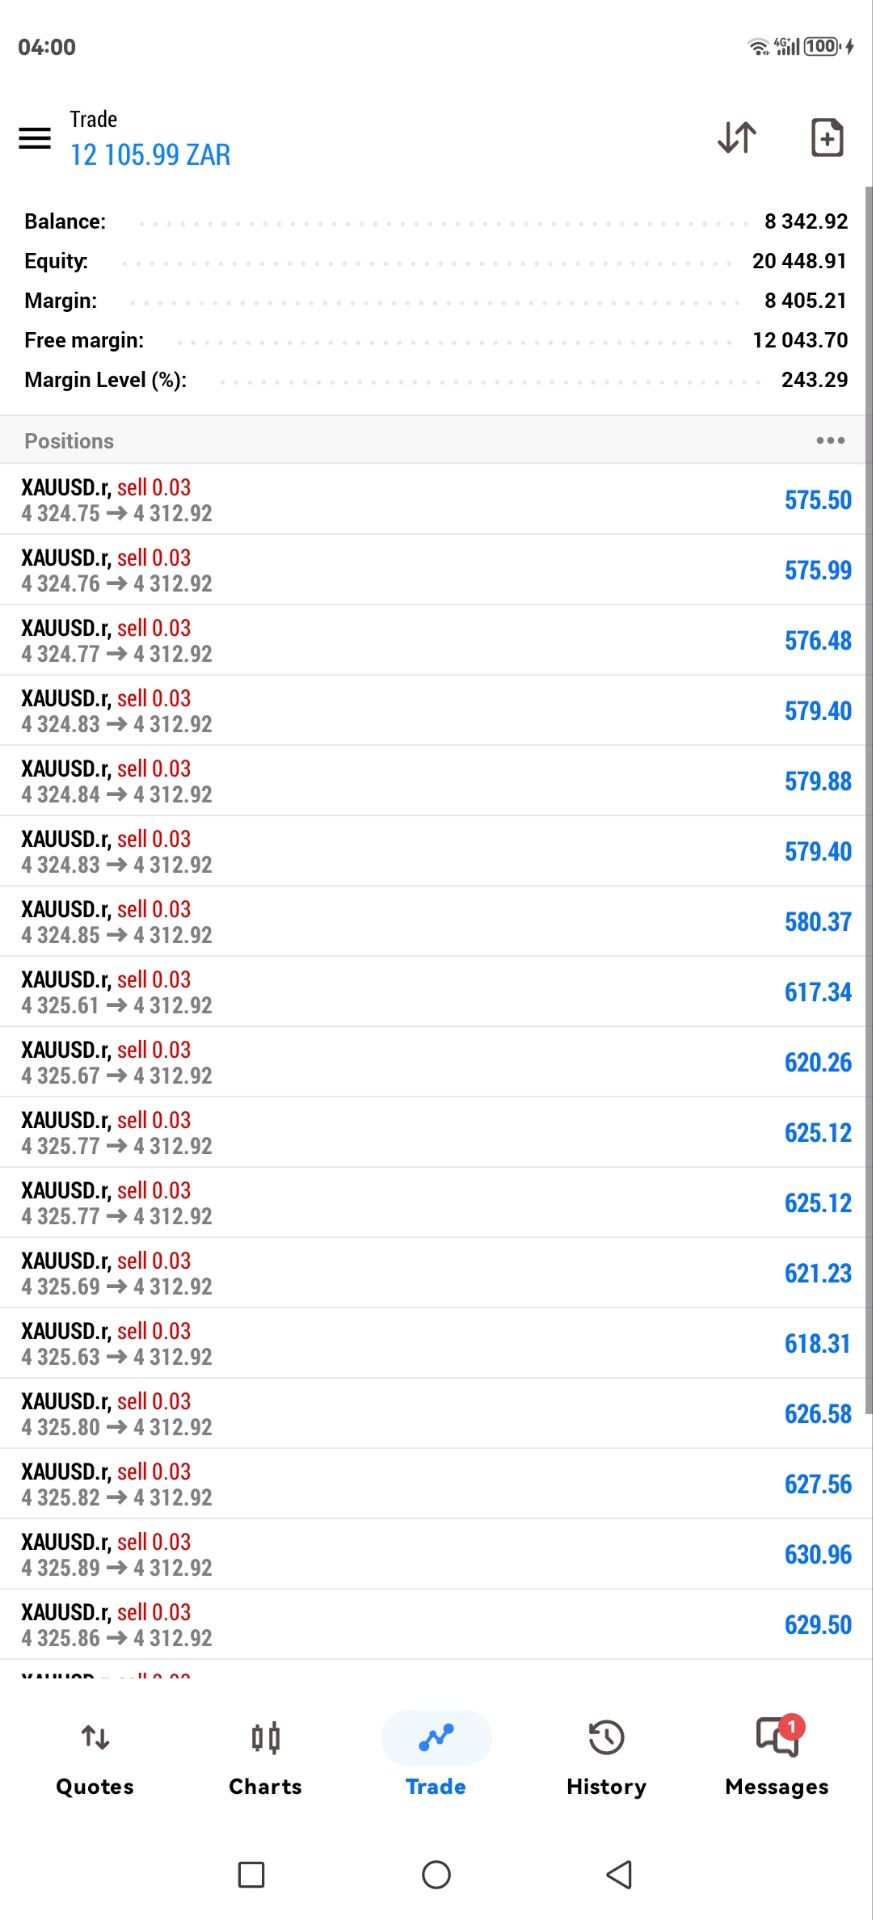
          A margin call occurs when your running losses deplete your account equity below the broker's minimum required threshold. When this happens, the broker will demand that you deposit more funds immediately to keep the position open.

          If you fail to add funds, the broker will automatically liquidate your trades to protect themselves from liability. Under strict European regulations, ESMA enforces a 50% margin close-out rule. This means if your equity drops to half of your required margin, the platform will systematically close your losing positions.

          How Quickly High Leverage Can Wipe Out an Account

          Financial markets are prone to sudden volatility, economic news shocks, and flash crashes. In highly leveraged accounts, a sudden price gap can blow past your intended exit point before you can react.

          Prior to regulatory interventions, these rapid crashes frequently caused traders to lose more than their initial deposits, leaving them in debt to their brokers. Today, regulators like ESMA and the FCA mandate "negative balance protection" to ensure retail clients cannot lose more than their account balance.

          Does High Leverage Actually Work in Your Favor Over Time?

          What the Data Says About Retail Traders Using High Leverage

          Statistical evidence paints a grim picture of high leverage in the hands of retail investors. Regulators require European and UK brokers to publish standardized risk warnings showing exact client loss rates.

          Data aggregated from these public disclosures reveals that between 70% and 80% of retail CFD traders lose money. The primary driver of these losses is not poor directional guessing, but excessive leverage combined with inadequate risk management. Conversely, the FCA reported that introducing leverage caps saved UK retail consumers hundreds of millions of pounds annually.

          When High Leverage Makes Sense vs. When It Doesn't

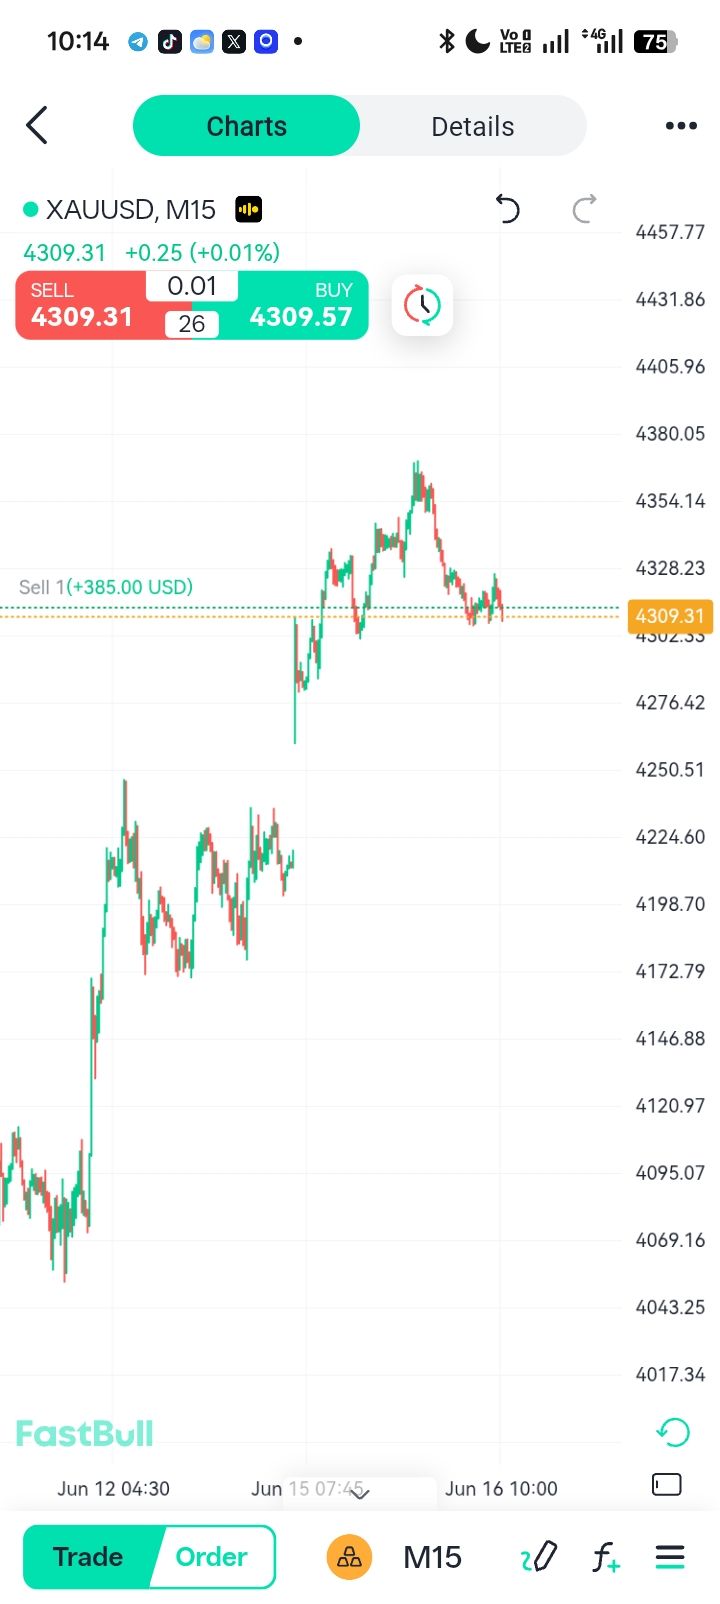
          High leverage makes sense for disciplined day traders trading highly liquid, low-volatility instruments like major forex pairs. These traders use tight stop-losses and capture small intraday trends without holding risk overnight.

          It does not make sense for long-term investors or those trading highly volatile assets like individual stocks and cryptocurrencies. The wider price swings inherent to volatile markets will inevitably trigger a margin close-out if the position is heavily leveraged.

          How Do You Use High Leverage Without Blowing Up Your Account?

          Why Position Sizing Matters More Than Leverage Ratio

          In corporate finance, executives analyze what is a good operating leverage and calculate their degree of operating leverage to understand how revenue changes impact corporate profits. In trading, your position sizing plays a similar role in protecting your equity.

          Just because your broker offers 50:1 leverage does not mean you must utilize all of it on a single trade. Professional traders calculate their risk based on their total account balance, ensuring they never risk more than 1% to 2% of their total equity per trade, regardless of the maximum purchasing power available.

          How Stop-Loss Orders Change the Risk Equation

          A strict stop-loss order is the ultimate defense against the dangers of margin trading. It acts as a predefined exit plan that automatically closes your position if the market moves against you by a specific amount.

          By placing a hard stop-loss on every trade, you determine your maximum exact loss before you even enter the market. This guarantees that a sudden market reversal will automatically cut your losses long before a catastrophic margin call is triggered.

          FAQs about high leverage meaning

          What does high leverage mean?

          High leverage means borrowing capital from a broker to open trade positions that are significantly larger than your initial cash deposit. It acts as a multiplier, amplifying both your potential profits and your potential losses based on the ratio provided.

          Is high leverage a good thing?

          High leverage is a neutral tool that provides capital efficiency for disciplined, professional traders, but it is highly destructive for beginners. Regulatory statistics consistently show that the majority of retail traders lose money when using high leverage without strict risk management.

          What are the risks associated with using high leverage?

          The primary risk is that a very small adverse price movement can quickly wipe out your entire deposited margin. In volatile market conditions, over-leveraged positions routinely trigger automatic margin close-outs, resulting in total account depletion.

          How does leverage amplify investment gains and losses?

          Leverage scales your exposure so that returns are calculated on the total borrowed position size rather than your small initial deposit. For instance, with 50:1 leverage, a 2% market move in your favor doubles your margin, but a 2% move against you results in a 100% loss.

          Conclusion

          Grasping the high leverage meaning is the first step toward responsible market participation. While margin provides the buying power to capitalize on small market movements, regulatory data proves it carries extreme risks. By combining strict position sizing with disciplined stop-loss strategies, investors can harness leverage without exposing their accounts to catastrophic losses.

          Risk Warnings and Disclaimers
          You understand and acknowledge that there is a high degree of risk involved in trading. Following any strategies or investment methods may lead to potential losses. The content on the site is provided by our contributors and analysts for information purposes only. You are solely responsible for determining whether any trading assets, securities, strategy, or any other product is suitable for investing based on your own investment objectives and financial situation.
          Add to Favorites
          Share
          FastBull
          Copyright © 2026 FastBull Ltd

          728 RM B 7/F GEE LOK IND BLDG NO 34 HUNG TO RD KWUN TONG KLN HONG KONG

          TelegramInstagramTwitterfacebooklinkedin
          App Store Google Play Android Windows
          Products
          Charts

          Chats

          Q&A with Experts
          Screeners
          Economic Calendar
          Data
          Tools
          Membership
          Features
          Function
          Markets
          Copy Trading
          Latest Signals
          Contests
          24/7
          Analysis
          Education
          Company
          Careers
          About Us
          Contact Us
          Advertising
          Download FastBull
          Help Center
          Feedback
          User Agreement
          Privacy Policy
          Personal Information Protection Statement
          Business

          White Label

          Broker API

          Data API

          Web Plug-ins

          Poster Maker

          Affiliate Program

          Risk Disclosure

          The risk of loss in trading financial instruments such as stocks, FX, commodities, futures, bonds, ETFs and crypto can be substantial. You may sustain a total loss of the funds that you deposit with your broker. Therefore, you should carefully consider whether such trading is suitable for you in light of your circumstances and financial resources.

          No decision to invest should be made without thoroughly conducting due diligence by yourself or consulting with your financial advisors. Our web content might not suit you since we don't know your financial conditions and investment needs. Our financial information might have latency or contain inaccuracy, so you should be fully responsible for any of your trading and investment decisions. The company will not be responsible for your capital loss.

          Without getting permission from the website, you are not allowed to copy the website's graphics, texts, or trademarks. Intellectual property rights in the content or data incorporated into this website belong to its providers and exchange merchants.

          Not Logged In

          Log in to access more features

          Connect Broker
          Become a signal provider
          Help Center
          Customer Service
          Dark Mode
          Price Up/Down Colors

          Log In

          Sign Up

          Position
          Layout
          Fullscreen
          Default to Chart
          The chart page opens by default when you visit fastbull.com