


- XAUUSD
- XAGUSD
- WTI
- USDX


Markets
Analysis
User
24/7
Economic Calendar
Education
Data
- Names
- Latest
- Prev


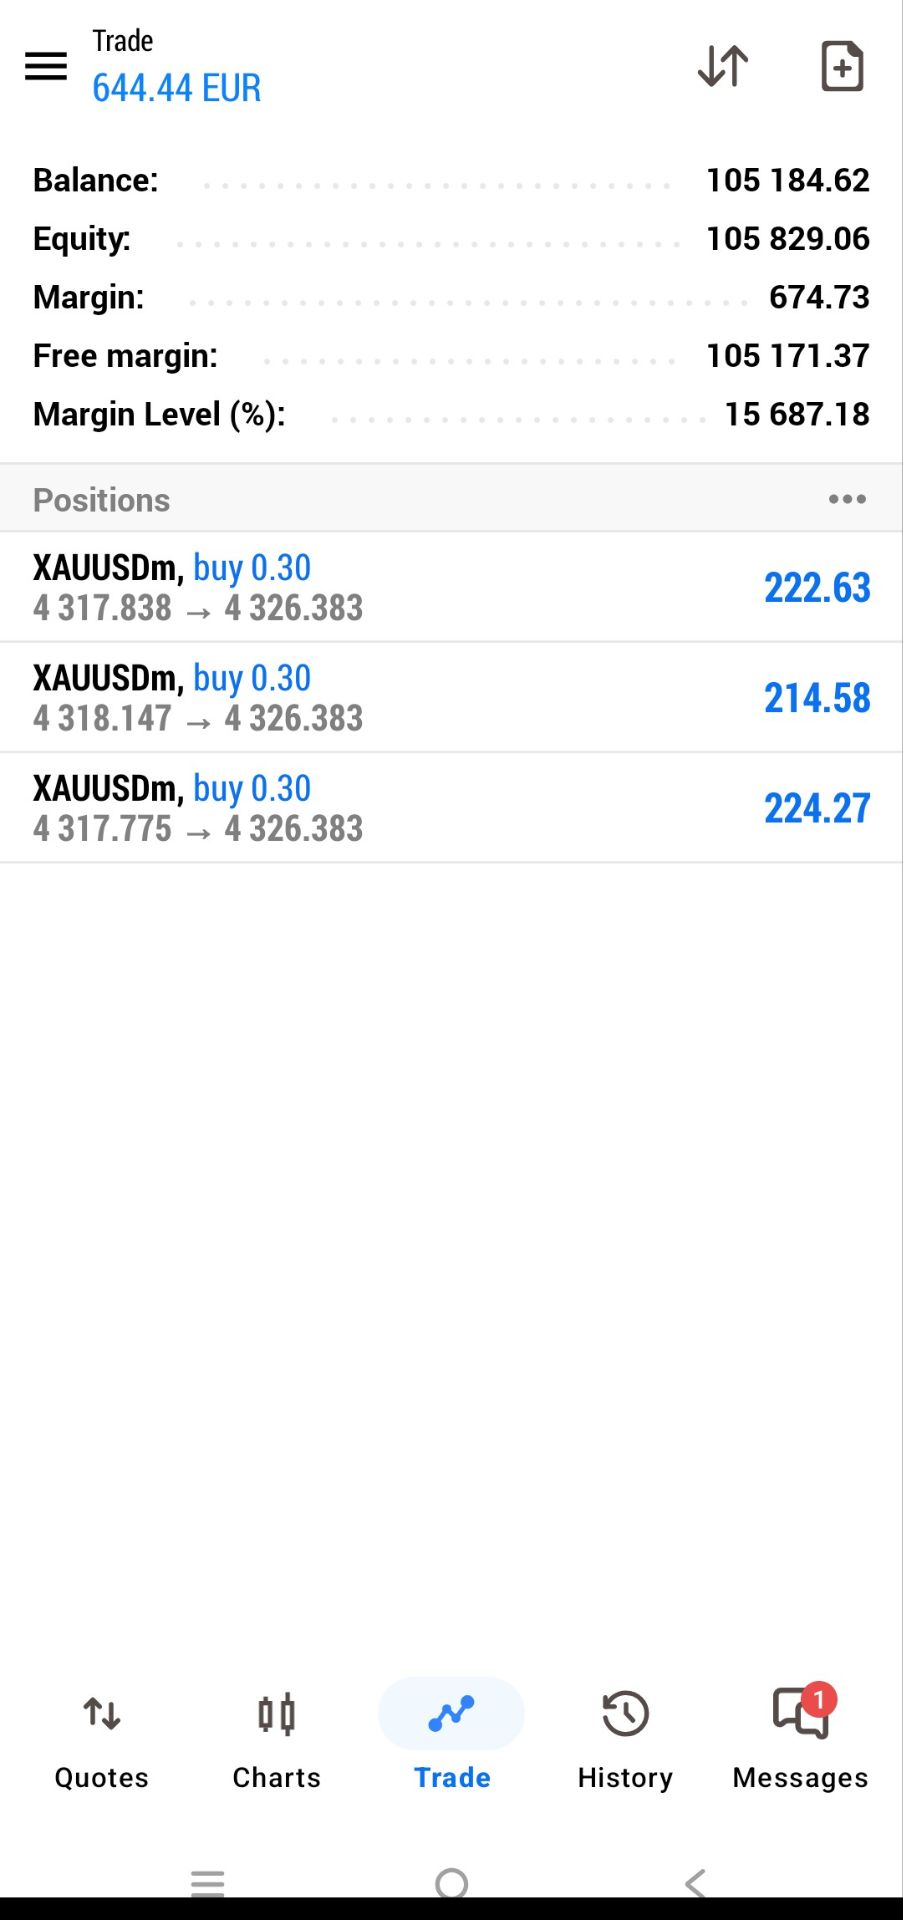


 早上你的多我没有进到还在睡觉…行情太迅猛了
GSK’s recent volatility invites scrutiny. We dissect the gsk share price trend, weighing clinical breakthroughs against structural risks to gauge value.
Analyzing GSK plc's market trajectory requires balancing the reality of immediate clinical readouts against the long-term horizons of its patent lifecycles. Following a major strategic pivot from defending legacy litigation to accelerating specialty pipeline growth, the company has experienced significant price volatility through early 2026. Evaluating the overarching GSK share price trend demands a close look at both its technical chart levels and the fundamental catalysts driving institutional sentiment. By breaking down recent earnings data, regulatory approvals, and analyst forecasts, investors can determine whether the stock's recent pullback offers a strategic entry point or signals deeper structural headwinds.
GSK's share price is currently navigating a mid-term correction phase after peaking in February 2026, consolidating between long-term support and short-term resistance. The stock is digesting a massive year-long rally while seeking a catalyst to break out of its current technical compression zone.
Over the trailing 12 months ending May 2026, GSK stock has delivered a solid ~33% positive return, though it has cooled significantly from its winter highs. The stock marched from a 52-week low of 1,288p ($35.45 for the NYSE ADR) in mid-2025 to a multi-year high of 2,282p ($61.70) by February 18, 2026. This aggressive 75% trough-to-peak climb was fueled by strong pipeline momentum—specifically the commercial success of the Arexvy RSV vaccine—and the aggressive deployment of a £2 billion share buyback program.
The trend shifted abruptly in late April 2026. Despite beating Q1 earnings estimates with 6.2% revenue growth, management chose not to upgrade full-year guidance. This lack of an upward revision triggered a "sell the news" reaction, dropping the stock roughly 16% from its February peak. The primary trade-off for investors currently evaluating GSK is deciding whether this pullback represents a fundamental stall in growth or a healthy valuation reset following a period of over-extension.
Current chart levels reveal a stock firmly wedged between its long-term bullish baseline and immediate short-term bearish pressure. Because GSK is dual-listed, institutional volume on both the London Stock Exchange (LSE:GSK) and New York Stock Exchange (NYSE:GSK) respects these specific algorithmic thresholds.
| Technical Metric | LSE:GSK (GBP) | NYSE:GSK (USD) | Implication for Trend |
|---|---|---|---|
| 200-Day Moving Average | ~1,850p | ~$46.70 | Serves as the macro price floor; holding above this level keeps the long-term bull trend intact. |
| 50-Day Moving Average | ~1,970p | ~$55.30 | Acts as dynamic overhead resistance; the stock is currently trading below this, signaling short-term weakness. |
| Primary Support | 1,848p | $49.00 | Immediate downside target based on recent May 2026 lows. A break below opens the door to testing the 200-day MA. |
| Overhead Resistance | 2,050p | $54.50 | The "gap-down" ceiling created during the late-April post-earnings sell-off. |
For value investors researching the best dividend stocks to buy now, the proximity of the stock to its 200-day moving average often signals a lower-risk entry point, provided that the macro support floor holds firm.
Daily technical indicators currently point to a bearish continuation, though the stock is approaching oversold conditions that typically trigger a short-term reversal bounce. The 14-day Relative Strength Index (RSI) is hovering in the low 40s—indicating clear downward momentum, but still above the sub-30 threshold that algorithmically signals a heavily oversold equity.
Simultaneously, the Moving Average Convergence Divergence (MACD) indicator registered a negative crossover in early May 2026. This mechanism reflects sustained institutional distribution following the Q1 earnings report, meaning sellers have commanded the daily closing auctions.
To confirm a genuine bullish reversal rather than a temporary bounce, GSK needs to post a high-volume daily close above its 50-day moving average. Until that happens, technical traders will likely treat the trend as a "sell the rally" environment. Fundamentally, recent positive news flow—such as the May 18th Japanese regulatory label expansion for Arexvy—acts as a counterweight, providing natural buying pressure that may prevent technical algorithms from pushing the stock into a deeper structural breakdown.
The GSK share price trend through 2025 and mid-2026 reflects a fundamental transition from legacy litigation defense to aggressive pipeline execution under new CEO Luke Miels. The primary catalysts driving equity valuation have been double-digit growth in Specialty Medicines, the systematic deployment of a £2 billion share buyback, and the final resolution of the Zantac overhang.
Clinical advancements and regulatory green lights in oncology and respiratory therapies have provided the core operational support for the stock. Investors have shifted focus from legacy patent cliffs to the company’s $30 billion, five-year R&D and advanced manufacturing expansion, prioritizing assets capable of offsetting General Medicine declines.
The removal of existential legal risk combined with aggressive capital return has re-rated GSK from a distressed pharmaceutical to a leading candidate among the best undervalued stocks to buy now. The Zantac litigation previously suppressed valuation multiples, but by locking in a definitive settlement framework in 2024—involving £672 million in initial payments followed by final tranches in late 2025—management effectively quantified and capped the legacy liability.
With the balance sheet derisked, GSK launched a £2 billion share buyback program in Q1 2025. By the end of Q1 2026, the company had executed £1.7 billion of this allocation. This buyback mathematically inflated Core EPS (which grew 12% in 2025 and 9% in Q1 2026) by reducing the outstanding float, directly supporting the share price during quarters where unfavorable currency exchanges or Medicare Part D pricing pressures created headwinds. Furthermore, a projected 70p full-year dividend for 2026 keeps GSK highly relevant for income-focused portfolios screening for the best dividend stocks to buy now.
Financial outperformance in Specialty Medicines has consistently anchored investor sentiment, though foreign exchange headwinds and declining General Medicines revenue have caused episodic volatility.
| Financial Metric | FY 2025 Results | Q1 2026 Results | FY 2026 Guidance |
|---|---|---|---|
| Total Turnover | £32.67 billion (+7% CER) | £7.63 billion (+5% CER) | 3% – 5% Growth |
| Core Operating Profit | +11% CER | £2.65 billion (+10% CER) | 7% – 9% Growth |
| Core EPS | 159.3p (+12% CER) | 46.5p (+9% CER) | 7% – 9% Growth |
| Dividend Per Share | 66p | 17p (Quarterly) | 70p (Expected) |
Despite beating Q1 2026 earnings estimates (46.5p vs. 43.3p consensus), GSK shares temporarily tumbled 5.6% in late April 2026. Markets scrutinized the quality of the beat, noting that approximately half of the EPS outperformance stemmed from one-off legal settlement provisions rather than core operations, compounded by a strong Sterling depressing USD-denominated revenues.
However, sentiment quickly stabilized as investors digested the reaffirmed 2026 guidance and management’s long-term target of exceeding £40 billion in sales by 2031. The market consensus treats GSK as a transitional asset: one that has successfully cleared its legal hurdles but must now prove its pipeline can sustain low double-digit growth in Specialty Medicines against a backdrop of a 6% decline in legacy drug sales.
Analysts project moderate upside for GSK’s share price through 2026, anchoring around a GBX 2,030–2,120 target on the London Stock Exchange. The market is currently balancing the firm's robust early-2026 specialty medicines performance against the lingering overhang of residual state-level litigation and uneven respiratory vaccine demand.
As of May 2026, the institutional consensus for GSK is firmly anchored at a "Hold" (or Neutral) rating, with the average 12-month price target suggesting a 6% to 10% upside from current trading levels.
2026 Analyst Price Targets (12-Month Outlook)
| Listing | Low Estimate | Average Consensus | High Estimate | Prevailing Rating |
|---|---|---|---|---|
| LSE (GBX) | 1,455 | 2,080 | 2,750 | Hold / Neutral |
| NYSE (USD) | $44.00 | $47.50 | $53.00 | Hold / Neutral |
Out of 20 major brokerage analysts tracked in May 2026, the distribution sits heavily at the median: 5 Buys, 13 Holds, and 2 Sells. This concentration reflects institutional caution. While GSK delivered a strong Q1 2026 earnings beat—growing core operating profit by 10% and reaffirming its full-year guidance—analysts remain hesitant to assign a premium valuation multiple. Trading at a forward P/E of roughly 13.7x, GSK frequently appears on retail screens for the best cheap stocks to buy now, but institutional analysts argue this discount is warranted until the company's £40 billion sales target for 2031 looks mathematically secure against approaching patent expirations.
GSK’s price action through the remainder of 2026 hinges on three specific levers: specialty pipeline execution, seasonal vaccine uptake, and the final resolution of state-level product liability cases.
With an ongoing commitment to a reliable payout ratio, retail yield-chasers consistently view GSK as one of the best dividend stocks to buy now. This dividend program provides a hard floor under the share price, preventing aggressive sell-offs even when individual pipeline catalysts miss expectations.
Based on its May 2026 trading profile, GSK is a consensus Hold for short-term momentum traders, but a Buy for value investors targeting yield and structural turnaround. The stock sits near 1,890p on the LSE (approximately $51.60 for the NYSE ADR), representing a 37% gain over a rolling one-year basis. However, the immediate GSK share price trend shows a 6% pullback over the last month. This recent price action reflects a tug-of-war between strong Q1 2026 core operating profit growth—up 10% year-over-year—and emerging headwinds in its respiratory vaccine portfolio. For those screening for the best stocks to buy now for long term stability, GSK offers a 3.27% dividend yield backed by surging oncology revenues (+28% in Q1) that currently offset pipeline volatility.
GSK trades at a significant discount to its peer group, carrying a trailing price-to-earnings (P/E) ratio of 13.1, which remains notably cheaper than both European and US rivals.
| Company | TTM P/E Ratio (May 2026) | Q1 2026 YoY Revenue Growth | Dividend Yield | Primary Valuation Driver |
|---|---|---|---|---|
| GSK plc (GSK) | 13.1x | +5% (CER) | ~3.3% | Value pricing due to looming HIV patent cliffs |
| AstraZeneca (AZN) | 26.7x | +17% (CER) | ~1.0% | Growth premium assigned to oncology pipeline |
| Novartis (NVS) | 21.4x | +10% (CER) | ~3.5% | Stable premium for cardiovascular/immunology dominance |
| Sanofi (SNY) | 16.7x | +7% (CER) | ~4.0% | Moderate discount tied to Dupixent reliance |
This discounted multiple often places GSK on institutional lists of the best undervalued stocks to buy now. The valuation gap stems entirely from market skepticism regarding its ability to replace revenue from its HIV franchise ahead of patent cliffs starting in 2028. While AstraZeneca commands a premium for its high-growth oncology targets, GSK is priced strictly as a cash-generating value asset. For investors filtering for the best dividend stocks to buy now, GSK provides a sustainable payout safely covered by the £1.4 billion in operational cash flow generated in the first quarter of 2026.
The primary threats capable of pushing the stock lower are the sharply declining sales of its RSV vaccine and the impending loss of exclusivity in its core HIV portfolio.
Over the past year, GSK plc's share price has shown a positive trend, delivering an approximate 33% increase. As of May 2026, shares have recently traded between £16.90 and £18.60 on the London Stock Exchange, and near $51 for its US American Depositary Receipts (ADRs). This recent market performance has been largely supported by the company's strong earnings growth in its specialty medicines division.
Navigating the GSK share price trend requires balancing the stock's short-term technical correction against its long-term fundamental transformation. While sluggish RSV vaccine sales and upcoming HIV patent cliffs present real risks, the company’s strong oncology revenue, robust dividend yield, and aggressive share buybacks provide a solid foundation for value investors. As GSK continues to execute its specialty medicines pipeline and move beyond legacy litigation, the stock remains a compelling consideration for portfolios prioritizing steady income and structural turnaround potential.
728 RM B 7/F GEE LOK IND BLDG NO 34 HUNG TO RD KWUN TONG KLN HONG KONG


The risk of loss in trading financial instruments such as stocks, FX, commodities, futures, bonds, ETFs and crypto can be substantial. You may sustain a total loss of the funds that you deposit with your broker. Therefore, you should carefully consider whether such trading is suitable for you in light of your circumstances and financial resources.
No decision to invest should be made without thoroughly conducting due diligence by yourself or consulting with your financial advisors. Our web content might not suit you since we don't know your financial conditions and investment needs. Our financial information might have latency or contain inaccuracy, so you should be fully responsible for any of your trading and investment decisions. The company will not be responsible for your capital loss.
Without getting permission from the website, you are not allowed to copy the website's graphics, texts, or trademarks. Intellectual property rights in the content or data incorporated into this website belong to its providers and exchange merchants.
Not Logged In
Log in to access more features


Log In
Sign Up


