• Trade
  • Markets
  • Copy
  • Contests
  • News
  • 24/7
  • Calendar
  • Q&A
  • Chats
Trending
Screeners
SYMBOL
LAST
BID
ASK
HIGH
LOW
NET CHG.
%CHG.
SPREAD
SPX
S&P 500 Index
6838.27
6838.27
6838.27
6861.30
6834.81
+10.86
+ 0.16%
--
DJI
Dow Jones Industrial Average
48492.72
48492.72
48492.72
48679.14
48476.78
+34.68
+ 0.07%
--
IXIC
NASDAQ Composite Index
23207.24
23207.24
23207.24
23345.56
23186.20
+12.08
+ 0.05%
--
USDX
US Dollar Index
97.810
97.890
97.810
98.070
97.790
-0.140
-0.14%
--
EURUSD
Euro / US Dollar
1.17587
1.17594
1.17587
1.17596
1.17262
+0.00193
+ 0.16%
--
GBPUSD
Pound Sterling / US Dollar
1.33944
1.33953
1.33944
1.34014
1.33546
+0.00237
+ 0.18%
--
XAUUSD
Gold / US Dollar
4320.53
4320.94
4320.53
4350.16
4294.68
+21.14
+ 0.49%
--
WTI
Light Sweet Crude Oil
56.696
56.726
56.696
57.601
56.666
-0.537
-0.94%
--

Community Accounts

Signal Accounts
--
Profit Accounts
--
Loss Accounts
--
View More

Become a signal provider

Sell trading signals to earn additional income

View More

Guide to Copy Trading

Get started with ease and confidence

View More

Signal Accounts for Members

All Signal Accounts

Best Return
  • Best Return
  • Best P/L
  • Best MDD
Past 1W
  • Past 1W
  • Past 1M
  • Past 1Y

All Contests

  • All
  • Trump Updates
  • Recommend
  • Stocks
  • Cryptocurrencies
  • Central Banks
  • Featured News
Top News Only
Share

Poland Had Equivalent Of EUR 4.87 Billion On Its Forex Accounts At End Of November

Share

Ukraine's Military Says It Hit Russian Gas Processing Plant In Astrakhan

Share

Ukraine's Top Negotiator: Talks With USA Have Been Constructive And Productive

Share

The Nasdaq Golden Dragon China Index Fell 0.9% In Early Trading

Share

The S&P 500 Opened 32.78 Points Higher, Or 0.48%, At 6860.19; The Dow Jones Industrial Average Opened 136.31 Points Higher, Or 0.28%, At 48594.36; And The Nasdaq Composite Opened 134.87 Points Higher, Or 0.58%, At 23330.04

Share

Miran: Goods Inflation Could Be Settling In At A Higher Level Than Was Normal Before The Pandemic, But That Will Be More Than Offset By Housing Disinflation

Share

Miran, Who Dissented In Favor Of A Larger Cut At Last Fed Meeting, Repeats Keeping Policy Too Tight Will Lead To Job Losses

Share

Miran: Does Not Think Higher Goods Inflation Is Mostly From Tariffs, But Acknowledges Does Not Have A Full Explanation For It

Share

Toronto Stock Index .GSPTSE Rises 67.16 Points, Or 0.21 Percent, To 31594.55 At Open

Share

Miran: Excluding Housing And Non-Market Based Items, Core Pce Inflation May Be Below 2.3%, “Within Noise” Of The Fed's 2% Target

Share

Polish State Assets Minister Balczun Says Jsw Needs Over USD 830 Million Financing To Keep Liquidity For A Year

Share

Miran: Prices Are “Once Again Stable” And Monetary Policy Should Reflect That

Share

Fed's Miran: Current Excess Inflation Is Not Reflective Of Underlying Supply And Demand In The Economy

Share

Portugal Treasury Puts 2026 Net Financing Needs At 13 Billion Euros, Up From 10.8 Billion In 2025

Share

Portugal Treasury Expects 2026 Net Financing Needs At 29.4 Billion Euros, Up From 25.8 Billion In 2025

Share

Bank Of America Says With Indonesia's Smelter Now Ramping Up, It Expects Aluminium Supply Growth To Accelerate To 2.6% Year On Year In 2026

Share

Bank Of America Expects A Deficit In Aluminium Next Year And Sees Prices Pushing Above $3000/T

Share

Fed Data - USA Effective Federal Funds Rate At 3.64 Percent On 12 December On $102 Billion In Trades Versus 3.64 Percent On $99 Billion On 11 December

Share

Brazil's Petrobras Says No Impact Seen On Oil, Petroleum Products Output As Workers Start Planned Strike

Share

Statement: US Travel Group Warns New Proposed Trump Administration Requirements For Foreign Tourists To Provide Social Media Histories Could Mean Millions Of People Opting Not To Visit

TIME
ACT
FCST
PREV
Japan Tankan Large Non-Manufacturing Outlook Index (Q4)

A:--

F: --

P: --

Japan Tankan Large Manufacturing Outlook Index (Q4)

A:--

F: --

P: --

Japan Tankan Small Manufacturing Diffusion Index (Q4)

A:--

F: --

P: --

Japan Tankan Large Manufacturing Diffusion Index (Q4)

A:--

F: --

P: --

Japan Tankan Large-Enterprise Capital Expenditure YoY (Q4)

A:--

F: --

P: --

U.K. Rightmove House Price Index YoY (Dec)

A:--

F: --

P: --

China, Mainland Industrial Output YoY (YTD) (Nov)

A:--

F: --

P: --

China, Mainland Urban Area Unemployment Rate (Nov)

A:--

F: --

P: --

Saudi Arabia CPI YoY (Nov)

A:--

F: --

P: --

Euro Zone Industrial Output YoY (Oct)

A:--

F: --

P: --

Euro Zone Industrial Output MoM (Oct)

A:--

F: --

P: --

Canada Existing Home Sales MoM (Nov)

A:--

F: --

P: --

Canada National Economic Confidence Index

A:--

F: --

P: --

Canada New Housing Starts (Nov)

A:--

F: --

P: --
U.S. NY Fed Manufacturing Employment Index (Dec)

A:--

F: --

P: --

U.S. NY Fed Manufacturing Index (Dec)

A:--

F: --

P: --

Canada Core CPI YoY (Nov)

A:--

F: --

P: --

Canada Manufacturing Unfilled Orders MoM (Oct)

A:--

F: --

P: --

U.S. NY Fed Manufacturing Prices Received Index (Dec)

A:--

F: --

P: --

U.S. NY Fed Manufacturing New Orders Index (Dec)

A:--

F: --

P: --

Canada Manufacturing New Orders MoM (Oct)

A:--

F: --

P: --

Canada Core CPI MoM (Nov)

A:--

F: --

P: --

Canada Trimmed CPI YoY (SA) (Nov)

A:--

F: --

P: --

Canada Manufacturing Inventory MoM (Oct)

A:--

F: --

P: --

Canada CPI YoY (Nov)

A:--

F: --

P: --

Canada CPI MoM (Nov)

A:--

F: --

P: --

Canada CPI YoY (SA) (Nov)

A:--

F: --

P: --

Canada Core CPI MoM (SA) (Nov)

A:--

F: --

P: --

Canada CPI MoM (SA) (Nov)

A:--

F: --

P: --

Federal Reserve Board Governor Milan delivered a speech
U.S. NAHB Housing Market Index (Dec)

--

F: --

P: --

Australia Composite PMI Prelim (Dec)

--

F: --

P: --

Australia Services PMI Prelim (Dec)

--

F: --

P: --

Australia Manufacturing PMI Prelim (Dec)

--

F: --

P: --

Japan Manufacturing PMI Prelim (SA) (Dec)

--

F: --

P: --

U.K. 3-Month ILO Employment Change (Oct)

--

F: --

P: --

U.K. Unemployment Claimant Count (Nov)

--

F: --

P: --

U.K. Unemployment Rate (Nov)

--

F: --

P: --

U.K. 3-Month ILO Unemployment Rate (Oct)

--

F: --

P: --

U.K. Average Weekly Earnings (3-Month Average, Including Bonuses) YoY (Oct)

--

F: --

P: --

U.K. Average Weekly Earnings (3-Month Average, Excluding Bonuses) YoY (Oct)

--

F: --

P: --

France Services PMI Prelim (Dec)

--

F: --

P: --

France Composite PMI Prelim (SA) (Dec)

--

F: --

P: --

France Manufacturing PMI Prelim (Dec)

--

F: --

P: --

Germany Services PMI Prelim (SA) (Dec)

--

F: --

P: --

Germany Manufacturing PMI Prelim (SA) (Dec)

--

F: --

P: --

Germany Composite PMI Prelim (SA) (Dec)

--

F: --

P: --

Euro Zone Composite PMI Prelim (SA) (Dec)

--

F: --

P: --

Euro Zone Services PMI Prelim (SA) (Dec)

--

F: --

P: --

Euro Zone Manufacturing PMI Prelim (SA) (Dec)

--

F: --

P: --

U.K. Services PMI Prelim (Dec)

--

F: --

P: --

U.K. Manufacturing PMI Prelim (Dec)

--

F: --

P: --

U.K. Composite PMI Prelim (Dec)

--

F: --

P: --

Euro Zone ZEW Economic Sentiment Index (Dec)

--

F: --

P: --

Germany ZEW Current Conditions Index (Dec)

--

F: --

P: --

Germany ZEW Economic Sentiment Index (Dec)

--

F: --

P: --

Euro Zone Trade Balance (Not SA) (Oct)

--

F: --

P: --

Euro Zone ZEW Current Conditions Index (Dec)

--

F: --

P: --

Euro Zone Trade Balance (SA) (Oct)

--

F: --

P: --

U.S. Retail Sales MoM (Excl. Automobile) (SA) (Oct)

--

F: --

P: --

Q&A with Experts
    • All
    • Chatrooms
    • Groups
    • Friends
    Connecting
    .
    .
    .
    Type here...
    Add Symbol or Code

      No matching data

      All
      Trump Updates
      Recommend
      Stocks
      Cryptocurrencies
      Central Banks
      Featured News
      • All
      • Russia-Ukraine Conflict
      • Middle East Flashpoint
      • All
      • Russia-Ukraine Conflict
      • Middle East Flashpoint
      Search
      Products

      Charts Free Forever

      Chats Q&A with Experts
      Screeners Economic Calendar Data Tools
      Membership Features
      Data Warehouse Market Trends Institutional Data Policy Rates Macro

      Market Trends

      Market Sentiment Order Book Forex Correlations

      Top Indicators

      Charts Free Forever
      Markets

      News

      News Analysis 24/7 Columns Education
      From Institutions From Analysts
      Topics Columnists

      Latest Views

      Latest Views

      Trending Topics

      Top Columnists

      Latest Update

      Signals

      Copy Rankings Latest Signals Become a signal provider AI Rating
      Contests
      Brokers

      Overview Brokers Assessment Rankings Regulators News Claims
      Broker listing Forex Brokers Comparison Tool Live Spread Comparison Scam
      Q&A Complaint Scam Alert Videos Tips to Detect Scam
      More

      Business
      Events
      Careers About Us Advertising Help Center

      White Label

      Data API

      Web Plug-ins

      Affiliate Program

      Awards Institution Evaluation IB Seminar Salon Event Exhibition
      Vietnam Thailand Singapore Dubai
      Fans Party Investment Sharing Session
      FastBull Summit BrokersView Expo
      Recent Searches
        Top Searches
          Markets
          News
          Analysis
          User
          24/7
          Economic Calendar
          Education
          Data
          • Names
          • Latest
          • Prev

          View All

          No data

          Scan to Download

          Faster Charts, Chat Faster!

          Download App
          English
          • English
          • Español
          • العربية
          • Bahasa Indonesia
          • Bahasa Melayu
          • Tiếng Việt
          • ภาษาไทย
          • Français
          • Italiano
          • Türkçe
          • Русский язык
          • 简中
          • 繁中
          Open Account
          Search
          Products
          Charts Free Forever
          Markets
          News
          Signals

          Copy Rankings Latest Signals Become a signal provider AI Rating
          Contests
          Brokers

          Overview Brokers Assessment Rankings Regulators News Claims
          Broker listing Forex Brokers Comparison Tool Live Spread Comparison Scam
          Q&A Complaint Scam Alert Videos Tips to Detect Scam
          More

          Business
          Events
          Careers About Us Advertising Help Center

          White Label

          Data API

          Web Plug-ins

          Affiliate Program

          Awards Institution Evaluation IB Seminar Salon Event Exhibition
          Vietnam Thailand Singapore Dubai
          Fans Party Investment Sharing Session
          FastBull Summit BrokersView Expo

          Gold News: Traders Watch Fed Policy Clues And Inflation Data For Gold Price Prediction

          Golden Gleam

          Commodity

          Summary:

          Gold hovers at key technical levels as traders await a breakout or breakdown near the 50-day moving average. Fed’s dovish tone and rate cut expectations continue to underpin gold market sentiment despite a slightly firmer dollar. Soft U.S. CPI and anticipated weak PPI strengthen the gold price forecast ahead of Jackson Hole policy clues.

          Key Points:

          • Gold hovers at key technical levels as traders await a breakout or breakdown near the 50-day moving average.
          • Fed’s dovish tone and rate cut expectations continue to underpin gold market sentiment despite a slightly firmer dollar.
          • Soft U.S. CPI and anticipated weak PPI strengthen the gold price forecast ahead of Jackson Hole policy clues.

          Gold Prices Forecast: Will the Fed’s Dovish Tilt Drive an Upside Breakout?

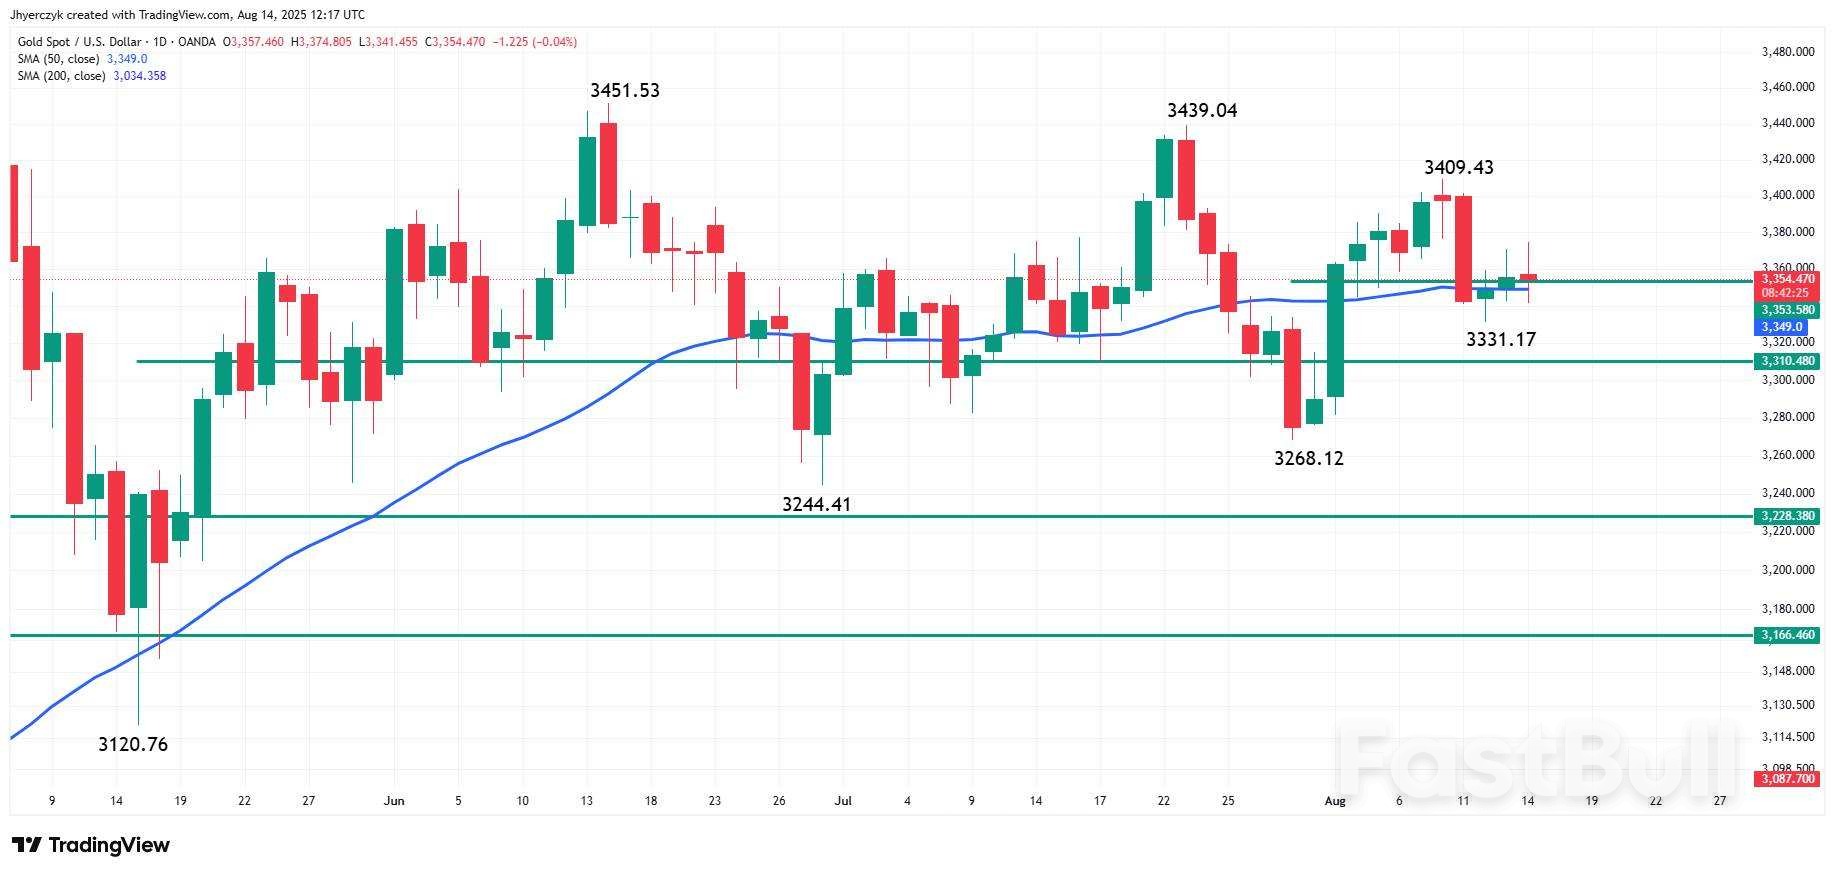
          Daily Gold (XAU/USD)

          Gold is trading slightly lower on Thursday as it hovers around two key technical levels — the short-term pivot at $3353.58 and the 50-day moving average at $3349.00. Price action at these thresholds will likely dictate near-term direction, with bulls eyeing a break above the August 8 minor high at $3409.43. A downside breach of $3349.00 could expose gold to deeper losses toward $3331.17, and possibly down to the long-term support at $3310.48.

          At 12:26 GMT, XAU/USD is trading $3355.53, down $0.160 or -0.00%.

          Firmer Dollar Caps Gold, But Dovish Fed Expectations Lend Support

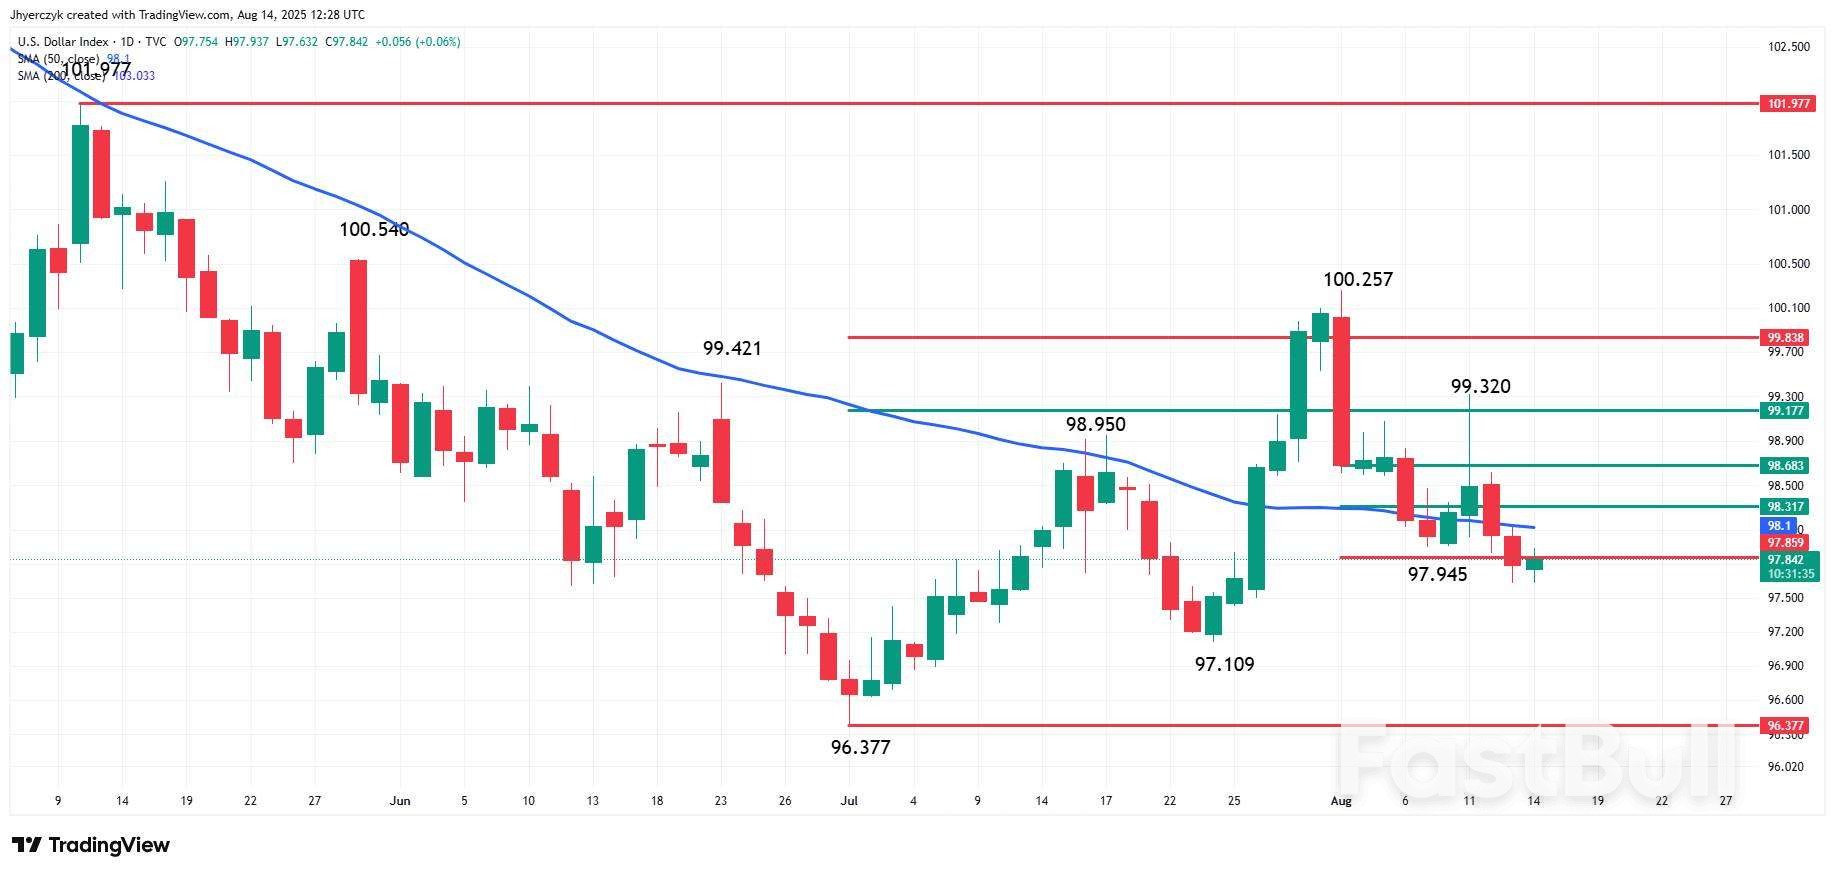
          Daily US Dollar Index (DXY)

          The U.S. dollar index firmed modestly, pressuring gold, but remained near multi-week lows. Traders are largely positioning for an interest rate cut at the Fed’s next meeting. According to LSEG data, markets are fully pricing in a September rate cut, with roughly 7% odds of a 50 basis-point move. U.S. Treasury Secretary Scott Bessent stoked these expectations, stating that the Fed should consider a “series of rate cuts” and open the door to an aggressive start.

          Non-yielding gold typically gains in a lower interest rate environment, and the market is increasingly betting that the Fed will ease policy further before year-end. Treasury yields continued to drift lower, with the 10-year at 4.208% and the 2-year at 3.662%, reflecting growing conviction around policy easing.

          US Inflation and Jobs Data to Steer the Next Leg

          All eyes are now on Thursday’s U.S. Producer Price Index and weekly jobless claims for further confirmation that the Fed has room to cut. Earlier in the week, July’s CPI data came in softer than expected, easing concerns about tariff-driven inflation. Traders are betting that continued labor market softness and subdued inflation will justify the Fed’s dovish lean going into its Jackson Hole symposium next week.

          Commodities strategist Nitesh Shah noted that despite Thursday’s marginal price dip, gold remains well-supported by the broader rate environment. The market will look to fresh data to reinforce this bullish bias.

          Market Forecast: Bullish Outlook If Key Resistance Clears

          Gold remains in consolidation, but the broader setup favors the bulls as dovish Fed rhetoric and falling yields provide fundamental support. A sustained move above $3353.58 will likely open the door toward $3409.43.

          On the downside, failure to hold the 50-day MA at $3349.00 risks a drop to $3331.17, with $3310.48 as the next key support. Near-term, the gold prices forecast leans bullish, contingent on upcoming inflation data validating rate-cut bets.

          Source: Kitco

          Risk Warnings and Disclaimers
          You understand and acknowledge that there is a high degree of risk involved in trading. Following any strategies or investment methods may lead to potential losses. The content on the site is provided by our contributors and analysts for information purposes only. You are solely responsible for determining whether any trading assets, securities, strategy, or any other product is suitable for investing based on your own investment objectives and financial situation.
          Add to Favorites
          Share

          USD/JPY Technical: Further potential drop towards ascending range support

          Adam

          Forex

          The emergence of the Japanese yen’s strength has materialized as expected that saw the USD/JPY recording a week-to-date drop of -0.9% at this time of writing and breaking below the first support of 146.60 highlighted in our previous report (printed an intraday low of 146.21 on Thursday, 14 August).

          Dovish Fed Funds rate futures pricing triggered by US Treasury Secretary‘s jawboning

          The recent bout of Japanese yen strength has been yesterday’s jawboning by a key US White House official, the US Treasury Secretary Bessent, during a prime-time television interview, urging the US Federal Reserve to be more dovish, and suggested cutting interest rates by 150 basis points (bps) or more, starting with a 50 bps in the upcoming September FOMC meeting.
          Based on the latest data from the CME FedWatch tool, the Fed Funds futures market has now started to price in a possibility of a 52% chance for a third Fed rate cut of 25 bps to occur on the last FOMC meeting of 2025 on 12 December to bring the Fed funds rate lower to 3.75%-3.5%, up from an earlier expectation of 2 rate cuts before Bessent’s media interview.
          Let’s decipher the latest technical developments in the USD/JPY and update its short-term directional bias (1 to 3 days) from a technical analysis perspective.
          USD/JPY Technical: Further potential drop towards ascending range support_1

          Fig. 1: USD/JPY minor trend as of 14 Aug 2025

          USD/JPY Technical: Further potential drop towards ascending range support_2

          Fig. 2: 5-day rolling performances of the US dollar against major currencies as of 14 Aug 2025

          USD/JPY Technical: Further potential drop towards ascending range support_3

          Fig. 3: US/Japan implied short-term interest rate curve with USD/JPY as of 13 Aug 2025

          Preferred trend bias (1-3 days)

          Maintain bearish bias in any bounces for the USD/JPY with key short-term pivotal resistance at 147.85 (also the 20-day moving average), with next supports coming in at 145.85 and 145.10/144.80 (also the key medium-term ascending range support in place since 22 April 2025 low) (see Fig. 1).

          Key elements

          The hourly RSI momentum indicator of the USD/JPY has dipped into the oversold region (below the 30 level) but has not flashed any bullish divergence condition. These observations suggest a potential imminent minor bounce on the USD/JPY rather than a steeper mean reversion rebound.
          In the past four weeks, the Japanese yen has lagged other major currencies in terms of relative performance against the greenback. Based on the five-day rolling performance as of Thursday, 14 August, the US dollar is now performing the second-worst against the Japanese yen; the USD/JPY has recorded a loss of -0.4%, below the US Dollar Index (-0.1%) (see Fig. 2).
          The monthly implied short-term interest rate spread (via short-term interest rate futures) between the US and Japan has continued to narrow in the next three months from 3.85% in August to 3.60% in September to 3.36% in October, and to 3.23% in November. This narrowing of the US/Japan implied short-term interest rate spread is likely to put downside pressure on the USD/JPY (see Fig. 3).

          Alternative trend bias (1 to 3 days)

          A clearance above 147.85 invalidates the bearish scenario and sees a squeeze up towards the upper limit of the medium-term ascending range configuration for the next intermediate resistances to come in at 148.75 and 149.50 (also the key 200-day moving average).

          Source: marketpulse

          Risk Warnings and Disclaimers
          You understand and acknowledge that there is a high degree of risk involved in trading. Following any strategies or investment methods may lead to potential losses. The content on the site is provided by our contributors and analysts for information purposes only. You are solely responsible for determining whether any trading assets, securities, strategy, or any other product is suitable for investing based on your own investment objectives and financial situation.
          Add to Favorites
          Share

          The UK Economy Grows Despite Tariff Pressures, Outpacing G7 Peers

          Warren Takunda

          Economic

          The UK economy defied US tariff pressures in the second quarter, expanding by 0.3% and outpacing most G7 peers despite a slowdown from the optimistic 0.7% growth seen earlier in the year. Strong performances in the services and construction sector helped drive the gains, offsetting a drop in manufacturing and other production sectors.
          Compared with the same period last year, the economy expanded by 1.2%. While hardly spectacular, the performance has been enough to reassure policymakers and investors that the UK remains on a relatively stable path in a volatile global environment.

          The UK leads the G7 on a half-year basis

          Beneath the headline numbers, the picture was mixed. Services output rose by 0.4%, led by information and communication, health, and social work. Wholesale and retail trade, however, failed to keep pace.
          Construction delivered the standout performance, climbing 1.2% thanks to strong infrastructure projects and private housing activity. In contrast, the production sector slipped by 0.3%, pulled lower by steep drops in electricity, gas and steam supply, as well as mining and quarrying. That said, manufacturing posted a slight 0.3% gain, buoyed by a 7.0% leap in pharmaceuticals and 3.0% growth in machinery and equipment.
          A notable 0.4% uptick in monthly GDP for June—spanning services, production, and construction—helped counterbalance weak activity in April and May, pointing to a June-led recovery.
          Trade dynamics painted a mixed picture. Export volumes rose by 1.6% year-on-year, largely due to stronger services exports, despite a 0.2% drop in goods exports. Import volumes rose 1.4%, driven by a rise in goods imports, while services imports slipped slightly.
          The narrative underpinning the data included a pre-emptive economic pull-forward into February and March—companies front-loaded activity ahead of stamp duty adjustments and US tariff announcements. This phenomenon helped inflate Q1 figures and weighed on output in the early part of Q2, only for a rebound to surface in June.
          When placed alongside global peers, the UK's performance in 2025 so far looks comparatively strong. In Q2 2025, the UK’s 0.3% growth rate matched or exceeded that of other G7 nations. France also grew 0.3%, while Canada was flat, and Germany and Italy contracted by 0.1% each.
          Although the United States outpaced with 0.7% growth, the UK leads the G7 on a half-year basis. Combining Q1 and Q2 yields an annualised rate of 2.2%, the fastest in the group.

          Source: Euronews

          To stay updated on all economic events of today, please check out our Economic calendar
          Risk Warnings and Disclaimers
          You understand and acknowledge that there is a high degree of risk involved in trading. Following any strategies or investment methods may lead to potential losses. The content on the site is provided by our contributors and analysts for information purposes only. You are solely responsible for determining whether any trading assets, securities, strategy, or any other product is suitable for investing based on your own investment objectives and financial situation.
          Add to Favorites
          Share

          Gold (XAUUSD) & Silver Price Forecast: Fed Cut Bets Offset Equity Market Rally

          Adam

          Commodity

          Market Overview

          Gold’s three-day advance lost momentum in Asian trading as stronger global risk sentiment drew investors toward equities and away from safe-haven assets. The shift was fueled by optimism over a potential three-month extension to the US-China trade truce and anticipation of Friday’s US-Russia summit, which markets hope will yield progress on the Ukraine conflict.
          The S&P 500 and Nasdaq Composite closed at record highs for the second consecutive session, with most Asian benchmarks tracking those gains, barring Japan’s Nikkei 225.
          Despite this, gold continues to find underlying support from a weaker US dollar and persistent expectations of monetary easing. The CME FedWatch Tool shows a 25-basis-point rate cut in September as the base case, with markets pricing in two additional cuts before year-end.
          July’s Nonfarm Payrolls undershot expectations, reinforcing views of a cooling labor market. Treasury yields remain subdued ahead of the US Producer Price Index release, which could shape near-term rate cut probabilities.

          Silver Tracks Gold’s Moves Amid Risk-On Backdrop

          Silver mirrored gold’s pullback, with prices easing as risk appetite stayed firm across equity markets. The same macro drivers—a trade truce extension and diplomatic overtures between Washington and Moscow—have tempered safe-haven demand for the metal.
          However, silver’s downside remains cushioned by the broader monetary policy outlook and weaker yields. Like gold, it benefits from expectations that the Fed will adopt a more accommodative stance in the months ahead.
          Any signs of slowing industrial demand have been offset by the metal’s dual role as a monetary hedge, which keeps it sensitive to shifts in rate expectations.

          Outlook: Balancing Risk Appetite Against Policy Easing

          For both gold and silver, near-term direction hinges on the balance between strong risk sentiment and dovish central bank expectations. While optimism over trade and diplomatic developments has dampened safe-haven flows, the prospect of US rate cuts, subdued Treasury yields, and a softer dollar provides a counterweight.
          Traders will focus on upcoming US inflation and growth data for confirmation of the Fed’s policy path. If expectations for deeper rate cuts gain traction, both metals could see renewed buying interest despite the current risk-on bias in broader markets.

          Short-Term Forecast

          Gold is consolidating above $3,337 support, with a rebound targeting $3,376–$3,436 if momentum builds. Silver holds above $38.15, aiming for $38.73–$39.52 while broader uptrends remain intact.

          Gold Prices Forecast: Technical Analysis

          Gold (XAUUSD) & Silver Price Forecast: Fed Cut Bets Offset Equity Market Rally_1Gold – Chart

          Gold is consolidating above a key ascending trendline, with the 2-hour chart showing price holding near $3,337 support. The 50-EMA ($3,360) and 100-EMA ($3,360) are slightly above, acting as near-term resistance. RSI is hovering around the midline, signaling balanced momentum after a recent pullback.
          A rebound from the current support could drive price toward $3,376, followed by $3,409 and $3,436 if bullish momentum builds. However, a break below $3,337 would expose $3,312 and potentially $3,288.

          Silver (XAG/USD) Price Forecast: Technical Outlook

          Gold (XAUUSD) & Silver Price Forecast: Fed Cut Bets Offset Equity Market Rally_2Silver – Chart

          Silver’s rally from early August has paused near resistance, with price still supported by a rising trendline. The 50-EMA at $38.17 and 100-EMA at $38.03 remain below, keeping the short-term bias bullish. Immediate support sits at $38.15, with stronger levels at $37.56 and $37.17.
          Resistance is seen at $38.73, then $39.14 and $39.52. The RSI has eased from overbought, signaling a slowdown in momentum.
          A rebound from $38.15 could retest $38.73 and potentially target higher levels, while a close below this point risks a pullback toward $37.56. The broader uptrend holds as long as the price stays above $37.17.

          Source: fxempire

          Risk Warnings and Disclaimers
          You understand and acknowledge that there is a high degree of risk involved in trading. Following any strategies or investment methods may lead to potential losses. The content on the site is provided by our contributors and analysts for information purposes only. You are solely responsible for determining whether any trading assets, securities, strategy, or any other product is suitable for investing based on your own investment objectives and financial situation.
          Add to Favorites
          Share

          Strong Data Support Further Growth of The Pound

          FxPro

          Economic

          Forex

          An extensive package of statistics on the United Kingdom published on Thursday morning showed mostly better-than-expected data, excluding foreign trade data. However, strong fundamental data failed to support the pound, which appears somewhat exhausted from its growth over the past couple of weeks.

          The economy grew by 0.4% in June, against expectations of 0.2%, and it also delivered growth of 0.4% quarter-on-quarter and 1.2% compared to the same quarter a year earlier. The services sector continues to make a positive contribution to the economy, with the index rising by 0.3% in June after 0.1% in May. The industrial production index added 0.7% in June, but this was after an accumulated decline of 1.5% over the previous three months. The UK industrial production index has been drifting around current levels for the past three years.

          The construction industry continues to recover, probably supported by monetary policy easing. The corresponding industry activity index is almost entirely on the trajectory it entered after 2013, when the economy recovered from the mortgage crisis.

          The pound began to rebound on 1 August after touching the Fibonacci support level of 61.8% of the growth from the January lows to the peak at the start of July. The latest rally of 3.5% from 1.3140 to almost 1.3600 looks like a resumption of growth after a corrective pullback. However, confirmation of this pattern will only come after exceeding 1.3800, the highs at the start of July.

          For now, we are seeing a very strong wave of resistance at current levels, which has been stopping and reversing the pound’s growth against the dollar since the end of May, apart from a brief breakout at the end of June. If this year’s highs are updated, it will be a serious breakthrough, opening growth potential to 1.48–1.50 with intermediate stops at 1.4250.

          On Thursday, the pound is struggling to rise against the dollar due to the latter’s strengthening and accumulated fatigue from growth since the beginning of the month. However, the pound feels quite confident against the euro, rolling back EURGBP to 0.8600 — lows since early July — confirming the strength of two-year resistance.

          Source: FxPro

          To stay updated on all economic events of today, please check out our Economic calendar
          Risk Warnings and Disclaimers
          You understand and acknowledge that there is a high degree of risk involved in trading. Following any strategies or investment methods may lead to potential losses. The content on the site is provided by our contributors and analysts for information purposes only. You are solely responsible for determining whether any trading assets, securities, strategy, or any other product is suitable for investing based on your own investment objectives and financial situation.
          Add to Favorites
          Share

          Over 20,000 Arrested In Iran On Suspicion Of Espionage During War With Israel

          Samantha Luan

          Economic

          Political

          Iranian police arrested around 21,000 people on various charges during the 12-day war with Israel, Iran's national police force reported on Tuesday. According to local media, more than 7,850 public tips were received during the fighting, leading to the arrests.The spokesperson of the Iranian police, Saed Montazer al-Mahdi, noted that the Iranian Cyber Police (FATA) handled 5,700 cybercrime cases, including internet fraud, unauthorized withdrawals, and a cyber attack on the Nobitex exchange.

          He said 2,774 “illegal citizens” were detained, with 261 people arrested on suspicion of espionage and 172 detained for unauthorized filming – some for filming “sensitive centers” around the country. Examinations of the suspects' mobile phones led to the opening of 30 special security cases.Speaking on the Evin Prison incident, Mahdi stated that police arrested 127 “security and political” inmates during an escape attempt, including two of whom were dressed in firefighter uniforms.Fars News Agency reported on July 25 that more than 700 people had been detained over the previous 12 days on charges of “security cooperation with Israel.”

          Separately, judiciary spokesman Asghar Jahangir said on 22 July that 75 prisoners escaped during an Israeli missile strike on Evin Prison.According to Shargh Media Group, Iranian Minister of Intelligence Ismail Khatib said, “The intelligence and security organizations have the resources [personnel, assets, and operational capabilities] to mobilize them both internally and within the regime itself. During the imposed 12-day war, we witnessed seven million public reports.”He added, “We hope that as this unity has been the axis of destroying all influence, hostility, conspiracy, and sedition, we will all be able to protect this unity and cohesion.”

          During the June war, Israel launched coordinated attacks inside Iran, killing senior military and intelligence officials, nuclear scientists, and striking key military sites and administrative infrastructure.Analysts speculate that the purpose of striking administrative buildings and infrastructure is to weaken the Iranian government's grip and control over its border provinces with the hope of seeding unrest and separatist movements.Both during and after the war, Iranian security forces seized large caches of explosives, drones, and weapons, along with workshops used for manufacturing unmanned systems from within the country itself.

          Since then, the hunt for infiltrating agents has continued across the country, with leaders urging citizens to “maintain their vigilance, as they showed during the war.”

          Source: Zero Hedge

          To stay updated on all economic events of today, please check out our Economic calendar
          Risk Warnings and Disclaimers
          You understand and acknowledge that there is a high degree of risk involved in trading. Following any strategies or investment methods may lead to potential losses. The content on the site is provided by our contributors and analysts for information purposes only. You are solely responsible for determining whether any trading assets, securities, strategy, or any other product is suitable for investing based on your own investment objectives and financial situation.
          Add to Favorites
          Share

          Trump’s pressure mounts. The Fed cornered. Will the dollar weaken further?

          Adam

          Economic

          Market reaction to inflation data – Wall Street rallies, dollar softens

          July’s US inflation data came in line with expectations for headline CPI and slightly higher on the core measure, but markets interpreted the release as supportive of a more accommodative Federal Reserve. On 12 August, Wall Street indices closed the session with notable gains, reflecting increased investor optimism over the economic outlook and interest rate prospects. The US dollar weakened against major currencies, while US Treasury yields declined. Fed Funds Futures almost fully priced in a 25bp rate cut in September, with markets also increasing bets on further easing before year-end.
          The Fed’s dual mandate is shifting further towards prioritising maximum employment, a stance echoed by a growing number of Federal Open Market Committee (FOMC) members. The upcoming Jackson Hole symposium, due at the end of next week, will offer Chair Jerome Powell an opportunity to adjust the policy narrative. Historically, the Central Bankers’ Symposium in the Rocky Mountains has often marked turning points in US monetary policy.

          Slower consumer price growth

          In July 2025, headline CPI rose by 0.2% m/m compared with 0.3% in June, while the annual rate held steady at 2.7%, in line with forecasts. Core inflation edged up to 0.3% m/m and 3.1% y/y from 0.2% and 2.9% respectively, modestly exceeding expectations on the yearly reading.
          Price breakdown – energy falls, food flat
          Energy prices fell by 1.1% m/m, while food prices were unchanged. In core goods (excluding vehicles), price growth slowed to +0.2% m/m from +0.55% in June. Increases were seen in furniture (+0.9%), used cars (+0.5%), sporting goods (+0.4%) and clothing (+0.1%). Household appliance prices unexpectedly declined by 0.9%.
          Seasonal gains in services
          Airfares rose by 4% m/m, while medical services costs increased by 0.7%, largely due to dental services. Shelter costs rose only modestly, by 0.2%.
          No tariff-driven inflation pressure
          The absence of signs of rising inflationary pressure following President Trump’s tariff measures suggests that businesses are absorbing higher costs in their margins rather than passing them on to consumers. This is supported by the latest NFIB survey, which showed the share of small firms planning price hikes in the next three months falling to 28% from 32%, pointing to demand-side constraints.
          Inflation and Fed policy outlook
          Analysts see little risk of inflation breaching 4% y/y this autumn, with growing odds of a decline below 2% by the end of 2026. The data reinforce expectations for a 25bp Fed rate cut in September, followed by another in December. Fed Funds Futures are currently pricing in 26bp of easing at the 17 September FOMC meeting and a total of 63bp by year-end.
          Trump’s pressure mounts. The Fed cornered. Will the dollar weaken further?_1

          Market pricing of the US interest rate path based on Fed Funds Futures

          Trump steps up pressure on Powell

          President Donald Trump has intensified his calls for swift rate cuts, even suggesting he might sue Fed Chair Jerome Powell, accusing him of incompetence in overseeing building renovations at the central bank.
          FOMC members’ comments
          Thomas Barkin noted that the balance of risks for the labour market and inflation remains unclear, and that the Fed is well positioned to respond appropriately. Stephen Miran, a new Board Governor appointed by Trump, stated that there is no evidence of tariff-driven inflation, adding that rent increases are partly linked to illegal immigration. Jeff Schmid argued that while growth remains solid, inflation is still too high, warranting a moderately restrictive stance. He added, however, that he would be prepared to change his view should demand weaken materially.

          What next for the dollar?

          In the week ending 5 August, net short USD positions fell sharply by $4.3bn – the fourth consecutive weekly reduction. The net short now stands at $7bn, down from a local peak of $18.6bn in early July.
          It is worth noting that these figures are lagging indicators and do not yet reflect the most recent moves in FX markets. The unwinding of short positions was visible in EUR/USD’s July pullback, although the latest disappointing non-farm payrolls data reignited selling pressure on the dollar. The uptrend in the pair remains technically intact, and August’s inflation figures have only strengthened the likelihood of further gains. The next upside target for EUR/USD is 1.18, with a break above this level opening the way towards 1.20–1.23.
          Trump’s pressure mounts. The Fed cornered. Will the dollar weaken further?_2

          Chart of the main currency pair EUR/USD, daily data

          Source: marketpulse

          To stay updated on all economic events of today, please check out our Economic calendar
          Risk Warnings and Disclaimers
          You understand and acknowledge that there is a high degree of risk involved in trading. Following any strategies or investment methods may lead to potential losses. The content on the site is provided by our contributors and analysts for information purposes only. You are solely responsible for determining whether any trading assets, securities, strategy, or any other product is suitable for investing based on your own investment objectives and financial situation.
          Add to Favorites
          Share
          FastBull
          Copyright © 2025 FastBull Ltd

          728 RM B 7/F GEE LOK IND BLDG NO 34 HUNG TO RD KWUN TONG KLN HONG KONG

          TelegramInstagramTwitterfacebooklinkedin
          App Store Google Play Google Play
          Products
          Charts

          Chats

          Q&A with Experts
          Screeners
          Economic Calendar
          Data
          Tools
          Membership
          Features
          Function
          Markets
          Copy Trading
          Latest Signals
          Contests
          News
          Analysis
          24/7
          Columns
          Education
          Company
          Careers
          About Us
          Contact Us
          Advertising
          Help Center
          Feedback
          User Agreement
          Privacy Policy
          Business

          White Label

          Data API

          Web Plug-ins

          Poster Maker

          Affiliate Program

          Risk Disclosure

          The risk of loss in trading financial instruments such as stocks, FX, commodities, futures, bonds, ETFs and crypto can be substantial. You may sustain a total loss of the funds that you deposit with your broker. Therefore, you should carefully consider whether such trading is suitable for you in light of your circumstances and financial resources.

          No decision to invest should be made without thoroughly conducting due diligence by yourself or consulting with your financial advisors. Our web content might not suit you since we don't know your financial conditions and investment needs. Our financial information might have latency or contain inaccuracy, so you should be fully responsible for any of your trading and investment decisions. The company will not be responsible for your capital loss.

          Without getting permission from the website, you are not allowed to copy the website's graphics, texts, or trademarks. Intellectual property rights in the content or data incorporated into this website belong to its providers and exchange merchants.

          Not Logged In

          Log in to access more features

          FastBull Membership

          Not yet

          Purchase

          Become a signal provider
          Help Center
          Customer Service
          Dark Mode
          Price Up/Down Colors

          Log In

          Sign Up

          Position
          Layout
          Fullscreen
          Default to Chart
          The chart page opens by default when you visit fastbull.com